


Use breakpoints to pause your JavaScript code. This guide explains each type of breakpoint that's available in DevTools, as well as when to use and how to set each type. For an interactive tutorial of the debugging process, seeGet Started with Debugging JavaScript in Chrome DevTools.
Overview of when to use each breakpoint type
The most well-known type of breakpoint is line-of-code. But line-of-code breakpoints can be inefficient to set, especially if you don't know exactly where to look, or if you are working with a large codebase. You can save yourself time when debugging by knowing how and when to use the other types of breakpoints.
| Breakpoint Type | Use this when you want to... |
|---|---|
| Line-of-code | Pause on an exact region of code. |
| Conditional line-of-code | Pause on an exact region of code, but only when some other condition is true. |
| Logpoint | Log a message to theConsolewithout pausing the execution. |
| DOM | Pause on the code that changes or removes a specific DOM node, or its children. |
| XHR | Pause when an XHR URL contains a string pattern. |
| Event listener | Pause on the code that runs after an event, such asclick,is fired. |
| Exception | Pause on the line of code that is throwing a caught or uncaught exception. |
| Function | Pause whenever a specific function is called. |
| Trusted Type | Pause onTrusted Typeviolations. |
Line-of-code breakpoints
Use a line-of-code breakpoint when you know the exact region of code that you need to investigate. DevToolsalwayspauses before this line of code is executed.
To set a line-of-code breakpoint in DevTools:
- Click theSourcestab.
- Open the file containing the line of code you want to break on.
- Go to the line of code.
- To the left of the line of code is the line number column. Click it. A blue icon appears on top of the line number column.
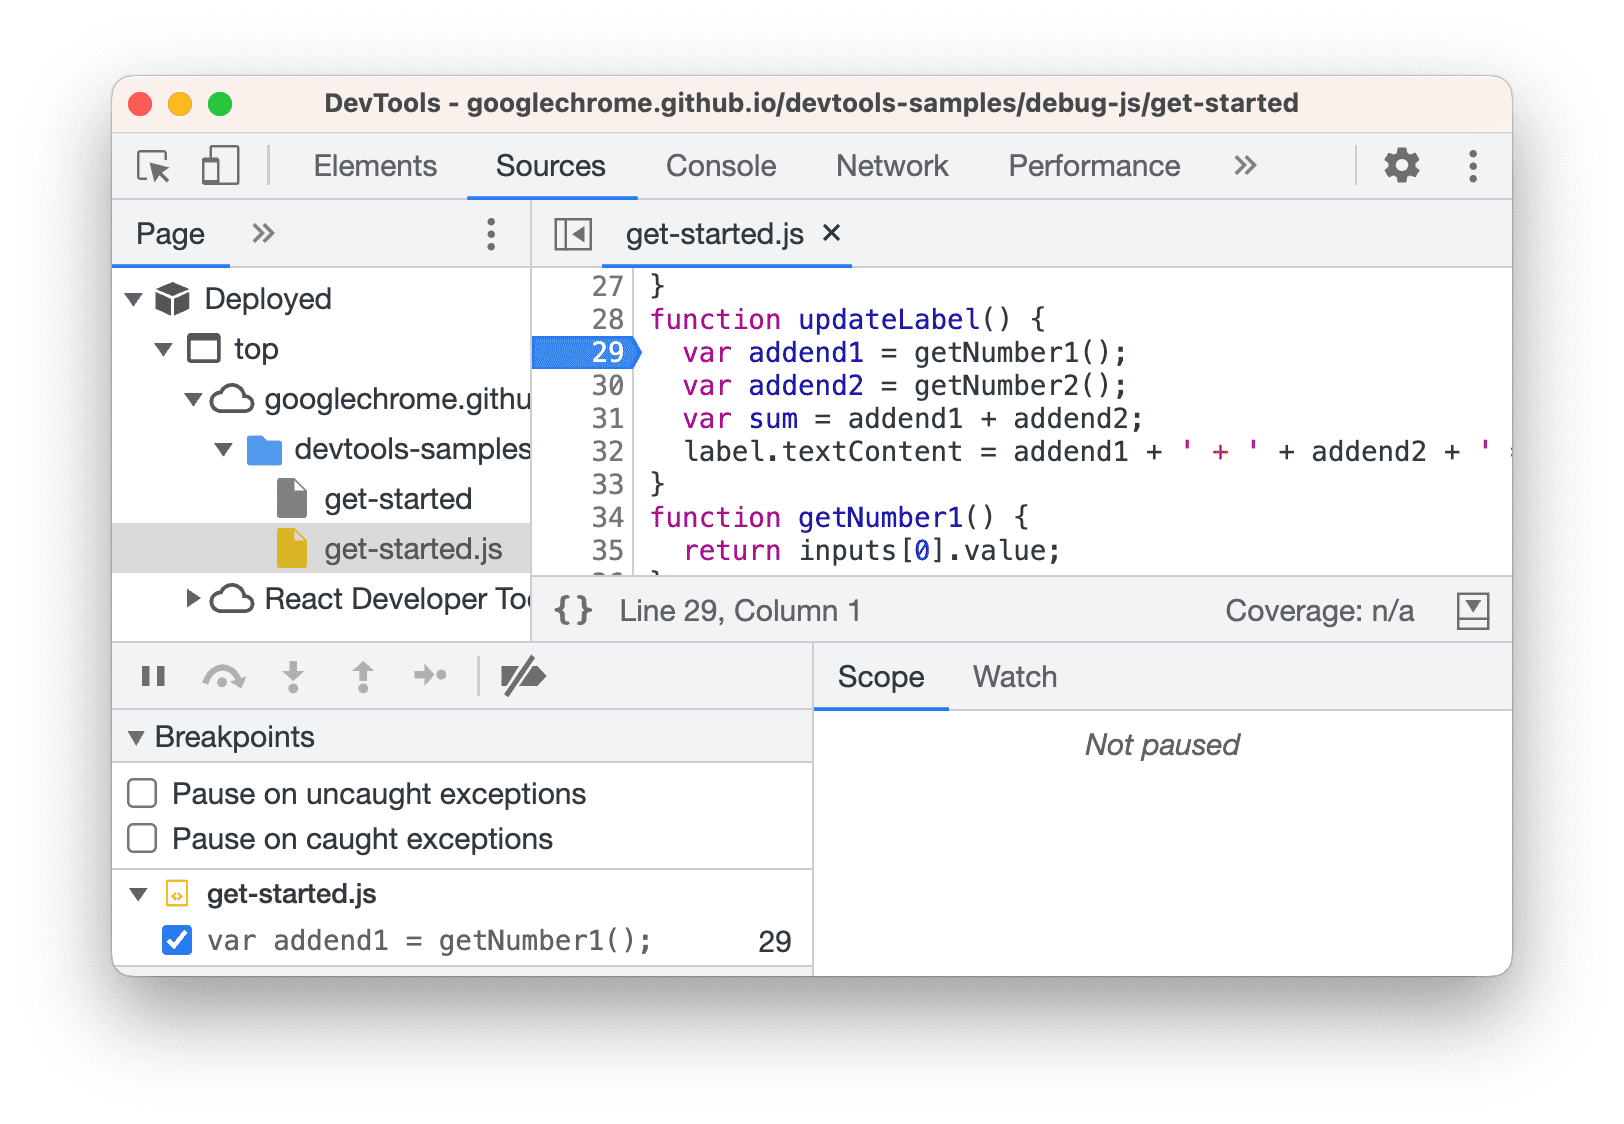
This example shows a line-of-code breakpoint set on line29.
Line-of-code breakpoints in your code
Calldebuggerfrom your code to pause on that line. This is equivalent to aline-of-code
breakpoint,except that the breakpoint is set in your code, not in the DevTools UI.
console.log('a');
console.log('b');
debugger;
console.log('c');
Conditional line-of-code breakpoints
Use a conditional line-of-code breakpoint when you want to stop the execution but only when some condition is true.
Such breakpoints are useful when you want to skip breaks that are irrelevant to your case, especially in a loop.
To set a conditional line-of-code breakpoint:
- Open theSourcestab.
- Open the file containing the line of code you want to break on.
- Go to the line of code.
- To the left of the line of code is the line number column. Right-click it.
- SelectAdd conditional breakpoint.A dialog displays underneath the line of code.
- Enter your condition in the dialog.
- PressEnterto activate the breakpoint. An orange icon with a question mark appears on top of the line number column.

This example shows a conditional line-of-code breakpoint that fired only when thexexceeded10in a loop at iterationi=6.
Log line-of-code breakpoints
Use log line-of-code breakpoints (logpoints) to log messages to theConsolewithout pausing the execution and without cluttering up your code withconsole.log()calls.
To set a logpoint:
- Open theSourcestab.
- Open the file containing the line of code you want to break on.
- Go to the line of code.
- To the left of the line of code is the line number column. Right-click it.
- SelectAdd logpoint.A dialog displays underneath the line of code.
Enter your log message in the dialog. You can use the same syntax as you would with a
console.log(message)call.For example, you can log:
"A string" + num, str.length > 1, str.toUpperCase(), objIn this case, the logged message is:
// str = "test" // num = 3 // obj = {attr: "x" } A string 42 true TEST {attr: 'x'}PressEnterto activate the breakpoint. A pink icon with two dots appears on top of the line number column.

This example shows a logpoint at line 30 that logs a string and a variable value to theConsole.
Edit line-of-code breakpoints
Use theBreakpointspane to disable, edit, or remove line-of-code breakpoints.
Edit groups of breakpoints
TheBreakpointspane groups the breakpoints by file and orders them by line and column numbers. You can do the following with groups:
- To collapse or expand a group, click its name.
- To enable or disable a group or breakpoint individually, click
 next to the group or the breakpoint.
 - To remove a group, hover over it and click
 .
.
This video shows how to collapse groups and disable or enable breakpoints one by one or by groups. When you disable a breakpoint, theSourcespanel makes its marker next to the line number transparent.
Groups have context menus. In theBreakpointspane, right-click a group and choose:

- Remove all breakpoints in file (group).
- Disable all breakpoints in file.
- Enable all breakpoints in file.
- Remove all breakpoints (in all files).
- Remove other breakpoints (in other groups).
Edit breakpoints
To edit a breakpoint:
- Click
 next to a breakpoint to enable or disable it. When you disable a breakpoint, theSourcespanel makes its marker next to the line number transparent.
 - Hover over a breakpoint and click
 to edit and
 to remove it.
 When editing a breakpoint, change its type from the drop-down list in the inline editor.

Right-click a breakpoint to see its context menu and choose one of the options:

- Reveal location.
- Edit condition or logpoint.
- Enable all breakpoints.
- Disable all breakpoints.
- Remove breakpoint.
- Remove other breakpoints (in all files).
- Remove all breakpoints (in all files).
Watch the video to see various breakpoint edits in action: disable, remove, edit condition, reveal location from the menu, and change type.
DOM change breakpoints
Use a DOM change breakpoint when you want to pause on the code that changes a DOM node or its children.
To set a DOM change breakpoint:
- Click theElementstab.
- Go to the element that you want to set the breakpoint on.
- Right-click the element.
- Hover overBreak onthen selectSubtree modifications,Attribute modifications,or Node removal.

This example shows the context menu for creating a DOM change breakpoint.
You can find a list of DOM change breakpoints in:
- Elements>DOM Breakpointspane.
- Sources>DOM Breakpointsside pane.

There you can:
- Enable or disable them with
 .
. - Right-click >RemoveorRevealthem in the DOM.
Types of DOM change breakpoints
- Subtree modifications.Triggered when a child of the currently-selected node is removed or added, or the contents of a child are changed. Not triggered on child node attribute changes, or on any changes to the currently-selected node.
- Attributes modifications:Triggered when an attribute is added or removed on the currently-selected node, or when an attribute value changes.
- Node Removal:Triggered when the currently-selected node is removed.
XHR/fetch breakpoints
Use an XHR/fetch breakpoint when you want to break when the request URL of an XHR contains a specified
string. DevTools pauses on the line of code where the XHR callssend().
One example of when this is helpful is when you see that your page is requesting an incorrect URL, and you want to quickly find the AJAX or Fetch source code that is causing the incorrect request.
To set an XHR/fetch breakpoint:
- Click theSourcestab.
- Expand theXHR Breakpointspane.
- Click
 Add breakpoint.
 - Enter the string which you want to break on. DevTools pauses when this string is present anywhere in an XHR's request URL.
- PressEnterto confirm.

This example shows how to create an XHR/fetch breakpoint in theXHR/fetch Breakpointsfor any request that contains
orgin the URL.
Event listener breakpoints
Use event listener breakpoints when you want to pause on the event listener code that runs after an
event is fired. You can select specific events, such asclick,or categories of events, such as
all mouse events.
- Click theSourcestab.
- Expand theEvent Listener Breakpointspane. DevTools shows a list of event categories, such asAnimation.
- Check one of these categories to pause whenever any event from that category is fired, or expand the category and check a specific event.

This example shows how to create an event listener breakpoint fordeviceorientation.
Additionally, theDebuggerpauses on events that happen inweb workersorworkletsof any type, including theShared Storage Worklets.

This example shows theDebuggerpaused on asetTimerevent that happened in a service worker.
You can also find a list of event listeners in theElements>Event Listenerspane.
Exception breakpoints
Use exception breakpoints when you want to pause on the line of code that's throwing a caught or uncaught exception. You can pause on both such exceptions independently in any debug session other thanNode.js.
In theBreakpointspane of theSourcestab, enable one of the following options or both, then execute the code:
Check
 Pause on uncaught exceptions.
In this example, the execution is paused on an uncaught exception.
Check
 Pause on caught exceptions.
In this example, the execution is paused on a caught exception.
Exceptions in asynchronous calls
With either or both caught and uncaught checkboxes turned on, theDebuggerattempts to pause on the corresponding exceptions in both synchronous and asynchronous calls. In the asynchronous case, theDebuggerlooks for rejection handlers across promises to determine when to stop.
Caught exceptions and ignored code
WithIgnore Listturned on, theDebuggerpauses on exceptions caught either in non-ignored frames or passing through such a frame in the call stack.
The next example shows theDebuggerpaused on a caught exception thrown by the ignoredlibrary.jsthat passes through non-ignoredmycode.js.

To learn more aboutDebuggerbehavior in edge cases, test a collection of scenarios on thisdemo page.
Function breakpoints
Calldebug(functionName),wherefunctionNameis the function you want to debug, when you want to
pause whenever a specific function is called. You can insertdebug()into your code (like a
console.log()statement) or call it from the DevTools Console.debug()is equivalent to setting
aline-of-code breakpointon the first line of the function.
function sum(a, b) {
let result = a + b; // DevTools pauses on this line.
return result;
}
debug(sum); // Pass the function object, not a string.
sum();
Make sure the target function is in scope
DevTools throws aReferenceErrorif the function you want to debug is not in scope.
(function () {
function hey() {
console.log('hey');
}
function yo() {
console.log('yo');
}
debug(yo); // This works.
yo();
})();
debug(hey); // This doesn't work. hey() is out of scope.
Ensuring the target function is in scope can be tricky if you're callingdebug()from the DevTools
Console. Here's one strategy:
- Set aline-of-code breakpointsomewhere where the function is in scope.
- Trigger the breakpoint.
- Call
debug()in the DevTools Console while the code is still paused on your line-of-code breakpoint.
Trusted Type breakpoints
TheTrusted Type APIprovides protection against security exploits known ascross-site scripting(XSS) attacks.
In theBreakpointspane of theSourcestab, go to theCSP Violation Breakpointssection and enable one of the following options or both, then execute the code:
Check
 Sink Violations.
In this example, the execution is paused on a sink violation.
Check
 Policy Violations.
In this example, the execution is paused on a policy violation. Trusted Type policies are set up using
trustedTypes.createPolicy.
You can find more information about using the API:
- To further your security aims, visitPrevent DOM-based cross-site scripting vulnerabilities with Trusted Types.
- For debugging, visitImplementing CSP and Trusted Types debugging in Chrome DevTools.