


Discover new ways to analyze how your page loads in this comprehensive reference of Chrome DevTools network analysis features.
Record network requests
By default, DevTools records all network requests in theNetworkpanel, so long as DevTools is open.
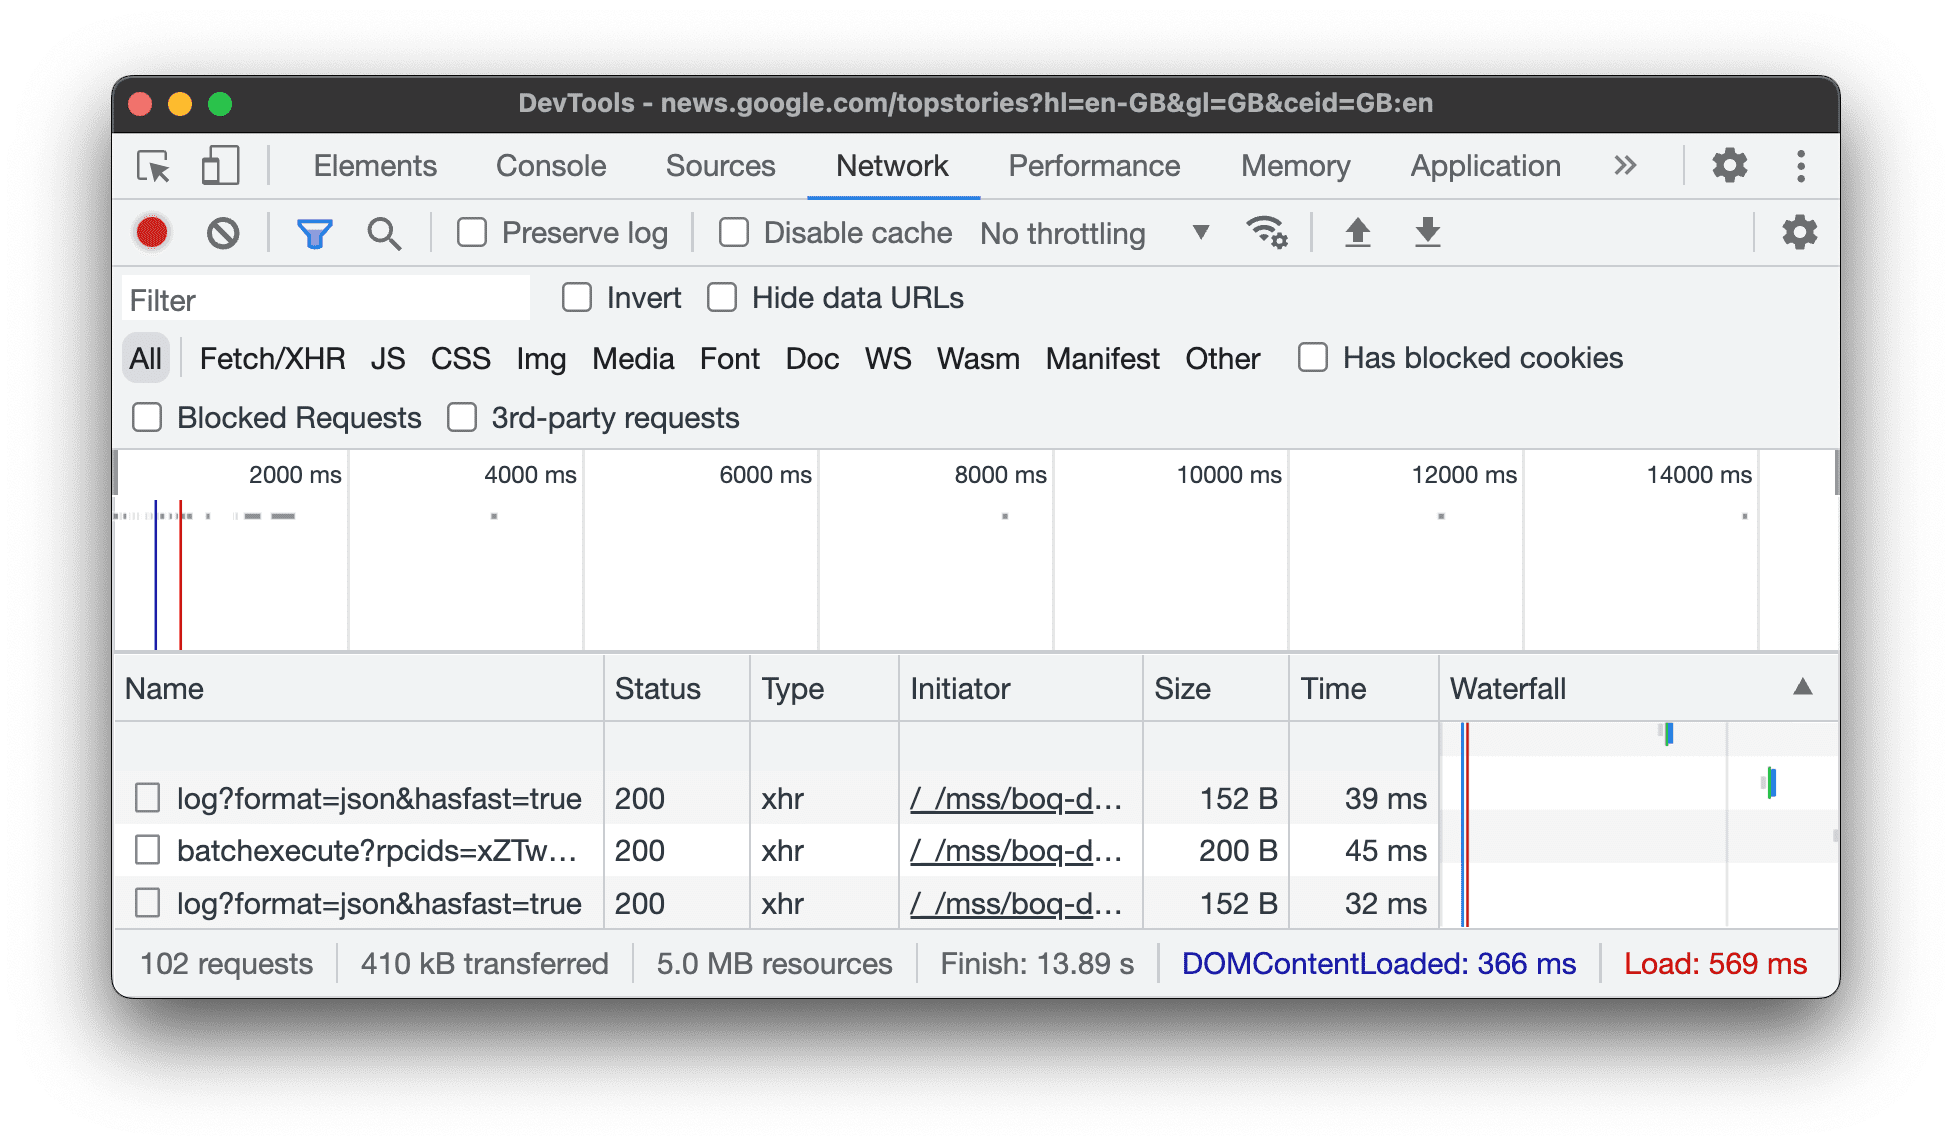
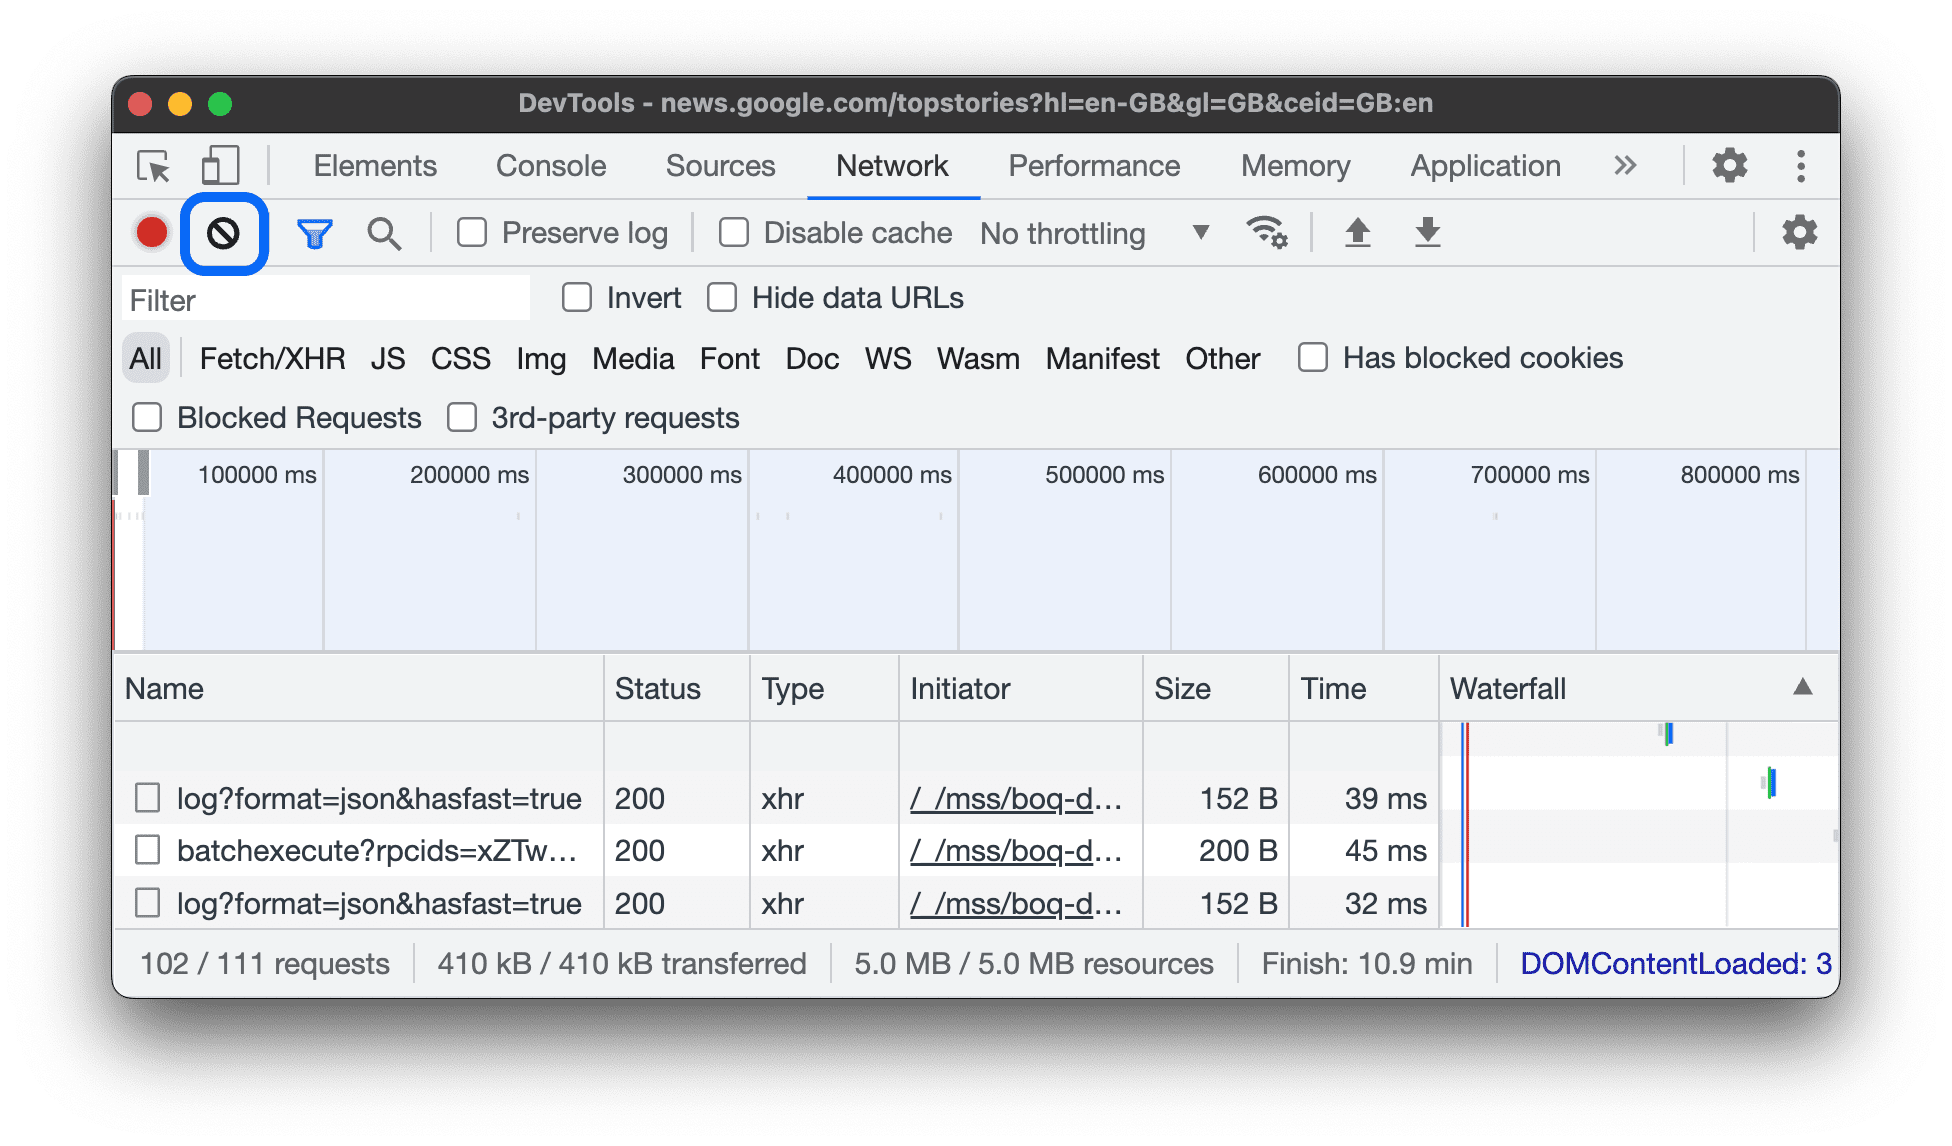
Stop recording network requests
To stop recording requests:
- ClickStop recording network log
 on theNetworkpanel. It turns grey to indicate that DevTools is no longer recording requests.
 - PressCommand> +E(Mac) orControl+E(Windows, Linux) while theNetworkpanel is in focus.
Clear requests
ClickClear
![]() on theNetworkpanel to clear all requests from theRequeststable.
on theNetworkpanel to clear all requests from theRequeststable.
Save requests across page loads
To save requests across page loads, check thePreserve logcheckbox on theNetworkpanel. DevTools saves all requests until you disablePreserve log.
Capture screenshots during page load
Capture screenshots to analyze what users see as they wait for your page to load.
To enable screenshots, openSettings![]() inside theNetworkpanel and checkCapture screenshots.
inside theNetworkpanel and checkCapture screenshots.
Reload the page while theNetworkpanel is in focus to capture screenshots.
Once captured, you can interact with screenshots in the following ways:
- Hover over a screenshot to view the point at which that screenshot was captured. A yellow line appears on the Overview pane.
- Click a screenshot's thumbnail to filter out any requests that occurred after the screenshot was captured.
- Double-click a thumbnail to zoom in on it.

Replay XHR request
To replay an XHR request, do one of the following in theRequeststable:
- Select the request and pressR.
- Right-click the request and selectReplay XHR.

Change loading behavior
Emulate a first-time visitor by disabling the browser cache
To emulate how a first-time user experiences your site, check theDisable cachecheckbox. DevTools disables the browser cache. This more accurately emulates a first-time user's experience, because requests are served from the browser cache on repeat visits.

Disable the browser cache from the Network conditions drawer
If you want to disable the cache while working in other DevTools panels, use theNetwork conditions drawer.
- Click the
 icon to open theNetwork Conditionsdrawer.
 - Check or clear theDisable cachecheckbox.
Manually clear the browser cache
To manually clear the browser cache at any time, right-click anywhere in theRequeststable and selectClear browser cache.

Emulate offline
There's a new class of web apps, calledProgressive Web Apps,which can function offline with the help ofservice workers.When you're building this type of app, it's useful to be able to quickly simulate a device that has no data connection.
To simulate a completely offline network experience, selectOfflinefrom theNetwork throttlingdrop-down menu next to theDisable cachecheckbox.

DevTools displays a warning icon next to theNetworktab to remind you that offline is enabled.
Emulate slow network connections
To emulate slow 3G, fast 3G, and other connection speeds, select the corresponding options from theThrottlingmenu.
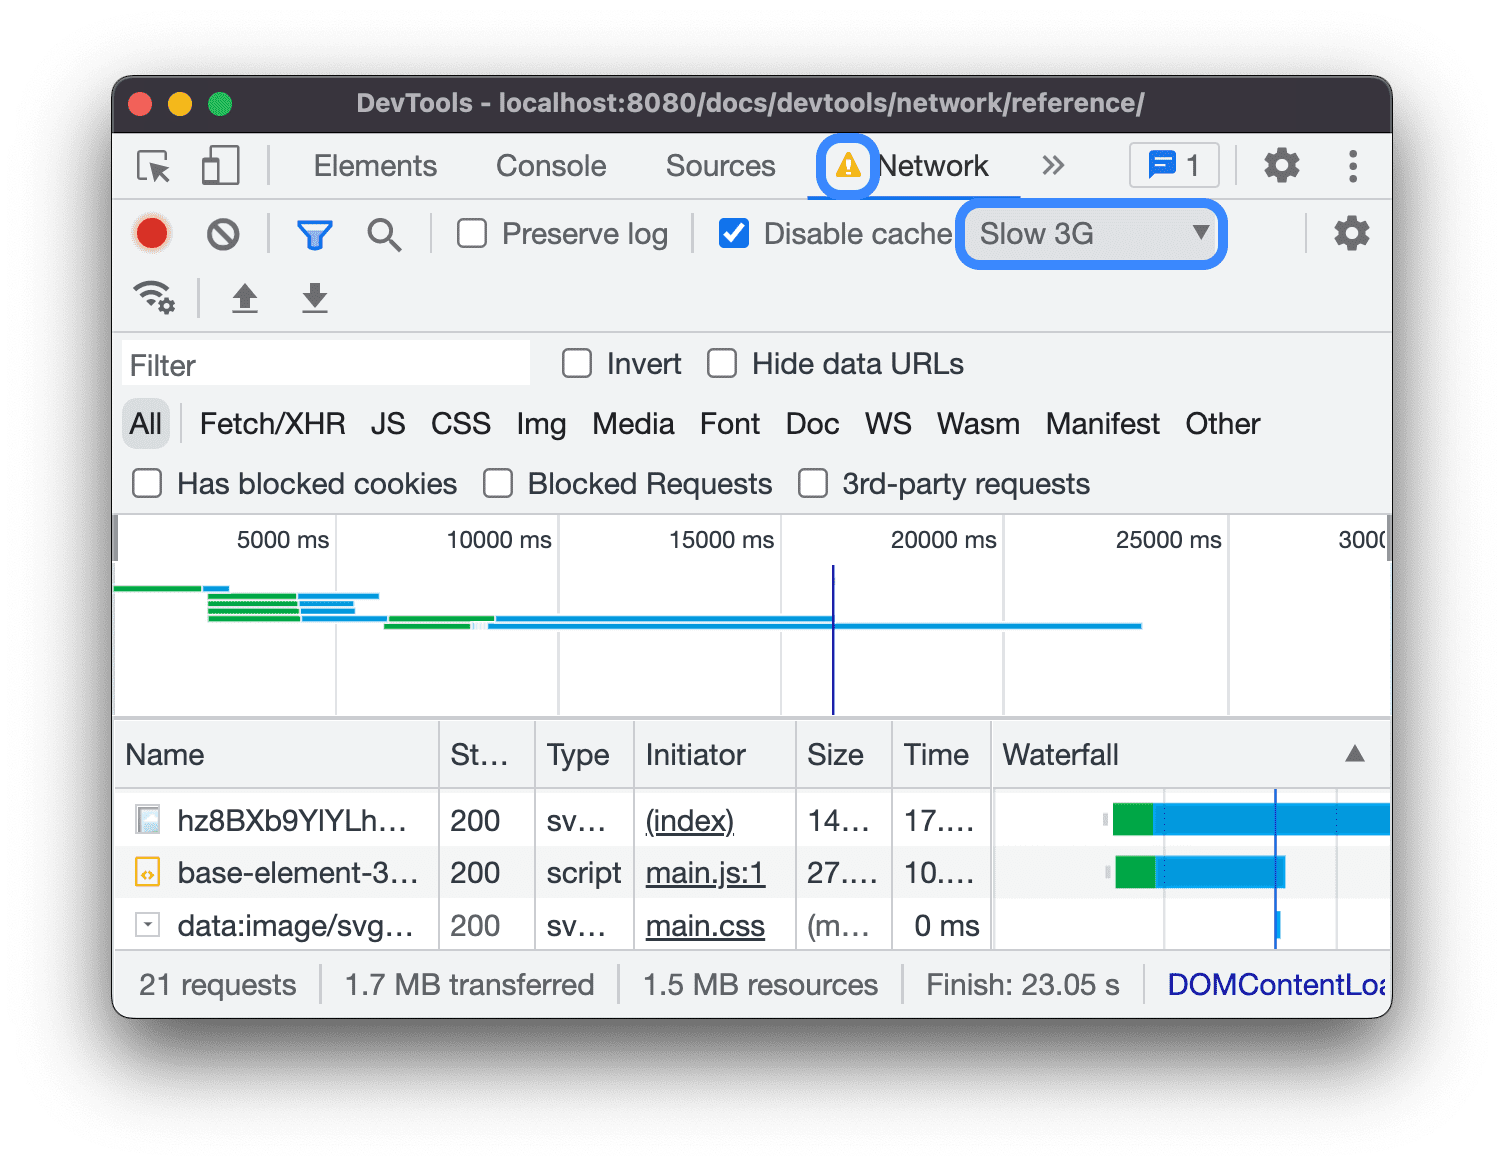
DevTools displays a warning icon next to theNetworktab to remind you that throttling is enabled.
Create custom throttling profiles
In addition to presets, such as slow or fast 3G, you can also add your own custom throttling profiles:
- Open theThrottlingmenu and selectCustom>Add....
- Set up a new throttling profile as described insettingsSettings>Throttling.
Back on theNetworkpanel, select your new profile from theThrottlingdrop-down menu.
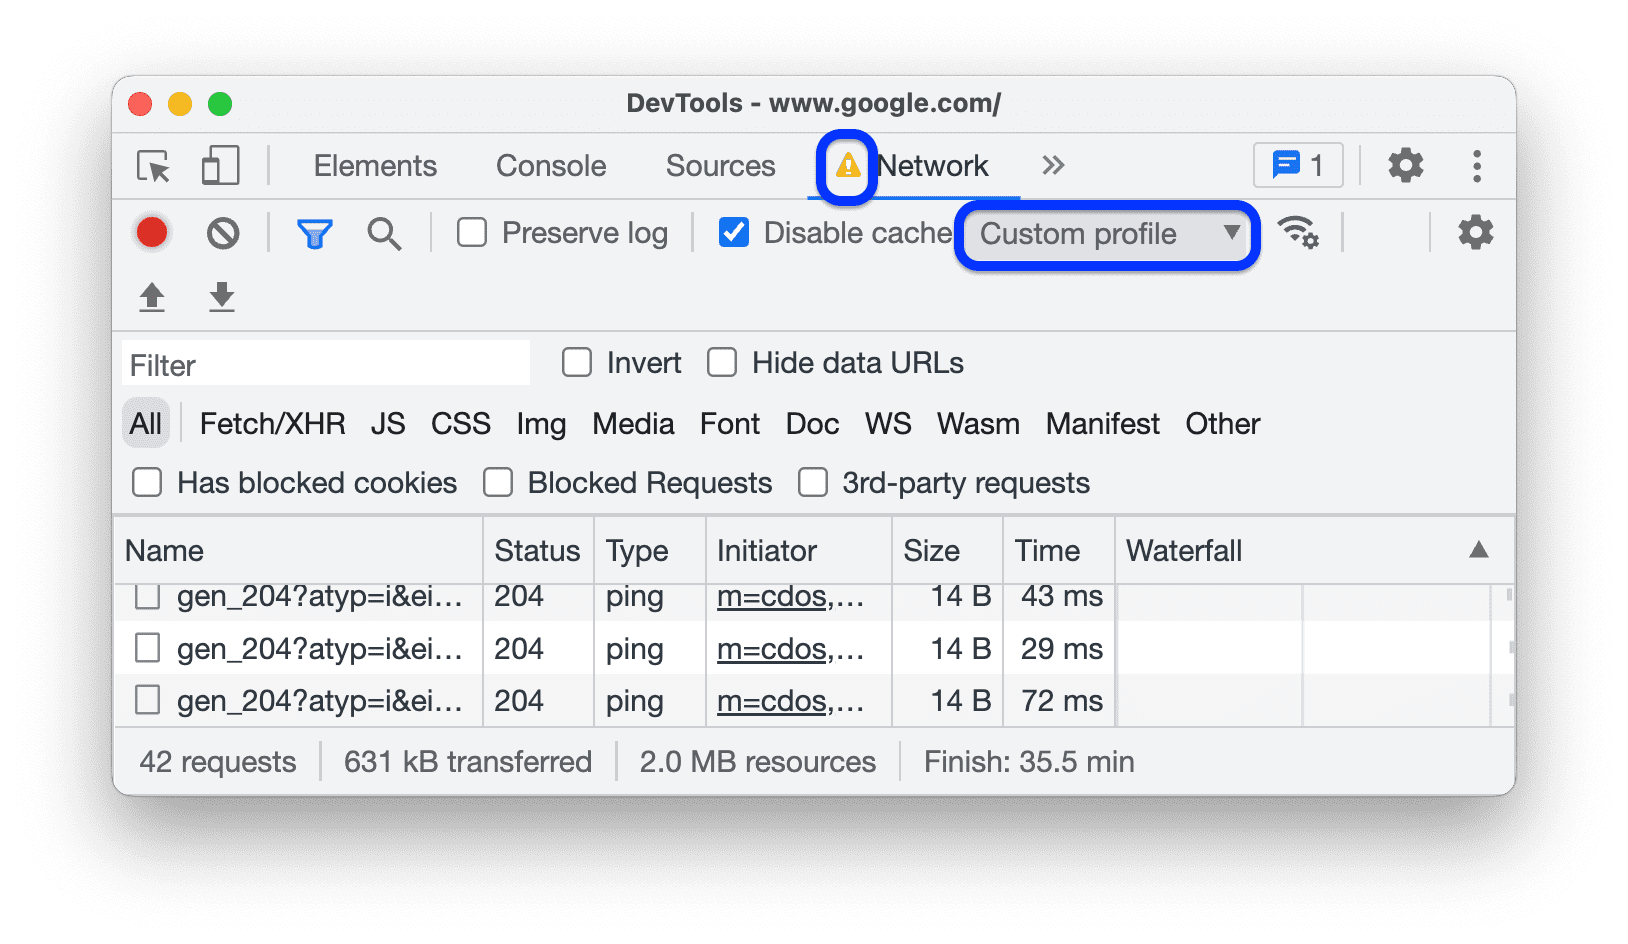
DevTools displays a![]() warning icon next to theNetworkpanel to remind you that throttling is enabled.
warning icon next to theNetworkpanel to remind you that throttling is enabled.
Throttle WebSocket connections
In addition to HTTP requests, DevTools throttles WebSocket connections since version 99.
To observe WebSocket throttling:
- Initiate a new connection, for example, by using atest tool.
- On theNetworkpanel, selectNo throttlingand send a message through the connection.
- Create a very slowcustom throttling profile,for example,
10 kbit/s.Such a slow profile will help you notice the difference. - On theNetworkpanel, select the profile and send another message.
- Toggle theWSfilter, click your connection name, open theMessagestab, and check the time difference between sent and echoed messages with and without throttling. For example:

Emulate slow network connections from the Network conditions drawer
If you want to throttle the network connection while working in other DevTools panels, use the Network conditionsdrawer.
- Click the
 icon to open theNetwork Conditionsdrawer.
 - Select a connection speed from theNetwork throttlingmenu.
Manually clear browser cookies
To manually clear browser cookies at any time, right-click anywhere in theRequeststable and select Clear browser cookies.

Override HTTP response headers
SeeOverride files and HTTP response headers locally.
Override the user agent
To manually override the user agent:
- Click the
 icon to open theNetwork Conditionsdrawer.
 - ClearSelect automatically.
- Choose a user agent option from the menu, or enter a custom one in the box.
Filter requests
Filter requests by properties
Use theFilterbox to filter requests by properties, such as the domain or size of the request.
If you can't see the box, the Filters pane is probably hidden. SeeHide the Filters pane.

To invert your filter, check theInvertcheckbox next to theFilterbox.
You can use multiple properties simultaneously by separating each property with a space. For
example,mime-type:image/gif larger-than:1Kdisplays all GIFs that are larger than one kilobyte.
These multi-property filters are equivalent to AND operations. OR operations aren't supported.
Next is a complete list of supported properties.
cookie-domain.Show the resources that set a specificcookie domain.cookie-name.Show the resources that set a specificcookie name.cookie-path.Show the resources that set a specificcookie path.cookie-value.Show the resources that set a specificcookie value.domain.Only display resources from the specified domain. You can use a wildcard character (*) to include multiple domains. For example,*displays resources from all domain names ending in.DevTools shows a populates the autocomplete drop-down menu with all of the domains it has encountered.has-overrides.Show requests that have overriddencontent,headers,any overrides (yes), or no overrides (no). You can add the correspondingHas overridescolumnto the request table.has-response-header.Show the resources that contain the specified HTTP response header. DevTools populates the autocomplete drop-down with all of the response headers that it has encountered.is.Useis:runningto findWebSocketresources.larger-than.Show resources that are larger than the specified size, in bytes. Setting a value of1000is equivalent to setting a value of1k.method.Show resources that were retrieved over a specified HTTP method type. DevTools populates the autocomplete drop-down with all of the HTTP methods it has encountered.mime-type.Show resources of a specified MIME type. DevTools populates the autocomplete drop-down with all MIME types it has encountered.mixed-content.Show all mixed content resources (mixed-content:all) or just the ones that are displayed (mixed-content:displayed).priority.Show resources whose priority level matches the specified value.resource-type.Show resources of a resource type, for example, image. DevTools populates the autocomplete drop-down with all resource types it has encountered.response-header-set-cookie.Show raw Set-Cookie headers in the Issues tab. Malformed cookies with incorrectSet-Cookieheaders will be flagged in the Network panel.scheme.Show resources retrieved over unprotected HTTP (scheme:http) or protected HTTPS (scheme:https).set-cookie-domain.Show the resources that have aSet-Cookieheader with aDomainattribute that matches the specified value. DevTools populates the autocomplete with all of the cookie domains that it has encountered.set-cookie-name.Show the resources that have aSet-Cookieheader with a name that matches the specified value. DevTools populates the autocomplete with all of the cookie names that it has encountered.set-cookie-value.Show the resources that have aSet-Cookieheader with a value that matches the specified value. DevTools populates the autocomplete with all of the cookie values that it has encountered.status-code.Only show resources whose HTTP status code match the specified code. DevTools populates the autocomplete drop-down menu with all of the status codes it has encountered.url.Show the resources that have aurlmatching the specified value.
Filter requests by type
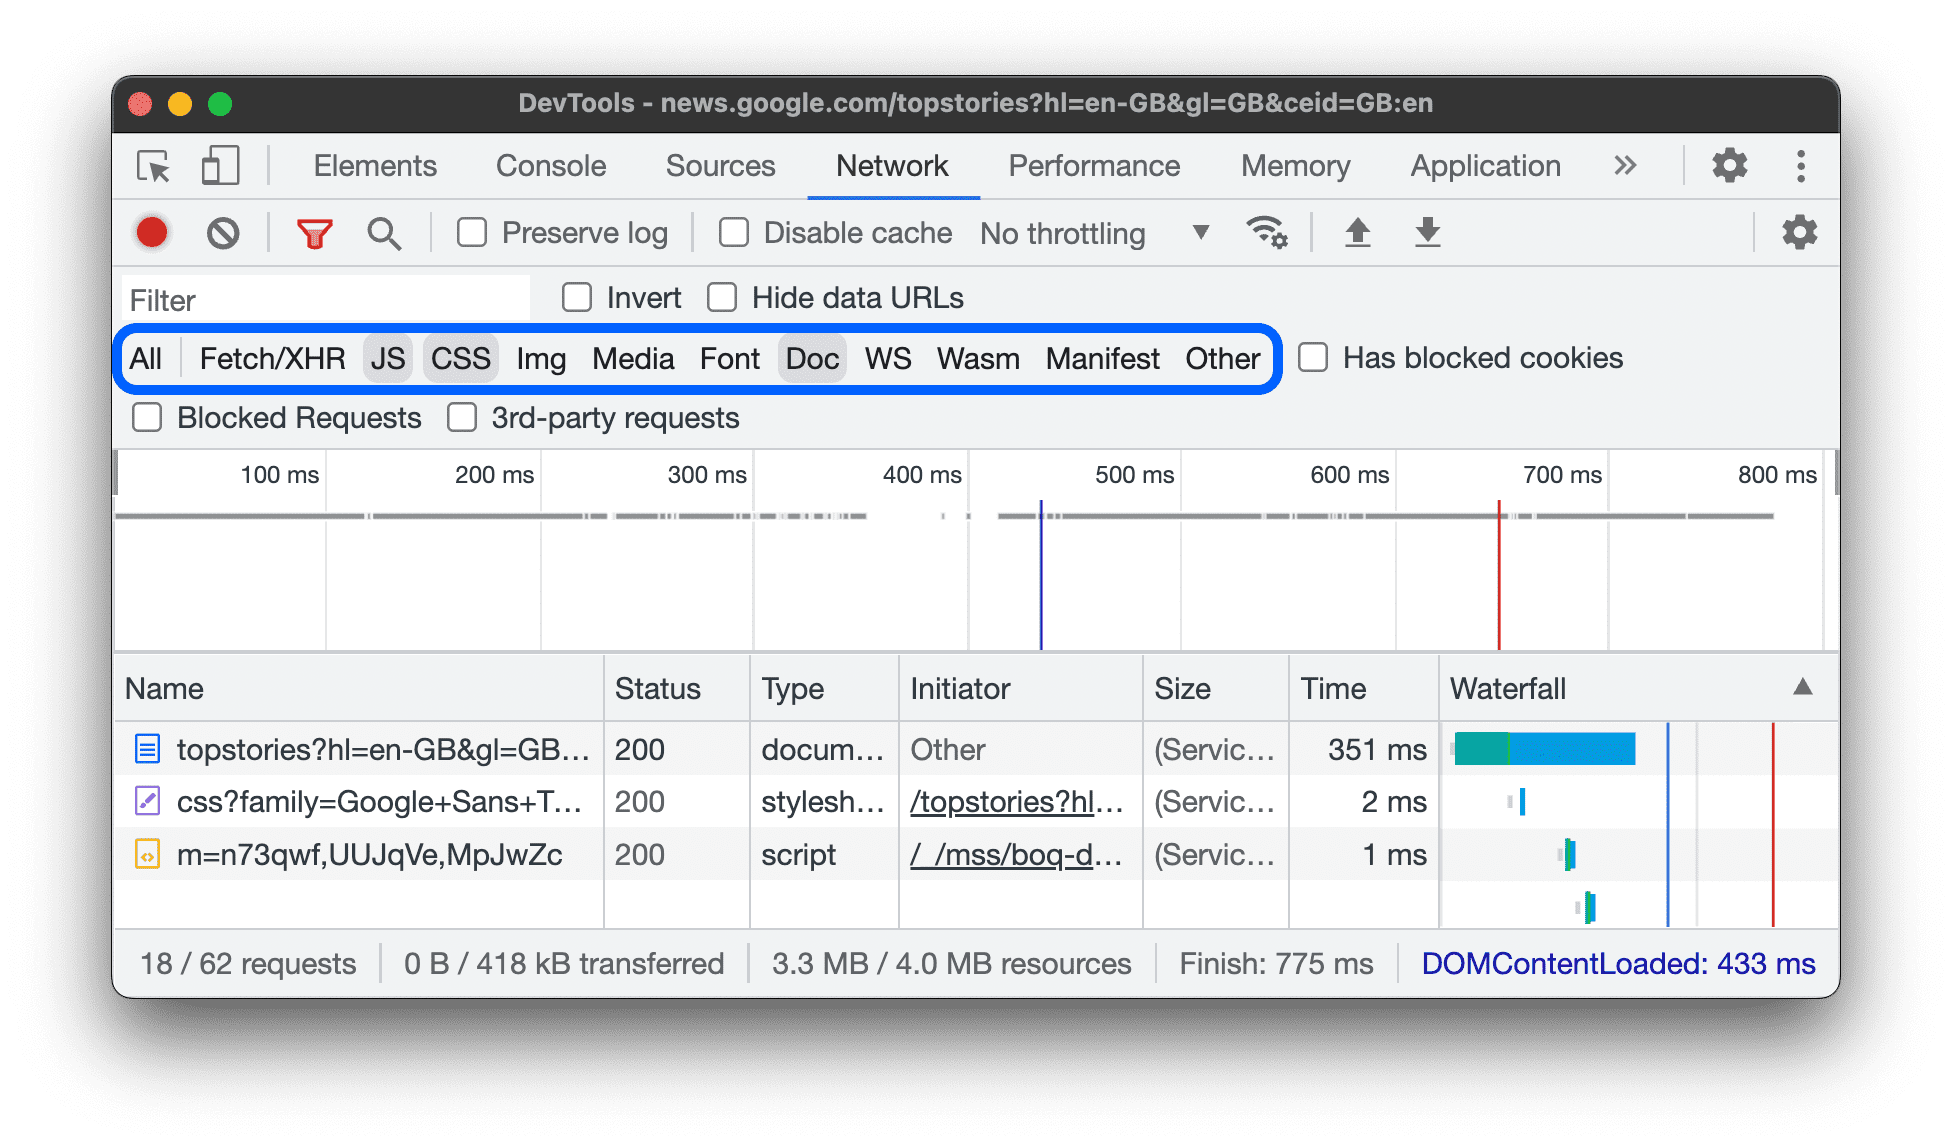
To filter requests by request type, click theAll,Fetch/XHR,JS,CSS,Img,Media, Font,Doc,WS(WebSocket),Wasm(WebAssembly),Manifest,orOther(any other type not listed here) buttons on theNetworkpanel.
If you can't see these buttons, the Filters pane is probably hidden. SeeHide the Filters pane.
To enable multiple type filters simultaneously, holdCommand(Mac) orControl(Windows, Linux) and then click.
Filter requests by time
Drag left or right on theOverviewpane to display only the requests that were active during that timeframe. The filter is inclusive. Any request that was active during the highlighted time is shown.

Hide data URLs
Data URLsare small files embedded into other documents. Any request that you see in the
Requeststable that starts withdata:is a data URL.
To hide these requests, check![]() Hide data URLs.
Hide data URLs.
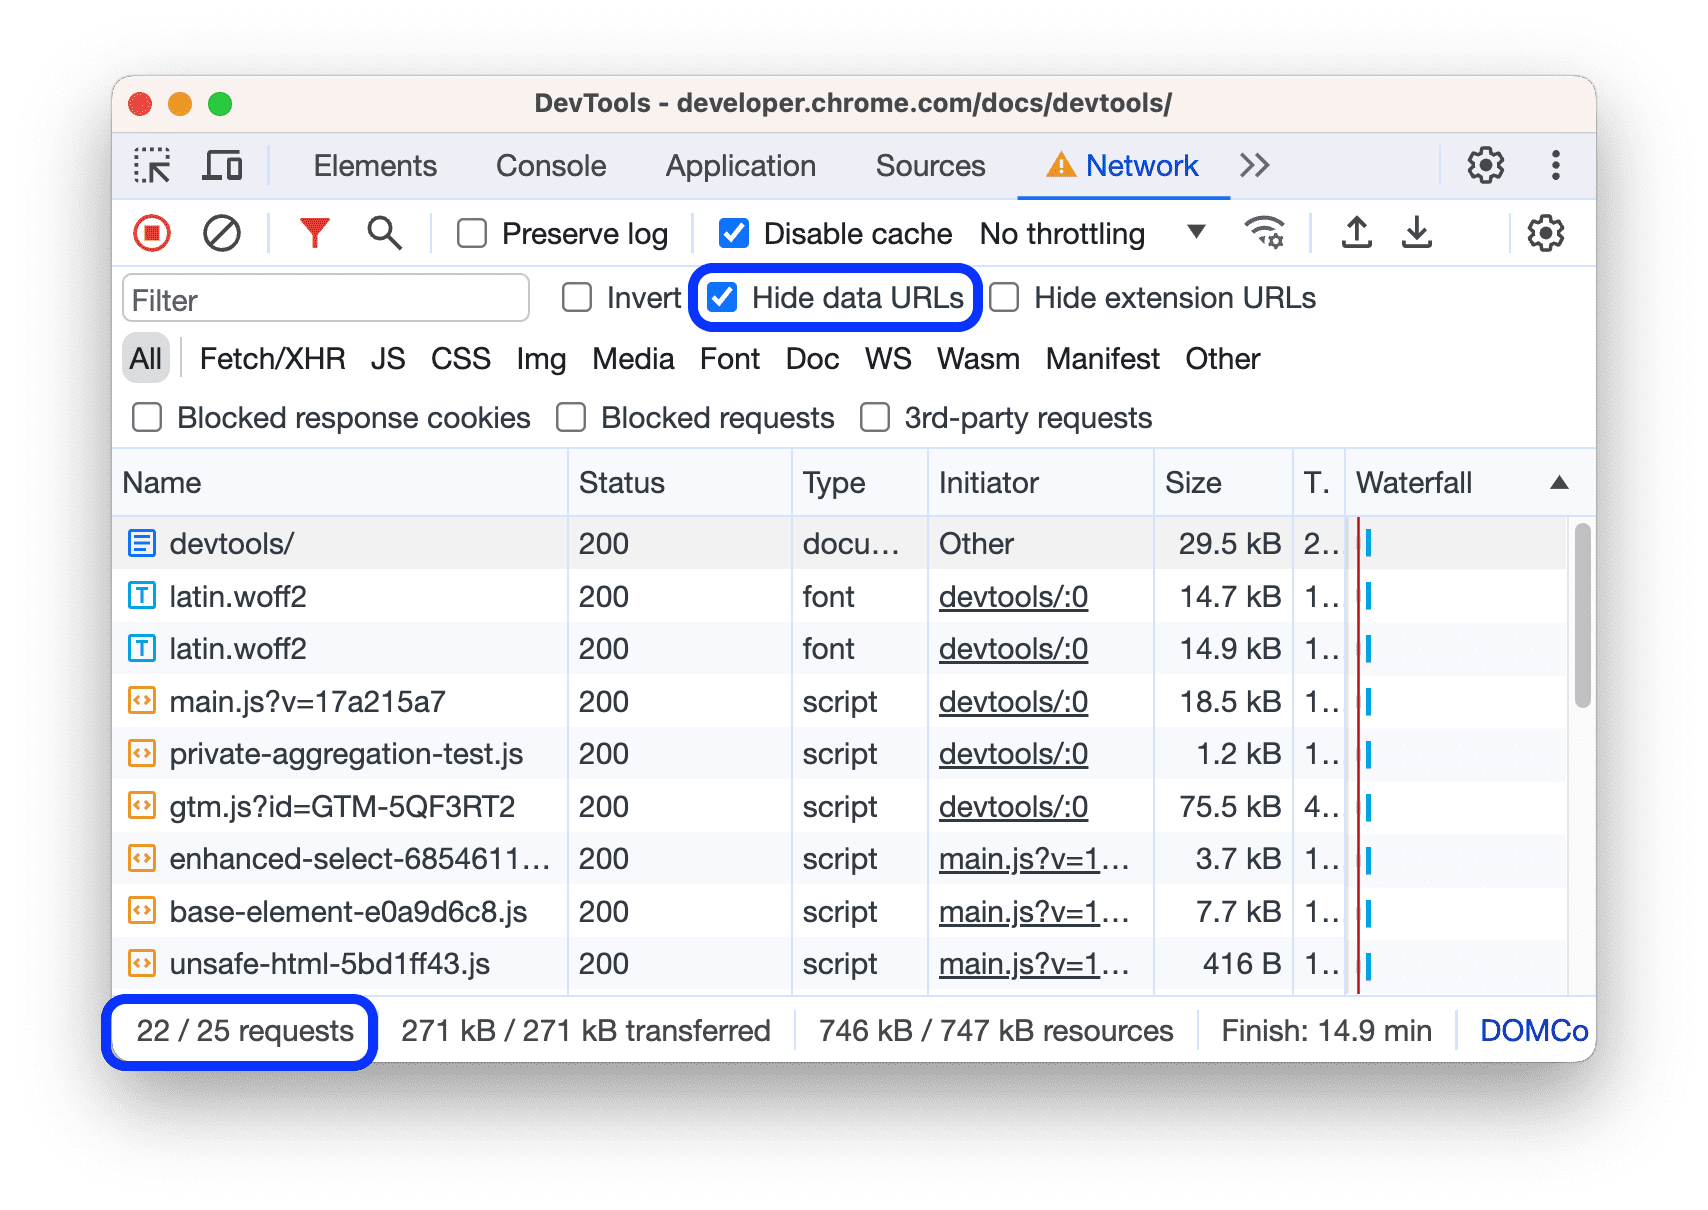
The status bar at the bottom displays the number of the shown requests out of the total.
Hide extension URLs
To focus on the code you author, you can filter out irrelevant requests sent by extensions you may have installed in Chrome. Extension requests have URLs that start withchrome-extension://.
To hide extension requests, check![]() Hide extension URLs.
Hide extension URLs.
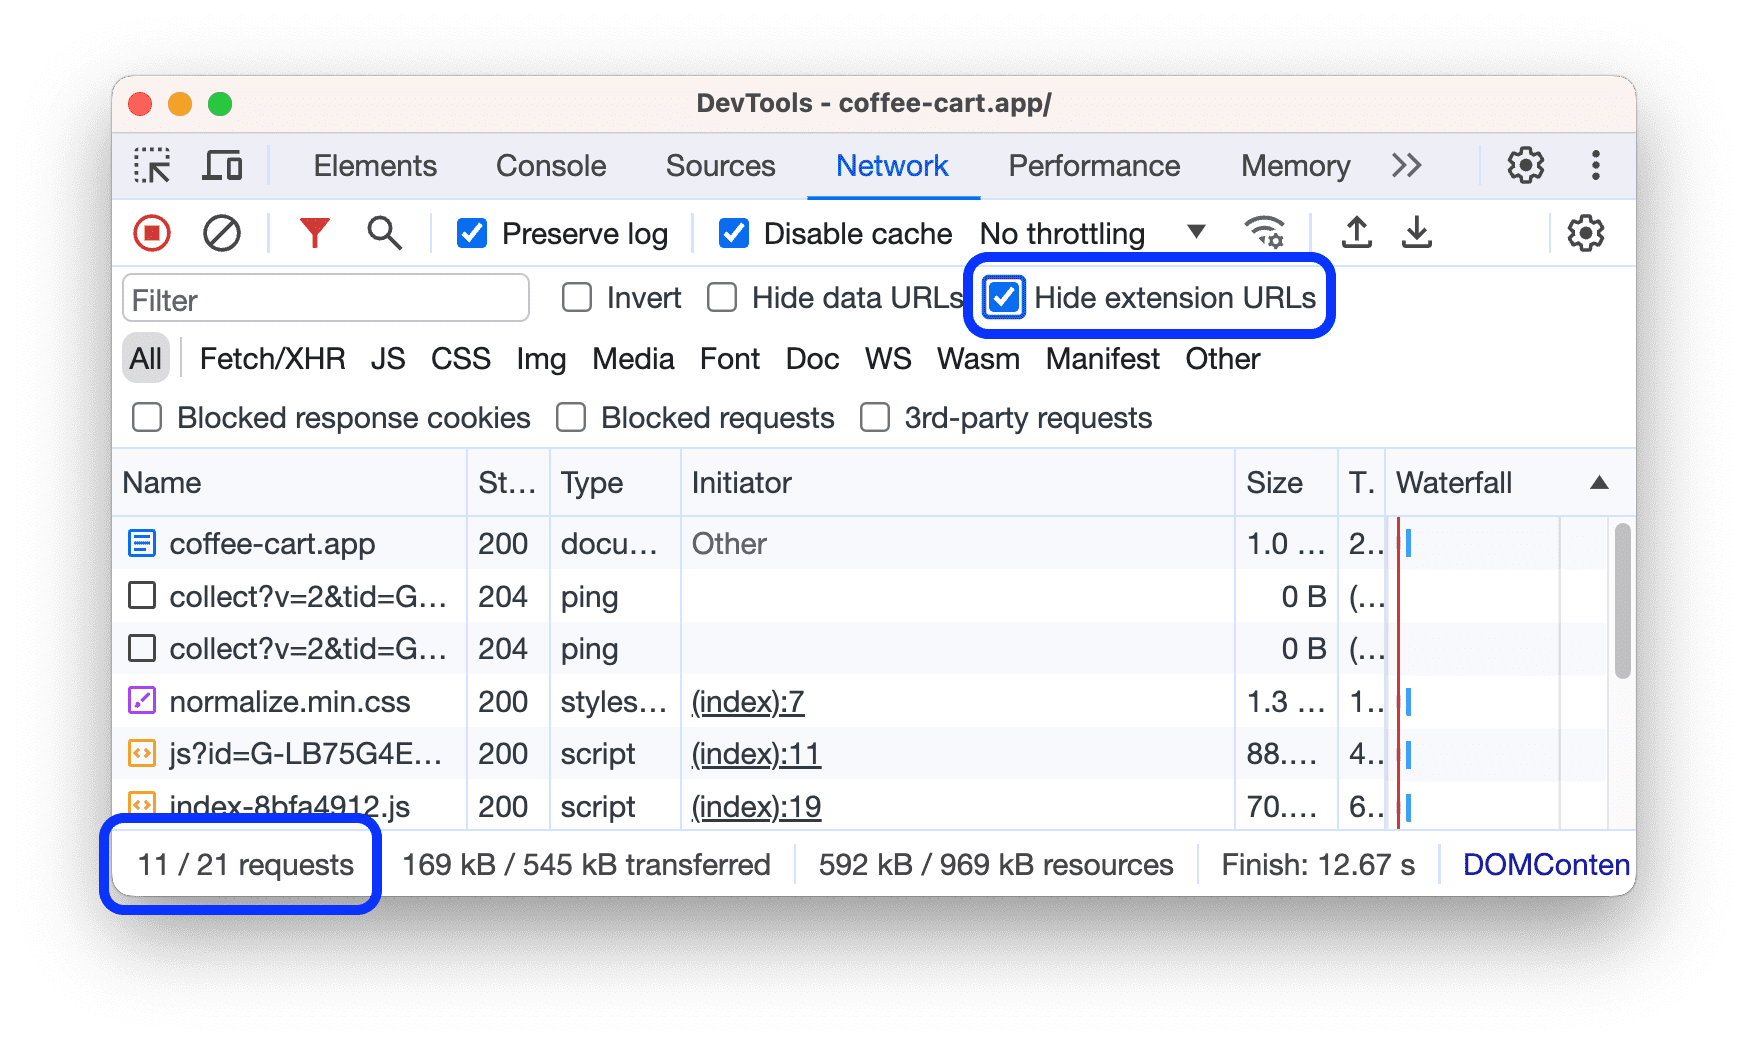
The status bar at the bottom displays the number of the shown requests out of the total.
Show only the requests with blocked response cookies
To filter out everything except the requests with response cookies blocked for any reason, check![]() Blocked response cookies.Try it on thisdemo page.
Blocked response cookies.Try it on thisdemo page.
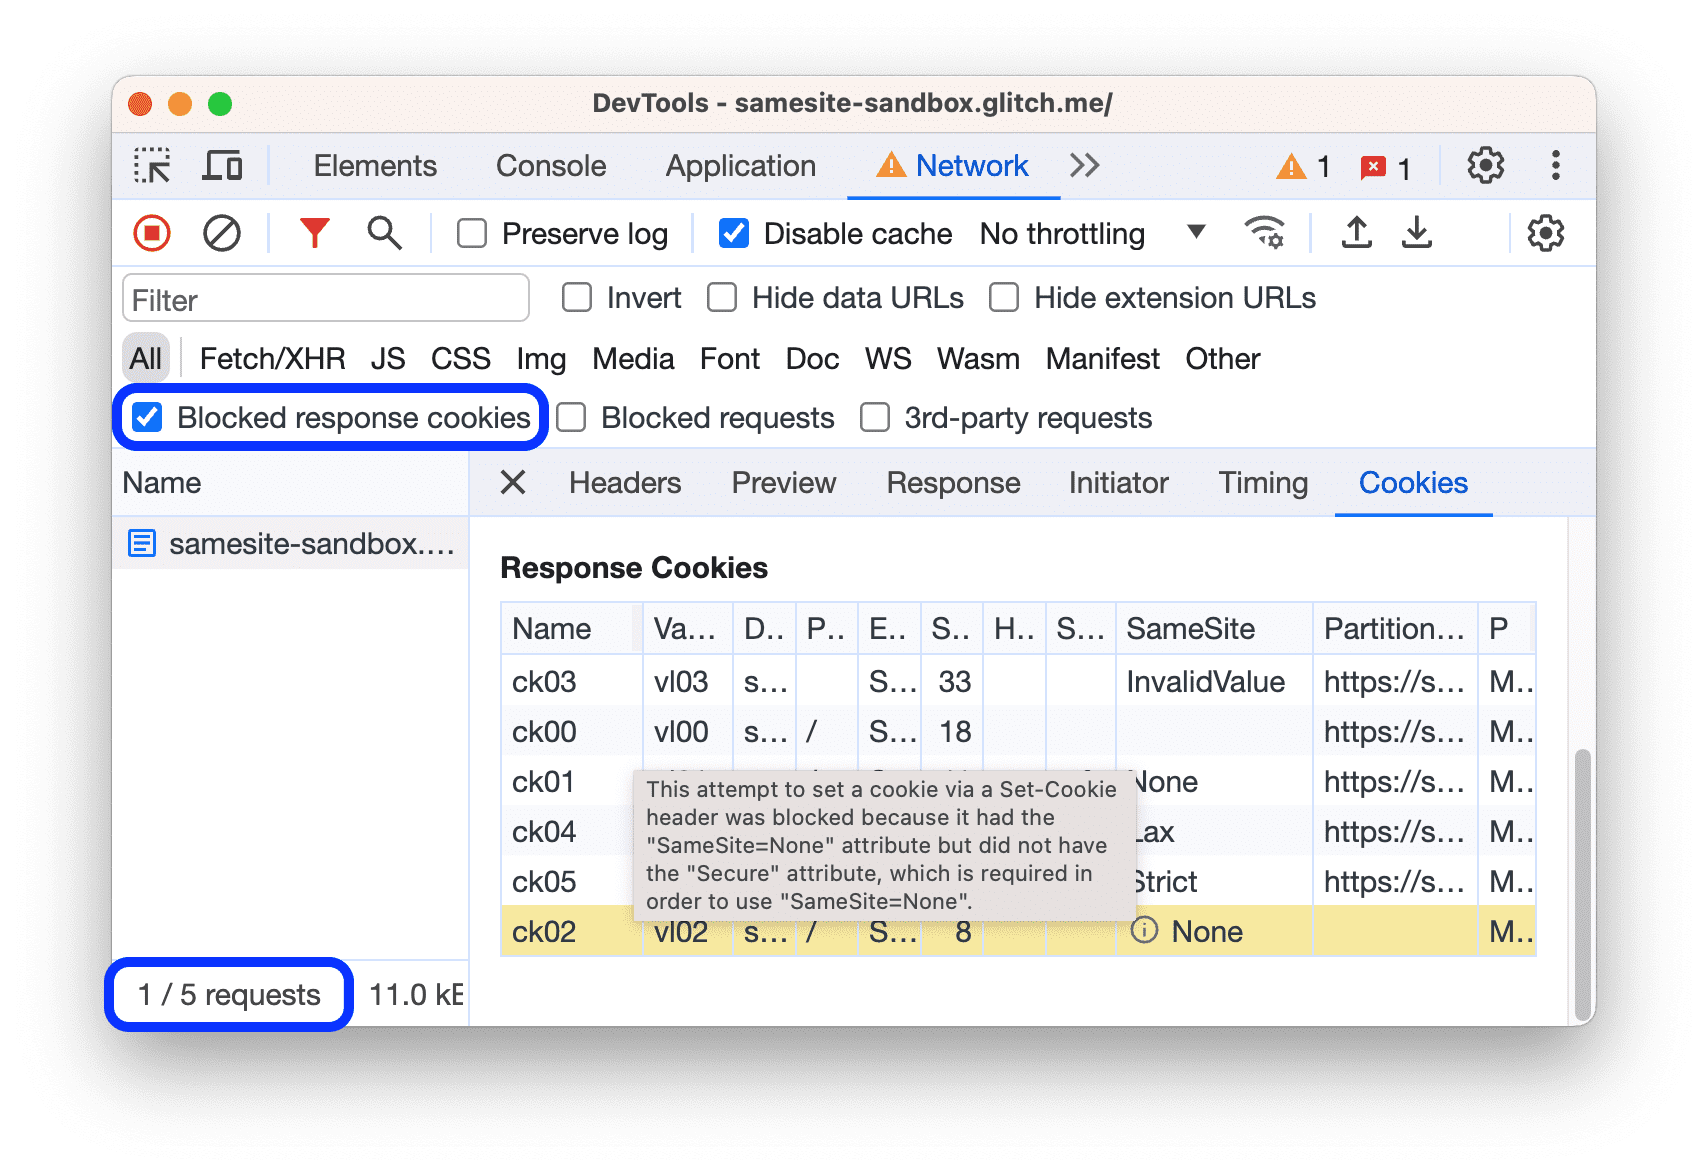
The status bar at the bottom displays the number of the shown requests out of the total.
To find out the reason why a response cookie was blocked, select the request, open itsCookiestab, and hover over the![]() information icon.
information icon.
Additionally, theNetworkpanel shows awarningwarning icon next to a request affected by thethird-party cookie phaseoutor exempted from it. Hover over the icon to see a tooltip with a clue and click it to go to theIssuespanel for more information.

Show only blocked requests
To filter out everything except blocked requests, check![]() Blocked requests.To test this, you can use theNetwork request blockingdrawer tab.
Blocked requests.To test this, you can use theNetwork request blockingdrawer tab.
TheRequeststable highlights blocked requests in red. The status bar at the bottom displays the number of the shown requests out of the total.
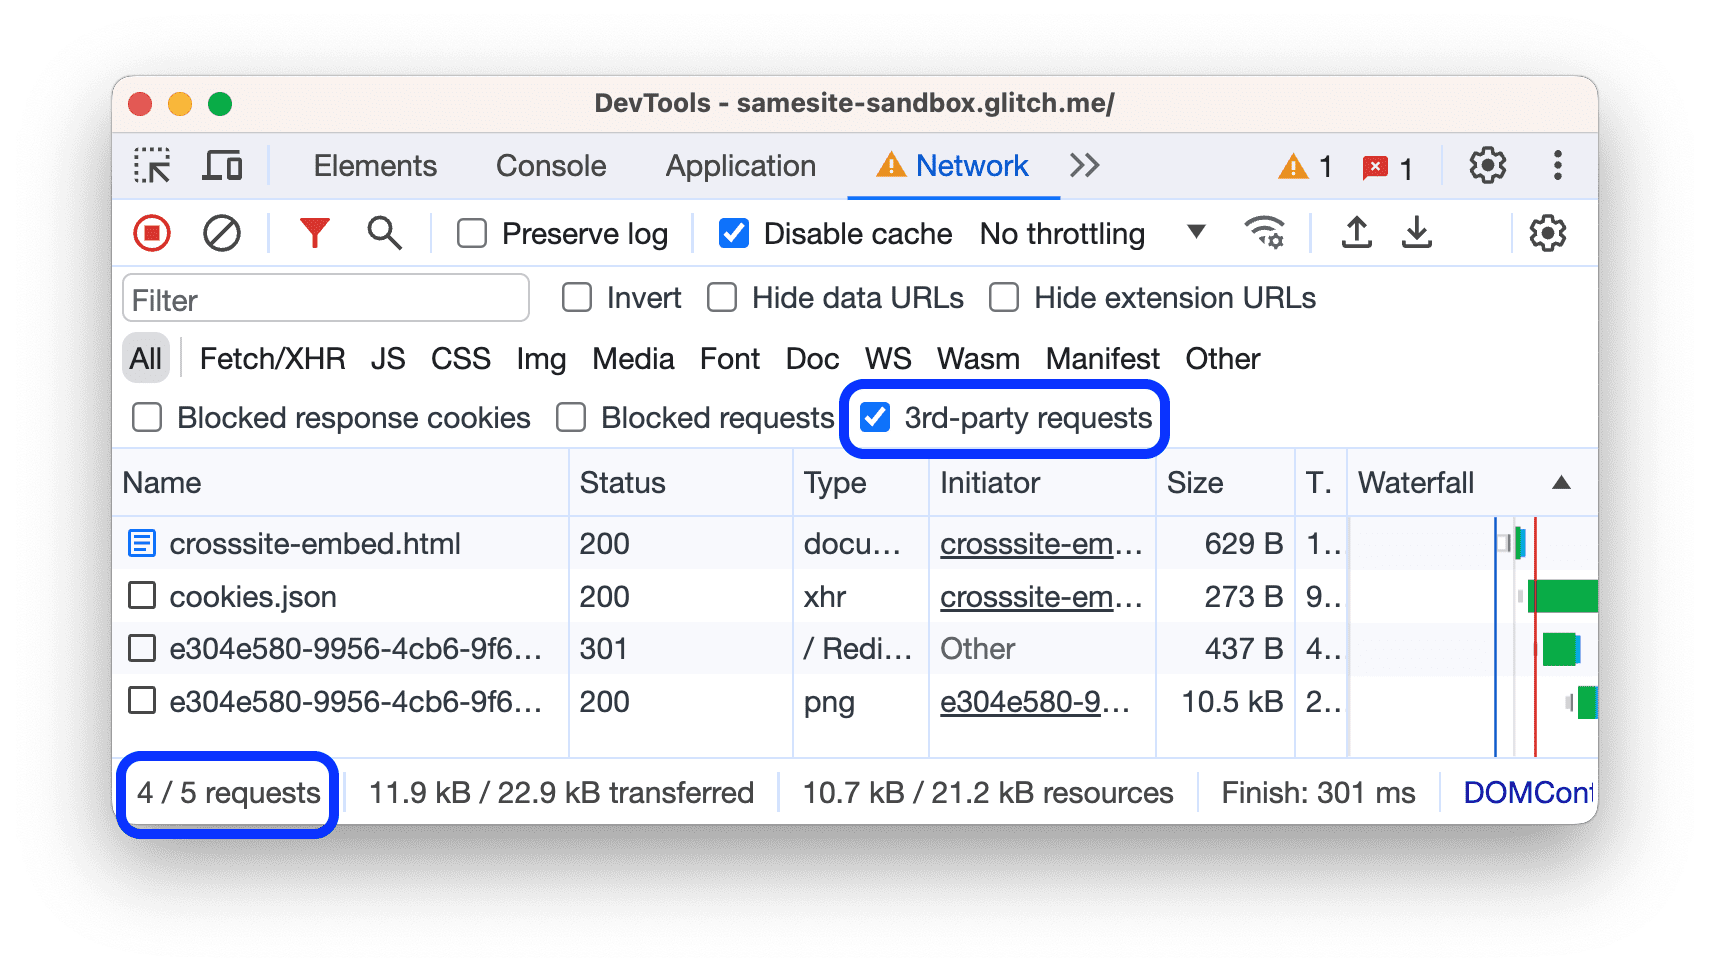
Show only third-party requests
To filter out everything except the requests with origin that differs from page origin, check![]() 3rd-party requests.Try it on thisdemo page.
3rd-party requests.Try it on thisdemo page.

The status bar at the bottom displays the number of the shown requests out of the total.
Sort requests
By default, the requests in theRequeststable are sorted by initiation time, but you can sort the table using other criteria.
Sort by column
Click the header of any column in theRequeststable to sort requests by that column.
Sort by activity phase
To change how theWaterfallsorts requests, right-click the header of the Requests table, hover over Waterfall,and select one of the following options:
- Start Time.The first request that was initiated is at the top.
- Response Time.The first request that started downloading is at the top.
- End Time.The first request that finished is at the top.
- Total Duration.The request with the shortest connection setup and request / response is at the top.
- Latency.The request that waited the shortest time for a response is at the top.
These descriptions assume that each respective option is ranked from shortest to longest. Clicking on theWaterfallcolumn's header reverses the order.
In this example, theWaterfallis sorted by total duration. The lighter portion of each bar is time spent waiting. The darker portion is time spent downloading bytes.

Analyze requests
So long as DevTools is open, it logs all requests in theNetworkpanel. Use theNetworkpanel to analyze requests.
View a log of requests
Use theRequeststable to view a log of all requests made while DevTools has been open. Clicking or hovering over requests reveals more information about them.

The Requests table displays the following columns by default:
- Name.The filename of, or an identifier for, the resource.
Status.This column can show the following values:

- HTTP status code, for example,
200or404. CORS errorfor requests failed due to Cross-Origin Resource Sharing (CORS).(blocked:origin)for requests with misconfigured headers. Hover over this status value to see a tooltip with a hint on what went wrong.(failed)followed by the error message.
- HTTP status code, for example,
Type.The MIME type of the requested resource.
Initiator.The following objects or processes can initiate requests:
- Parser.Chrome's HTML parser.
- Redirect.An HTTP redirect.
- Script.A JavaScript function.
- Other.Some other process or action, such as navigating to a page using a link or entering a URL in the address bar.
Size.The combined size of the response headers plus the response body, as delivered by the server.
Time.The total duration, from the start of the request to the receipt of the final byte in the response.
Waterfall.A visual breakdown of each request's activity.
Add or remove columns
Right-click the header of theRequeststable and select an option to hide or show it. The displayed options have check marks next to them.

You can add or remove the following additional columns:Path,URL,Method,Protocol,Scheme,Domain,Remote address,Remote address space,Initiator address space,Cookies,Set cookies,Priority,Connection ID,Has overrides,andWaterfall.
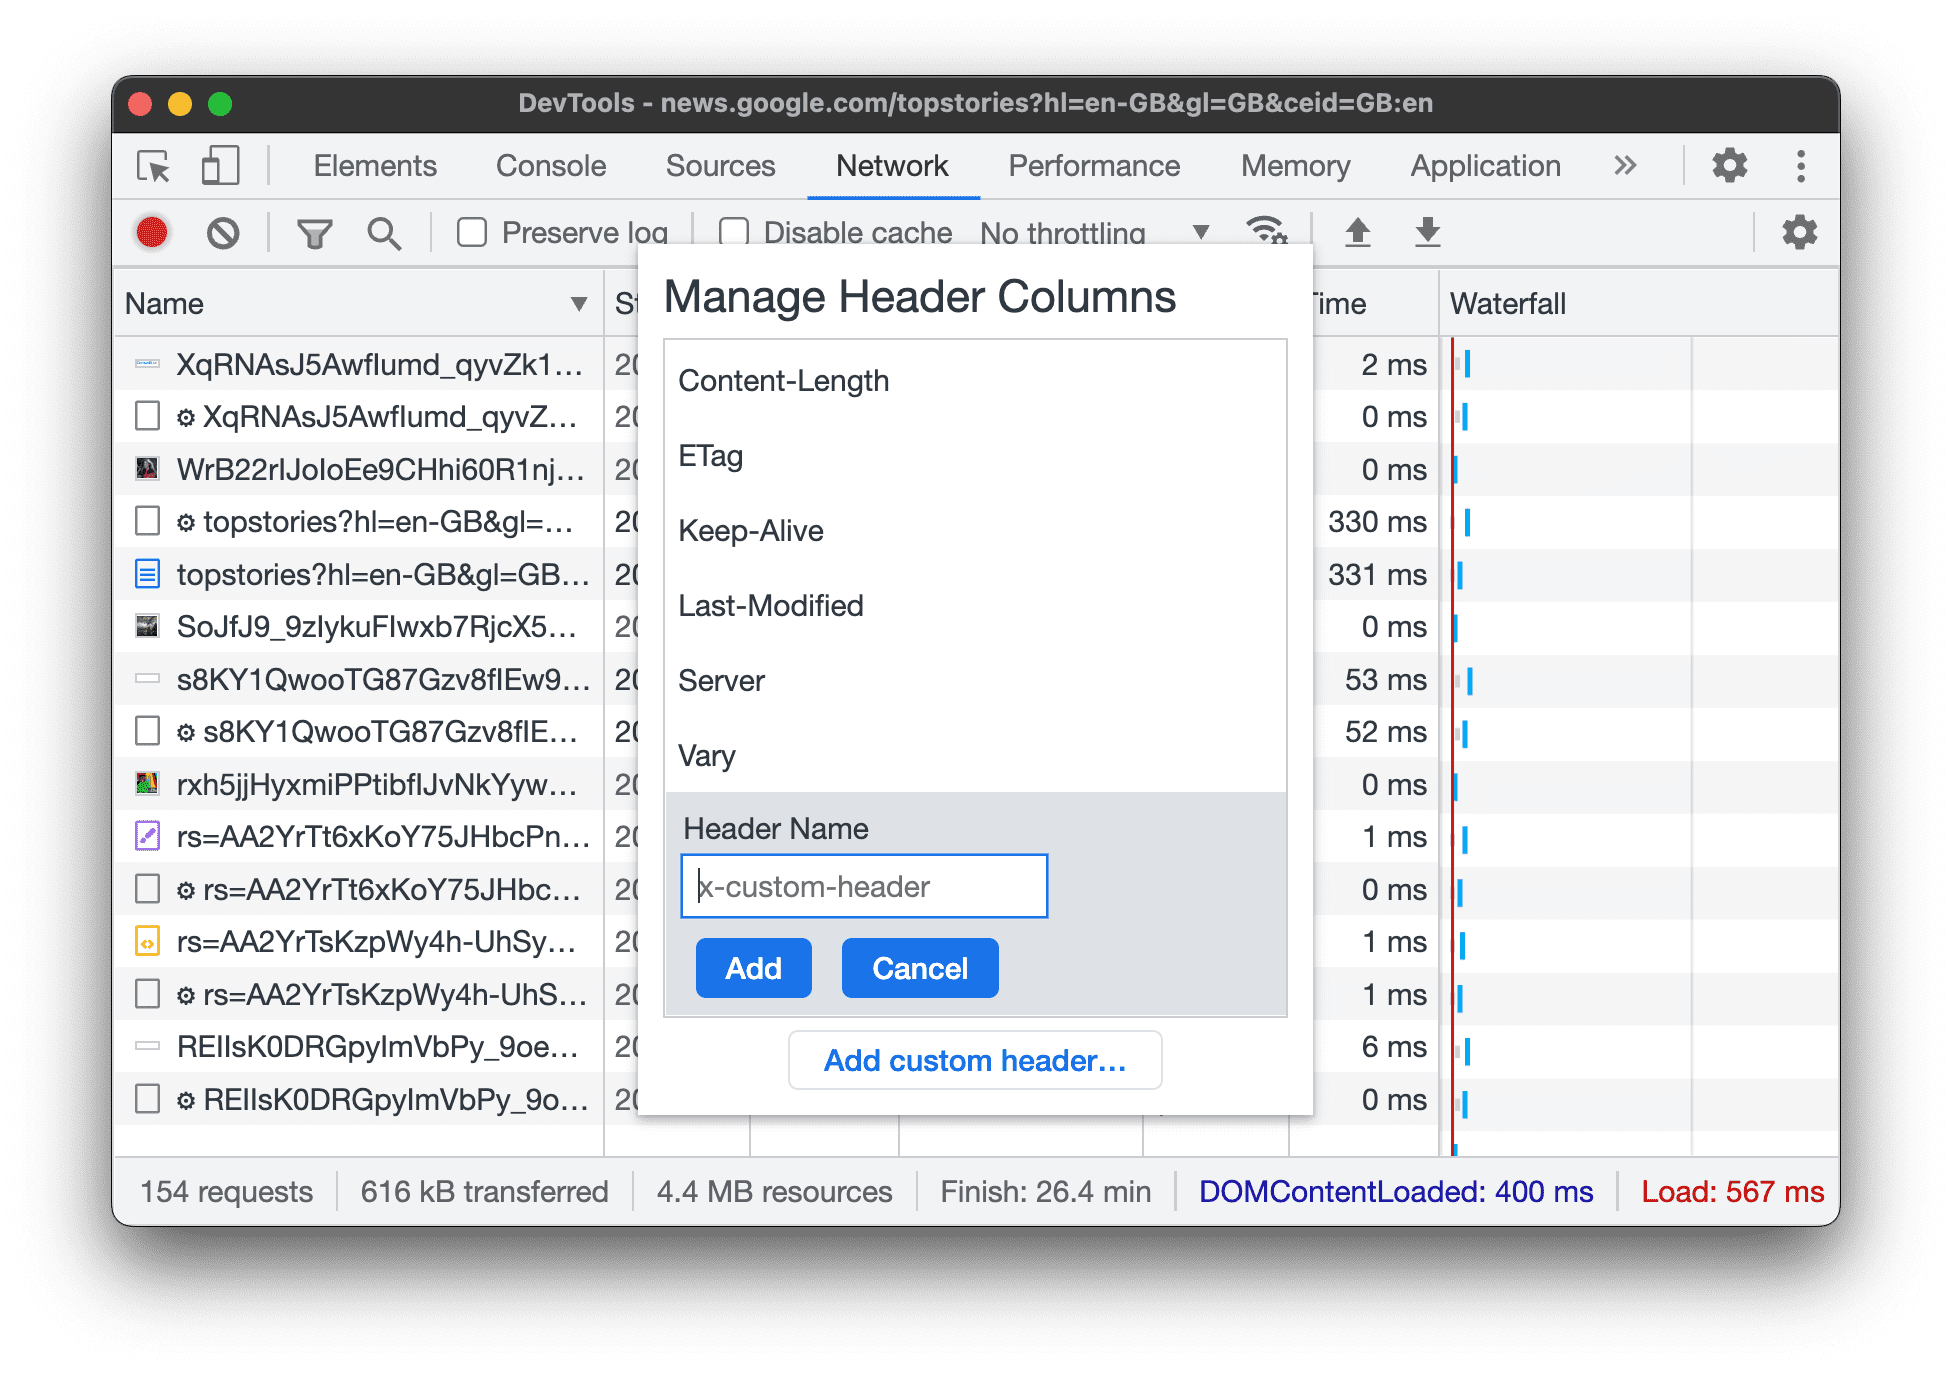
Add custom columns
To add a custom column to theRequeststable:
- Right-click the header of theRequeststable and selectResponse Headers>Manage Header Columns.
- In the dialog window, clickAdd custom header,enter its name, and clickAdd.
Group requests by inline frames
If inline frames on a page initiate a lot of requests, you can make the request log friendlier by grouping them.
To group requests by iframes, openSettings![]() inside theNetworkpanel and check
inside theNetworkpanel and check![]() Group by frame.
Group by frame.

To view a request initiated by an inline frame, expand it in the request log.
View the timing of requests in relation to one another
Use theWaterfallto view the timing of requests in relation to one another. By default, the Waterfallis organized by the start time of the requests. So, requests that are farther to the left started earlier than those that are farther to the right.
SeeSort by activity phaseto see the different ways that you can sort theWaterfall.

Analyze the messages of a WebSocket connection
To view the messages of a WebSocket connection:
- Under theNamecolumn of theRequeststable, click the URL of the WebSocket connection.
- Click theMessagestab. The table shows the last 100 messages.
To refresh the table, re-click the name of the WebSocket connection under theNamecolumn of the Requeststable.

The table contains three columns:
- Data.The message payload. If the message is plain text, it's displayed here. For binary opcodes, this column displays the opcode's name and code. The following opcodes are supported: Continuation Frame, Binary Frame, Connection Close Frame, Ping Frame, and Pong Frame.
- Length.The length of the message payload, in bytes.
- Time.The time when the message was received or sent.
Messages are color-coded according to their type:
- Outgoing text messages are light-green.
- Incoming text messages are white.
- WebSocket opcodes are light-yellow.
- Errors are light-red.
Analyze events in a stream
To view the events that servers stream throughFetch API,EventSource API,and XHR:
- Record network requestson a page that streams events. For example, open thisdemo pageand click any of the three buttons.
- InNetwork,select a request and open theEventStreamtab.

To filter events, specify a regular expression in the filter bar at the top of theEventStreamtab.
To clear the list of captured events, clickblockClear.
View a preview of a response body
To view a preview of a response body:
- Click the URL of the request, under theNamecolumn of theRequeststable.
- Click thePreviewtab.
This tab is mostly useful for viewing images.

View a response body
To view the response body to a request:
- Click the URL of the request, under theNamecolumn of the Requests table.
- Click theResponsetab.

View HTTP headers
To view HTTP header data of a request:
- Click a request in theRequeststable.
- Open theHeaderstab and scroll down toGeneral,Response Headers,Request Headers,and, optionally,Early Hints Headerssections.

In theGeneralsection, DevTools shows you human-readable status message next to the received HTTP status code.
In theResponse Headerssection, you can hover over a header value and click theeditEditbutton tooverride the response header locally.
View HTTP header source
By default, theHeaderstab shows header names Alpha betically. To view the HTTP header names in the order they were received:
- Open theHeaderstab for the request you're interested in. SeeView HTTP headers.
- Clickview source,next to theRequest HeaderorResponse Headersection.
Provisional headers warning
Sometimes theHeaderstab shows theProvisional headers are shown...warning message. This may be due to the following reasons:
The request wasn't sent over the network but was served from a local cache, which doesn't store the original request headers. In this case, you candisable cachingto see the full request headers.

The network resource isn't valid. For example, execute
fetch( "https://jec.fish /unknown-url/" )in theConsole.
DevTools can also display only provisional headers due to security reasons.
View request payload
To view the request's payload, that is, its query string parameters and form data, select a request from theRequeststable and open thePayloadtab.

View payload source
By default, DevTools shows the payload in a human-readable form.
To view the sources of query string parameters and form data, on thePayloadtab, clickview sourcenext to theQuery String ParametersorForm Datasections.

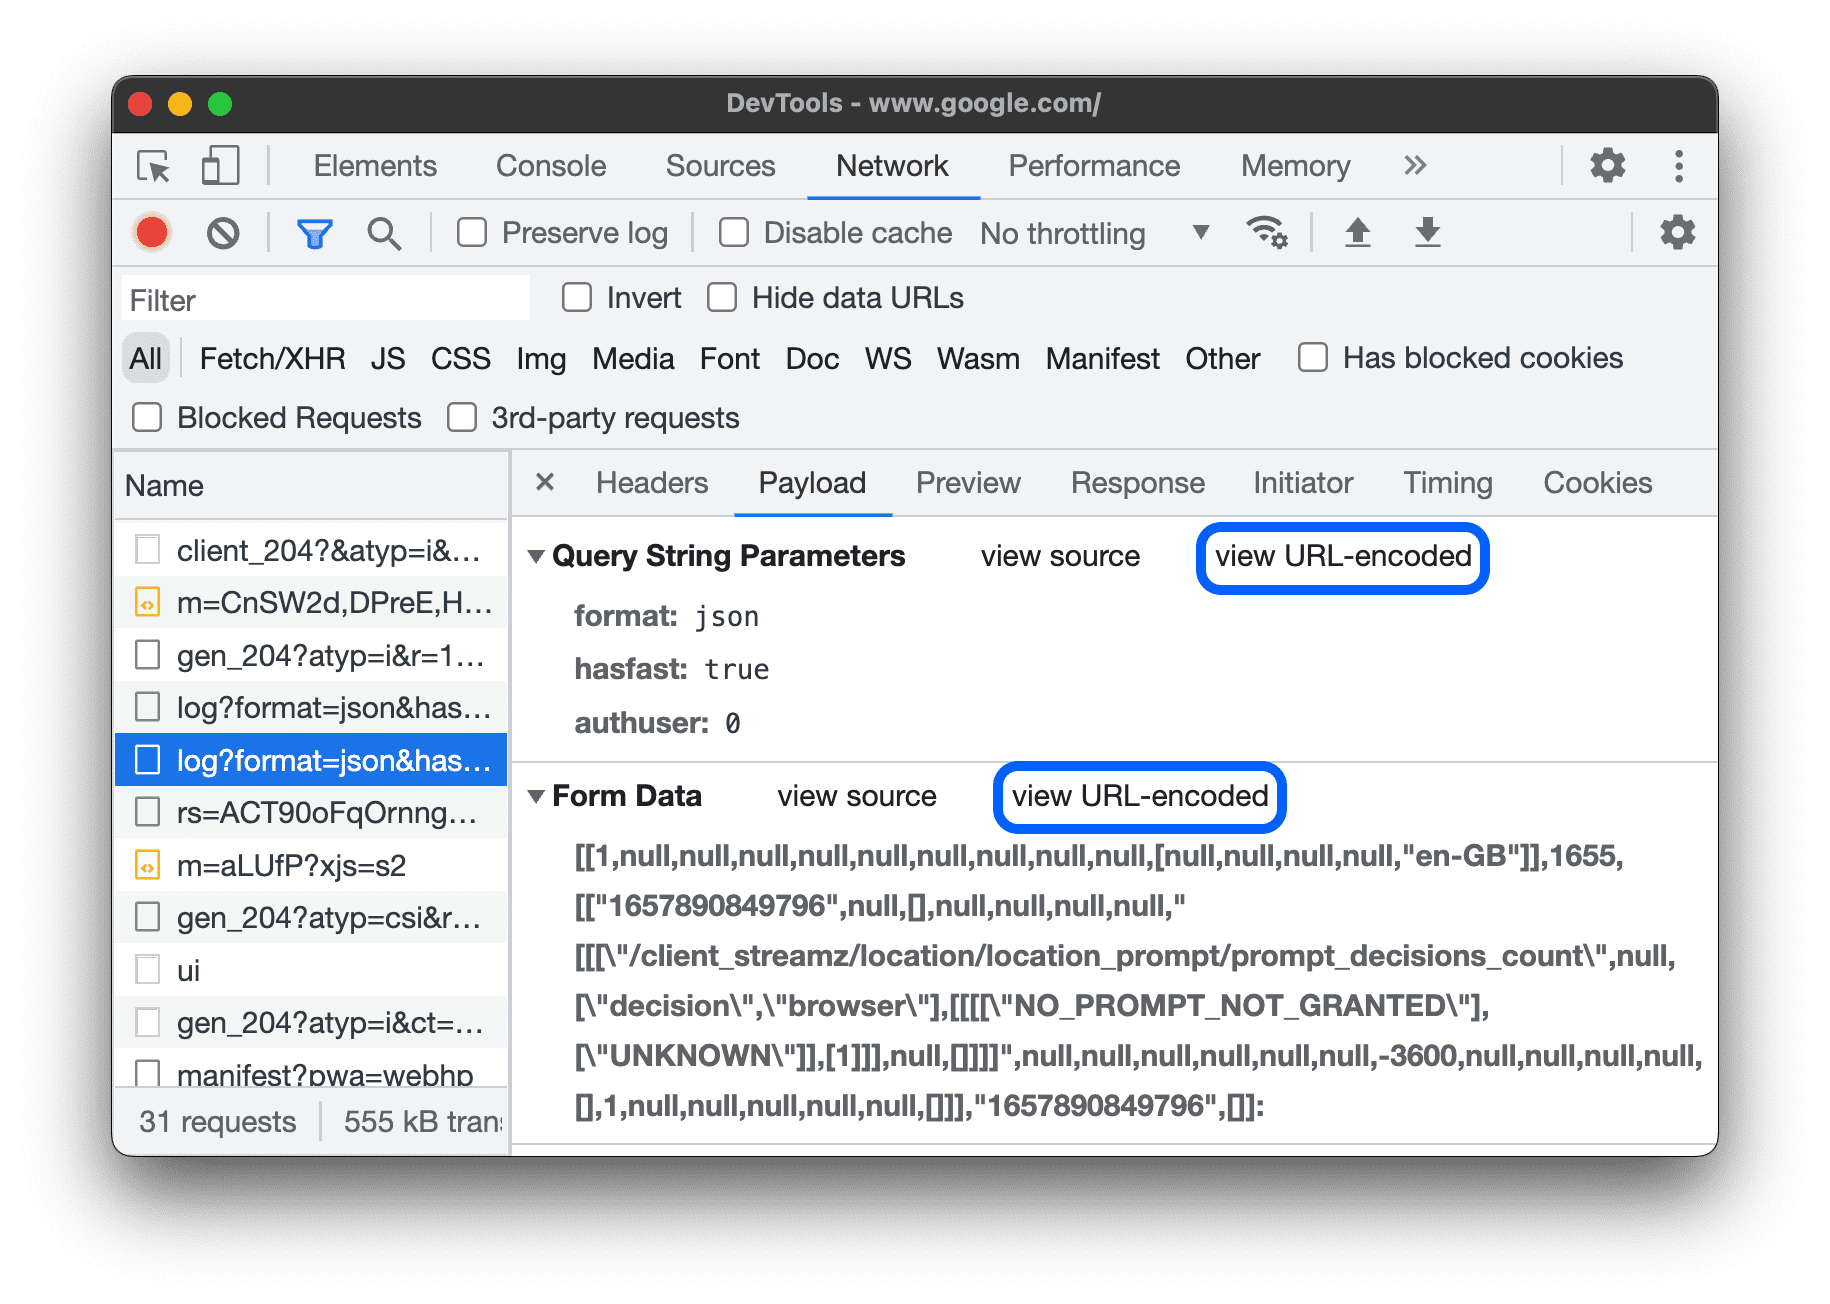
View URL-decoded arguments of query string parameters
To toggle URL-encoding for arguments, on thePayloadtab, clickview decodedorview URL-encoded.
View cookies
To view the cookies sent in a request's HTTP header:
- Click the URL of the request, under theNamecolumn of the Requests table.
- Click theCookiestab.

For a description of each of the columns, seeFields.
To modify cookies, seeView, edit, and delete cookies.
View the timing breakdown of a request
To view the timing breakdown of a request:
- Click the URL of the request, under theNamecolumn of theRequeststable.
- Click theTimingtab.
SeePreview a timing breakdownfor a faster way to access this data.

SeeTiming breakdown phases explainedfor more information about each of the phases that you may see in theTimingtab.
Preview a timing breakdown
To view a preview of the timing breakdown of a request, hover over the request's entry in the Waterfallcolumn of the Requests table.
SeeView the timing breakdown of a requestfor a way to access this data that does not require hovering.

Timing breakdown phases explained
Here's more information about each of the phases you may see in theTimingtab:
- Queueing.The browser queues requests before connection start and when:
- There are higher priority requests.
- There are already six TCP connections open for this origin, which is the limit. Applies to HTTP/1.0 and HTTP/1.1 only.
- The browser is briefly allocating space in the disk cache.
- Stalled.The request could be stalled after connection start for any of the reasons described inQueueing.
- DNS Lookup.The browser is resolving the request's IP address.
- Initial connection.The browser is establishing a connection, including TCP handshakes or retries and negotiating an SSL.
- Proxy negotiation.The browser is negotiating the request with aproxy server.
- Request sent.The request is being sent.
- ServiceWorker Preparation.The browser is starting up the service worker.
- Request to ServiceWorker.The request is being sent to the service worker.
- Waiting (TTFB).The browser is waiting for the first byte of a response. TTFB stands for Time To First Byte. This timing includes 1 round trip of latency and the time the server took to prepare the response.
- Content Download.The browser is receiving the response, either directly from the network or from a service worker. This value is the total amount of time spent reading the response body. Larger than expected values could indicate a slow network, or that the browser is busy performing other work which delays the response from being read.
View initiators and dependencies
To view the initiators and dependencies of a request, holdShiftand hover over the request in the Requests table. DevTools colors initiators green, and dependencies red.

When theRequeststable is ordered chronologically, the first green request above the request that you're hovering over is the initiator of the dependency. If there's another green request above that, that higher request is the initiator of the initiator. And so on.
View load events
DevTools displays the timing of theDOMContentLoadedandloadevents in multiple places on the
Networkpanel. TheDOMContentLoadedevent is colored blue, and theloadevent is red.

View the total number of requests
The total number of requests is listed in theSummarypane, at the bottom of theNetworkpanel.

View the total size of transferred and loaded resources
DevTools lists the total size of transferred and loaded (uncompressed) resources in theSummarypane, at the bottom of theNetworkpanel.

SeeView the uncompressed size of a resourceto see how large resources are after the browser uncompresses them.
View the stack trace that caused a request
When a JavaScript statement causes a resource to be requested, hover over theInitiatorcolumn to view the stack trace leading up to the request.

View the uncompressed size of a resource
CheckSettings![]() >Big request rowsand then look at the bottom value of theSizecolumn.
>Big request rowsand then look at the bottom value of theSizecolumn.

In this example, the compressed size of thegoogledocument that was sent over the network was
43.8 KB,whereas the uncompressed size was136 KB.
Export requests data
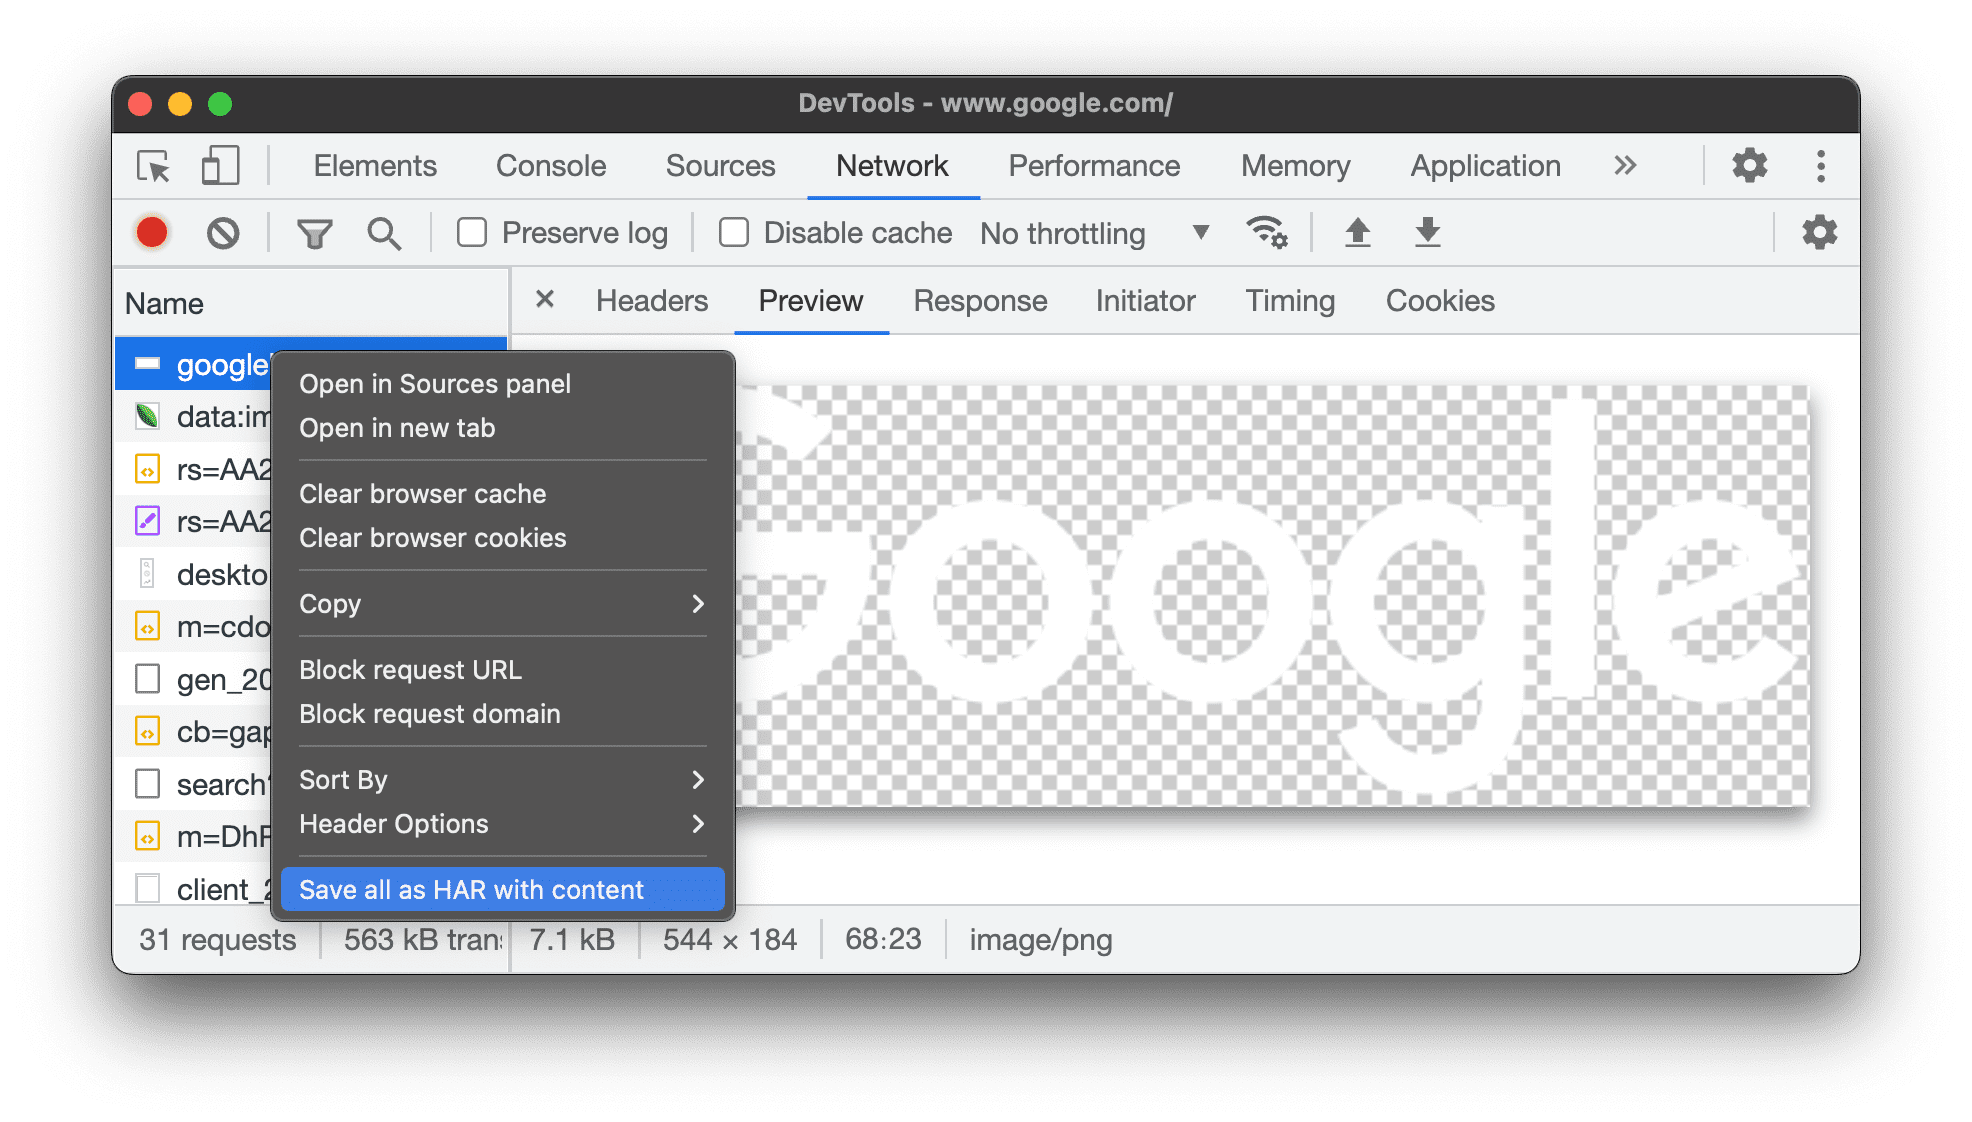
Save all network requests to a HAR file
HAR (HTTP Archive)is a file format used by several HTTP session tools to export the captured data. The format is a JSON object with a particular set of fields.
You can save all network requests to a HAR file in two ways:
- Right-click any request in theRequeststable and selectSave all as HAR with content.
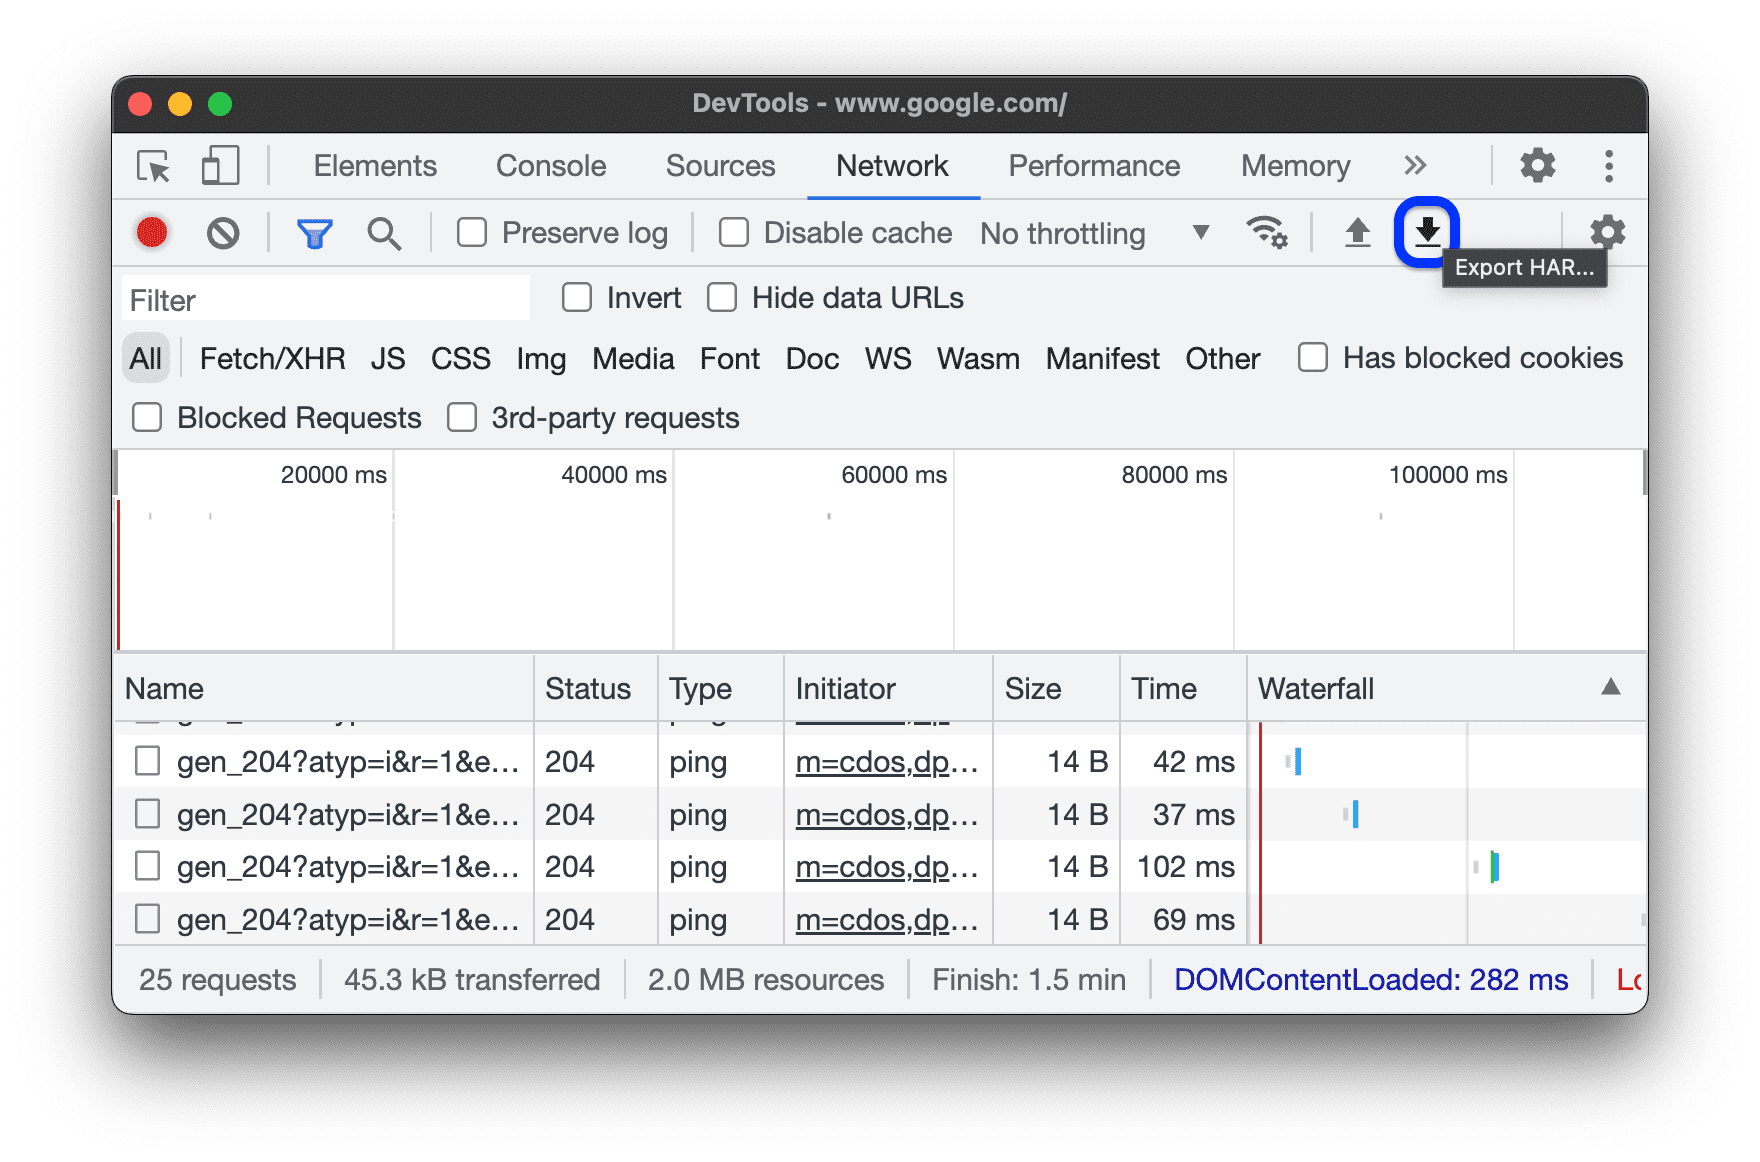
- Click
 Export HARin the action bar at the top of theNetworkpanel.
Once you have a HAR file, you can import it back into DevTools foranalysisin two ways:
- Drag-and-drop the HAR file into theRequeststable.
- Click
 Import HARin the action bar at the top of theNetworkpanel.
Copy one or more requests to the clipboard
Under theNamecolumn of theRequeststable, right-click a request, hover overCopy,and select one of the following options:
- Copy URL.Copy the request's URL to the clipboard.
- Copy as cURL.Copy the request as a cURL command.
- Copy as PowerShell.Copy the request as a PowerShell command.
- Copy as fetch.Copy the request as a fetch call.
Copy as Node.js fetch.Copy the request as a Node.js fetch call.
Copy response.Copy the response body to the clipboard.
Copy all URLs.Copy URLs of all requests to the clipboard.
Copy all as cURL.Copy all requests as a chain of cURL commands.
Copy all as PowerShell.Copy all requests as a chain of PowerShell commands.
Copy all as fetch.Copy all requests as a chain of fetch calls.
Copy all as Node.js fetch.Copy all requests as a chain of Node.js fetch calls.
Copy all as HAR.Copy all requests as HAR data.

Change the layout of the Network panel
Expand or collapse sections of theNetworkpanel UI to focus on what's important to you.
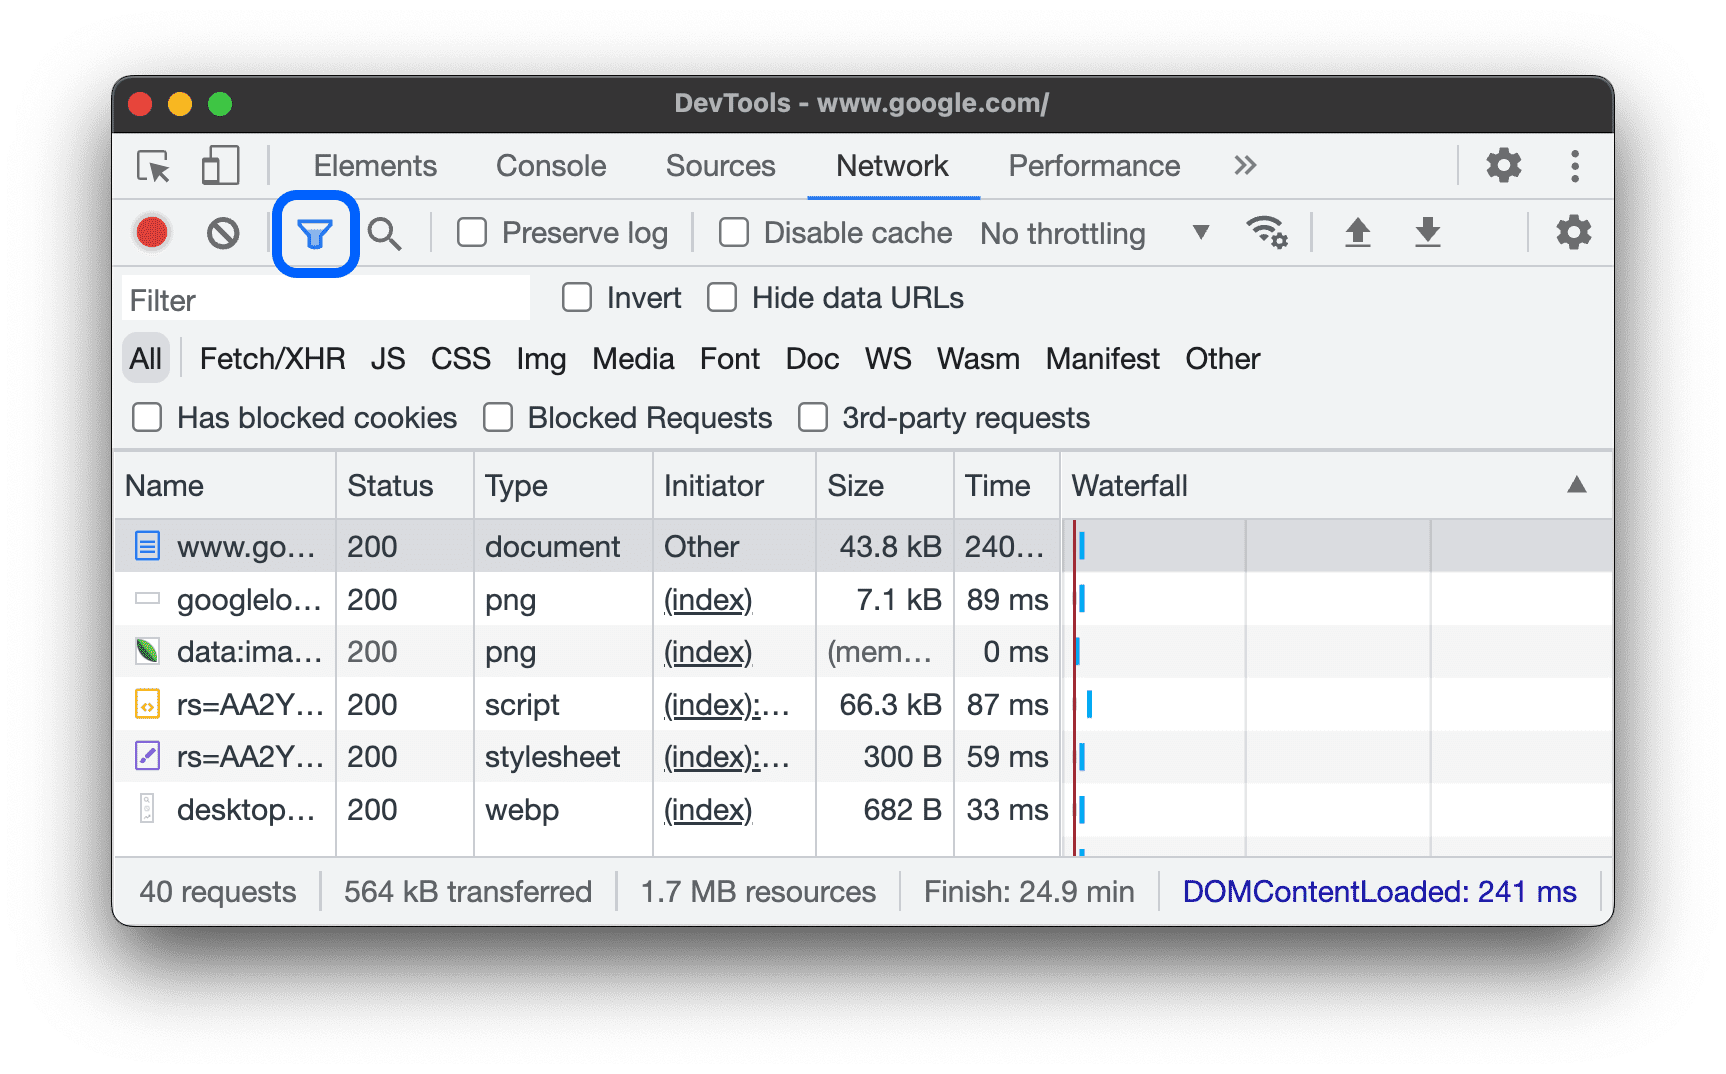
Hide the Filters pane
By default, DevTools shows theFilters pane.ClickFilter
![]() to hide it.
to hide it.
Use big request rows
Use big rows when you want more whitespace in your network requests table. Some columns also provide a little more information when using big rows. For example, the bottom value of the Sizecolumn is the uncompressed size of a request and thePrioritycolumn shows both the initial (bottom value) and final (top value) fetch priority.
OpenSettings![]() and clickBig request rowsto see big rows.
and clickBig request rowsto see big rows.

Hide the Overview track
By default, DevTools shows theOverviewtrack. OpenSettings![]() and clear theShow overviewcheckbox to hide it.
and clear theShow overviewcheckbox to hide it.
