
Abstract
Changes in past atmospheric carbon dioxide concentrations can be determined by measuring the composition of air trapped in ice cores from Antarctica. So far, the Antarctic Vostok and EPICA Dome C ice cores have provided a composite record of atmospheric carbon dioxide levels over the past 650,000 years1,2,3,4.Here we present results of the lowest 200 m of the Dome C ice core, extending the record of atmospheric carbon dioxide concentration by two complete glacial cycles to 800,000 yr before present. From previously published data1,2,3,4,5,6,7,8and the present work, we find that atmospheric carbon dioxide is strongly correlated with Antarctic temperature throughout eight glacial cycles but with significantly lower concentrations between 650,000 and 750,000 yr before present. Carbon dioxide levels are below 180 parts per million by volume (p.p.m.v.) for a period of 3,000 yr during Marine Isotope Stage 16, possibly reflecting more pronounced oceanic carbon storage. We report the lowest carbon dioxide concentration measured in an ice core, which extends the pre-industrial range of carbon dioxide concentrations during the late Quaternary by about 10 p.p.m.v. to 172–300 p.p.m.v.
Main
Two deep ice cores have been drilled within the European Project for Ice Coring in Antarctica (EPICA). The drillings at both sites, one located in the Dronning Maud Land (DML) area at Kohnen Station (75° 00′ 06″ S; 00° 04′ 04″ E), the other at Concordia Station (Dome C; 75° 06′ 04″ S; 123° 20′ 52″ E), have been stopped at or a few metres above bedrock at a depth of 2,774 m and 3,270 m, respectively. EPICA produced climate records focusing, among others, on water isotopes, particulate and soluble aerosol species as well as greenhouse gases4,8,9.For the latter, the analysis of the air entrapped in the ice is the only direct way to determine their concentrations for times before precise routine atmospheric measurements were done, that is, before 1958.
Carbon dioxide measurements on Dome C ice, focusing on the interval 390 to 650 kyr before present,bp(2,700–3,060 m)4,confirmed the strong coupling between CO2and Antarctic temperature found1in the Vostok ice core for the past 420 kyr. They also showed a range in CO2about 30% smaller (180 to 260 p.p.m.v.) than for the Vostok interval (180 to 300 p.p.m.v.) related to cooler interglacials in the earlier period10.
Investigating the lowest 200 m of the Dome C core (3,060–3,270 m), we extend the existing CO2records by two complete glacial cycles. The data set of the depth interval 3,060–3,190 m, to which two laboratories have contributed with three different air extraction techniques and two independent measurement methods, is shown inFig. 1.The resolution of the samples extracted by a needle cracker and analysed by laser absorption spectroscopy (LAS) at the University of Bern averages 0.55 m resulting in a mean time resolution of 570 yr. The 47 values measured at LGGE in Grenoble (ball crusher and gas chromatography) covering depth levels around 3,062 m, between 3,085 and 3095 m, and below 3,120 m, average slightly higher than neighbouring samples analysed at Bern (seeSupplementary Information). Despite this difference, which seems to be larger for low concentrations, the Grenoble measurements confirm the shape of the Bern record. Further confidence in the accuracy of the record is given by LAS measurements of air extracted by sublimating the ice at selected depth levels (Fig. 1). Also, remeasurements of depths between 3,030 m and 3,060 m (615–665 kyr bp) agree with earlier data4within the experimental uncertainty (Fig. 2).

Black solid circles connected by a grey line: data measured at Bern (mean of four to six samples); error bars represent 1σof the mean (s.d.). Red open circles: data measured at Grenoble (2σ= 3 p.p.m.v.). Blue solid circles: Dome C CO2data published by Siegenthaleret al.4.Green solid diamonds: control measurements with the sublimation extraction technique. The black arrow indicates a CO2value of 339 ± 56 p.p.m.v. (s.d.), an artefact detected at a depth of 3,178.12 m (age: 783,040 yr bp). All data are plotted on the EDC3_gas_a age scale26.Glacial terminations are indicated using Roman numerals in subscript (for example TVIII); MIS denotes Marine Isotope Stage27.
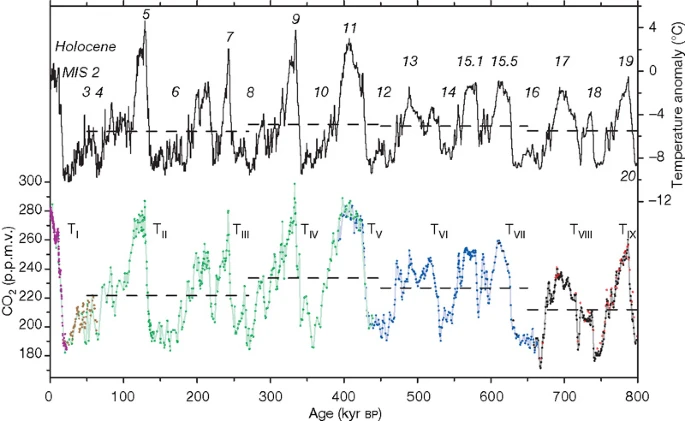
The Dome C temperature anomaly record with respect to the mean temperature of the last millennium8(based on original deuterium data interpolated to a 500-yr resolution), plotted on the EDC3 timescale13,is given as a black step curve. Data for CO2are from Dome C (solid circles in purple5,blue4,black: this work, measured at Bern; red open circles: this work, measured at Grenoble), Taylor Dome6(brown) and Vostok1,2,3(green). All CO2values are on the EDC3_gas_a age scale26.Horizontal lines are the mean values of temperature and CO2for the time periods 799–650, 650–450, 450–270 and 270–50 kyr bp.Glacial terminations are indicated using Roman numerals in subscript (for example TI); Marine Isotope Stages (MIS) are given in italic Arabic numerals27.
At a depth level of 3,178 m, a CO2value of 339 p.p.m.v. (average of four samples) with a large scattering between 264 and 477 p.p.m.v. is found (black arrow,Fig. 1). This artefact can be explained by the fact that this ice is from an ice-core section drilled towards the end of the season 2002–2003, when an ethanol–water mixture had to be added at the bottom of the borehole to allow further drilling. This caused partial melting at the outside of the core and subsequent refreezing when hoisting the core through colder sections of the bore hole. This is the only artefact discovered in the ice above 3,190.56 m.
The part below 3,190 m is characterized by CO2concentrations mainly fluctuating between 180 and 210 p.p.m.v. in both the LGGE and the Bern data. Because of disturbed ice stratigraphy8,this part of the core does not reflect a climatic signal. We therefore limit further discussion of our new data set to the shallower part above 3,190.56 m, that is, back to the glacial corresponding to Marine Isotope Stage (MIS) 20, 800 kyr bp.
The main features of the record are as follows. Starting at a glacial level of 188 p.p.m.v. in MIS 20, the CO2concentration rises by about 70 p.p.m.v. within 9 kyr. This slope is similar to the five glacial–interglacial transitions of the past 450 kyr (seeSupplementary Informationfor a detailed comparison). At the beginning of MIS 19, CO2attains its local maximum of 261 p.p.m.v., which is similar to the highest levels during MIS 13 and 15 but substantially lower than during the four recent interglacials. Similar to MIS 5 and 9, CO2drops by about 15 p.p.m.v. in MIS 19 to a slowly decreasing phase of about 10 kyr, before it declines in a sawtooth pattern to glacial levels. This slow decline in the 10 kyr after the initial peak is in contrast to the slowly increasing CO2levels in the Holocene and the even slower increase in MIS 11, despite the similar orbital configuration of these three periods.
MIS 18 consists of two clearly separated phases. The earlier phase reaches its minimum of 177 p.p.m.v. just before a fast increase to the second, a phase of rather constant CO2concentration between 205 and 212 p.p.m.v. lasting for 20 kyr. A rapid reduction by about 30 p.p.m.v. within a few thousand years, similar to MIS 15.2 and 15.4, and a similarly rapid increase by 40 p.p.m.v. (termination VIII) mark the beginning of the next interglacial. During the 40,000 yr of MIS 17, CO2ranges between 215 and 240 p.p.m.v., which is significantly lower than in other interglacials during the past 800 kyr. At the beginning of MIS 16, CO2remains below 180 p.p.m.v. for 3 kyr, most probably reflecting more pronounced glacial carbon storage in the ocean. During this period, CO2falls to its lowest value ever found in ice cores, 172 p.p.m.v. (667 kyr bp), redefining the natural range of CO2of the late Quaternary to about 170 to 300 p.p.m.v., before it rises at a rate of 8 p.p.m.v. kyr–1to 190 p.p.m.v. at 665 kyr bp.
Figure 2shows our data together with earlier results from the Dome C (650–390 kyr bp4and 22–0 kyr bp5), Vostok1,2,3(440–0 kyr bp) and Taylor Dome6(60–20 kyr bp) ice cores resulting in a composite CO2record over eight glacial cycles. During these 800 kyr, CO2is strongly coupled with the Antarctic temperature (r2= 0.82).
It was suggested earlier4that there is a strong stationary relationship between Antarctic temperature and CO2.But our data reveal a significant deviation from this behaviour: The atmospheric concentration of CO2during MIS 17 remains significantly below the levels during MIS 13, 15 and 19; this is expected neither from the temperature variations which always reach comparable levels during these interglacials nor from carbon cycle models11.Except for MIS 14, the temperature anomalies (relative to the mean temperature of the last millennium) of the coldest levels of all glacial periods range from around -9 to -9.5 °C with CO2concentrations generally in the range 180–190 p.p.m.v.. Exceptions are MIS 16 and MIS 18 where we find significantly lower concentrations of 172–180 p.p.m.v.. To illustrate this difference in the CO2/temperature relationship before and after MIS 16, we calculate mean values for four different time intervals (799–650, 650–450, 450–270 and 270–50 kyr bp). All intervals start and end in the middle of a glacial including two interglacials (seeSupplementary Informationfor details). Whereas averaged temperature anomalies of these four intervals (-5.5, -5.1, -4.9 and -5.5 °C, respectively) only slightly differ from one another, the mean value of CO2between 799 and 650 kyr (212 p.p.m.v.) is 4–9% lower than for the ensuing periods (227, 234 and 222 p.p.m.v.; see further illustrations in theSupplementary Information).
This shift is unexpected and takes place where the new measurement interval for this study begins. However, it seems to be a robust feature and not a measurement artefact, as we find no alteration in our CO2record due to (1) enlarged amounts of impurities12,(2) increasing temperature with depth (-7.2 °C at 3060m to -4.2 °C at 3,200 m, pressure melting point: -2.3 °C) or (3) changes in the ice structure. Also, we observe no peculiarities in the preliminary O2/N2and air content data (D. Raynaud and G. Dreyfus, personal communication) during this period. Furthermore, there is an overall good agreement between the data from Siegenthaleret al.4,the Grenoble and the Bern measurements (this work) using different extraction techniques. Taken together, we conclude that our record reflects the true atmospheric CO2concentration.
Instead of CO2concentrations being about 15 p.p.m.v. lower, the CO2/temperature shift can also be explained by isotopic composition overestimating temperature by about 1 °C. However, both the elevation13and moisture origin corrections on the estimated temperature change do not indicate a systematic overestimation of temperature between MIS 16 and 18.
This implies that there could be a long-term CO2increase by about 25 p.p.m.v. from 800 to 400 kyr bp.Together with the long-term decrease of 15 p.p.m.v. during the past four glacial cycles, we suggest significant slow fluctuations in the atmospheric CO2concentration on timescales of several 105 years, probably influenced by changes in the weathering14or by major reorganizations in the carbon reservoir of the global ocean15.Older ice is required to test hypotheses about any consistent long-term CO2trend and a probable connection with the 500-kyr variations of the Quaternary carbon cycle found in marine records15.
Besides long-term changes, the response of the carbon cycle to millennial climate change is of special interest. Indermühleet al.6found four well-defined oscillations with a peak-to-peak amplitude of about 15 p.p.m.v. during the last glacial in the Taylor Dome ice core. These variations are concomitant to the larger of the Antarctic Isotope Maximum (AIM) events (Antarctic warming events with an amplitude of 1–3 °C)7,16,17.AIM events are counterparts of the short and more pronounced warming events in the Northern Hemisphere known as Dansgaard–Oeschger events18,and hence are a manifestation of the bipolar seesaw19,20,21with oceanic and terrestrial processes likely contributing to the reconstructed CO2variations22,23.
The oldest trace of millennial-scale variations in our record is detected between 778 and 752 kyr bp(Fig. 2). Antarctic temperature8,CO2and the atmospheric concentration of methane24,whose variations are primarily affected by changes in Northern Hemisphere temperature and precipitation25,show three well-defined relative maxima (Fig. 3). A comparison of these data with the corresponding variations during MIS 3 reveals that all three quantities vary in the same range during both periods (seeSupplementary Table 3). Furthermore, the rates of increase of CH4for these three events in MIS 18 are similar to those in the EDC ice core during the large AIM events of MIS 3. Finally, the gradual rise of CO2for events A and B precedes the rapid rise of CH4by a few millennia, which is another typical feature of large AIM events in MIS 37.Although the phasing for event C is less clear because of the relatively small CO2increase, our findings provide strong support for an active bipolar seesaw during MIS 18.

Variations of Dome C CO2(black solid circles; mean of four to six samples; error bars are 1σof the mean (s.d.)), methane24(green) and temperature anomaly based on the mean temperature of the past millennium8(black step curve) between 778 and 752 kyr bp.Gases are plotted on the EDC3_gas_a age scale26,temperature on the EDC3 timescale13.The letters A to C denote the three events.
Methods Summary
The analytical methods for routine CO2measurements used at the University of Bern and at LGGE in Grenoble are based on dry extraction techniques followed by laser absorption spectroscopy and gas chromatography, respectively. In Bern, four to six samples (23 × 23 × 16 mm; 8 g) from each depth level (every 550 mm) in the ice core are measured in random order (two on the same day; the following two after all depth intervals have been measured twice). The samples are crushed by a cooled needle cracker under vacuum conditions. The sample container is connected to a cold trap for several minutes to release the air from the clathrates. Afterwards, the air is expanded to a measuring cell, where a laser is tuned six times over the absorption line of a vibration–rotation transition of the CO2molecule. The calibration is done using a CO2in air standard gas (251.65 p.p.m.v.) scaled on the World Meteorological Organization mole fraction scale.
In Grenoble, on every depth level one to three samples of about 40 g of ice are crushed under vacuum conditions. About 20 min later, the extracted gas is expanded in the sample loop of the gas chromatograph and analysed. Depending on the amount of the extracted air, three to five successive analyses are done. To avoid the possible influence of the water vapour injected with the gas, the CO2ratio is calculated as the ratio between the CO2peak and the air (O2 + N2) peak. The calibration is done using an Air Liquide standard scaled on three CSIRO standards (260.3 p.p.m.v., 321.1 p.p.m.v. and 172.8 p.p.m.v.).
References
Petit, J. R. et al. Climate and atmospheric history of the past 420,000 years from the Vostok ice core, Antarctica.Nature399,429–436 (1999)
Pepin, L., Raynaud, D., Barnola, J. M. & Loutre, M. F. Hemispheric roles of climate forcings during glacial–interglacial transitions as deduced from the Vostok record and LLN-2D model experiments.J. Geophys. Res.106,31885–31892 (2001)
Raynaud, D. et al. The record for marine isotopic stage 11.Nature436,39–40 (2005)
Siegenthaler, U. et al. Stable carbon cycle–climate relationship during the Late Pleistocene.Science310,1313–1317 (2005)
Monnin, E. et al. Atmospheric CO2 concentrations over the last glacial termination.Science291,112–114 (2001)
Indermühle, A., Monnin, E., Stauffer, B., Stocker, T. F. & Wahlen, M. Atmospheric CO2 concentration from 60 to 20 kyrbpfrom the Taylor Dome ice core, Antarctica.Geophys. Res. Lett.27,735–738 (2000)
Ahn, J. H. & Brook, E. J. Atmospheric CO2 and climate from 65 to 30 kabp.Geophys. Res. Lett.34,L10703, 10.1029/2007/GL029551 (2007)
Jouzel, J. et al. Orbital and millennial Antarctic climate variability over the last 800,000 years.Science317,793–796 (2007)
Wolff, E. W. et al. Southern Ocean sea ice extent, productivity and iron flux over the past eight glacial cycles.Nature440,491–496 (2006)
EPICA Community Members. Eight glacial cycles from an Antarctic ice core.Nature429,623–628 (2004)
Köhler, P. & Fischer, H. Simulating low frequency changes in atmospheric CO2 during the last 740 000 years.Clim. Past2,57–78 (2006)
Lambert, F. et al. Dust-climate couplings over the past 800,000 years from the EPICA Dome C ice core.Nature452,616–619 (2008)
Parrenin, F. et al. The EDC3 chronology for the EPICA Dome C ice core.Clim. Past3,485–497 (2007)
Kump, L. R., Brantley, S. L. & Arthur, M. A. Chemical weathering, atmospheric CO2, and climate.Annu. Rev. Earth Planet. Sci.28,611–667 (2000)
Wang, P., Tian, J., Cheng, X., Liu, C. & Xu, J. Major Pleistocene stages in a carbon perspective: The South China Sea record and its global comparison.Paleoceanography19PA4005 10.1029/2003PA000991 (2004)
Blunier, T. & Brook, E. J. Timing of millennial-scale climate change in Antarctica and Greenland during the last glacial period.Science291,109–112 (2001)
EPICA Community Members. One-to-one coupling of glacial climate variability in Greenland and Antarctica.Nature444,195–198 (2006)
North Greenland Ice Core Project Members. High-resolution climate record of the Northern Hemisphere back into the last interglacial period.Nature431,147–151 (2004)
Broecker, W. S. Paleocean circulation during the last deglaciation: a bipolar seesaw?Paleoceanography13,119–121 (1998)
Stocker, T. F. The seesaw effect.Science282,61–62 (1998)
Stocker, T. F. & Johnsen, S. J. A minimum thermodynamic model for the bipolar seesaw.Paleoceanography181087 doi: 10.1029/2003PA000920 (2003)
Marchal, O. et al. Modelling the concentration of atmospheric CO2 during the Younger Dryas climate event.Clim. Dyn.15,341–354 (1999)
Köhler, P., Joos, F., Gerber, S. & Knutti, R. Simulated changes in vegetation distribution, land carbon storage, and atmospheric CO2 in response to a collapse of the North Atlantic thermohaline circulation.Clim. Dyn.25,689–708 (2005)
Loulergue, L. et al. Orbital and millennial-scale features of atmospheric CH4 over the past 800,000 years.Naturedoi: 10.1038/nature06950 (this issue)
Siddall, M. et al. Using a maximum simplicity paleoclimate model to simulate millennial variability during the last four glacial periods.Quat. Sci. Rev.25,3185–3197 (2006)
Loulergue, L. et al. New constraints on the gas age-ice age difference along the EPICA ice cores, 0–50 kyr.Clim. Past3,527–540 (2007)
Lisiecki, L. E. & Raymo, M. E. A. Pliocene–Pleistocene stack of 57 globally distributed benthic δ18O records.Paleoceanography20,PA1003 (2005)
Acknowledgements
This work is a contribution to the European Project for Ice Coring in Antarctica (EPICA), a joint European Science Foundation/European Commission scientific program, funded by the European Commission and by national contributions from Belgium, Denmark, France, Germany, Italy, the Netherlands, Norway, Sweden, Switzerland and the United Kingdom. The main logistic support was provided by IPEV and PNRA (at Dome C). We thank the technical team on the field and at both laboratories, G. Hausammann for helping with the CO2measurements, and B. Stauffer, J. Schwander, M. Leuenberger, F. Joos, V. Masson-Delmotte, G. Dreyfus and C. Körner for their input. We acknowledge financial support by the Swiss NSF, the University of Bern, the Swiss Federal Agency of Energy and the French ANR (Agence nationale pour la Recherche; programme PICC). This is EPICA publication no. 194.
Author information
Authors and Affiliations
Corresponding author
Supplementary information
The file contains Supplementary Notes, Supplementary Tables 1-4 and Supplementary Figures S1-S4 with Legends.
This file provides details concerning the measurement methods, the intercomparison between Bern and Grenoble, the time relationship between CO2 and Antarctic temperature anomaly in general as well as during ice age terminations. Furthermore, it discusses the lowest CO2 concentrations, the choice of the intervals for figure 2 and includes a table comparing the events detected in stage 18 with the AIM events during stage 3. (PDF 413 kb)
The file contains Supplementary Table.
The new EPICA Dome C CO2 data (prior than 650 kyr) measured at the University of Bern and at LGGE in Grenoble are listed against depth and the corresponding EDC3_gas_a age in table 1. Table 2 contains all CO2 data which are discussed in the paper synchronized on the EDC3_gas_a age scale. Finally, table 3 shows a composite CO2 record over the last 800,000 years. (XLS 320 kb)
Rights and permissions
About this article
Cite this article
Lüthi, D., Le Floch, M., Bereiter, B.et al.High-resolution carbon dioxide concentration record 650,000–800,000 years before present. Nature453,379–382 (2008). https://doi.org/10.1038/nature06949
Received:
Accepted:
Issue Date:
DOI:https://doi.org/10.1038/nature06949
This article is cited by
-
Late Pleistocene island weathering and precipitation in the Western Pacific Warm Pool
npj Climate and Atmospheric Science(2024)
-
Rapid Laurentide Ice Sheet growth preceding the Last Glacial Maximum due to summer snowfall
Nature Geoscience(2024)
-
Productivity in the Southern Ocean Antarctic Zone during the Northern Hemisphere Glaciation (NHG) and its link to atmospheric pCO2
Science China Earth Sciences(2024)
-
Characterization of annual urban air temperature changes with special reference to the city of Modena: a comparison between regression models and a proposal for a new index to evaluate relationships between environmental variables
Stochastic Environmental Research and Risk Assessment(2024)
-
Distinctive changes of Asian–African summer monsoon in interglacial epochs and global warming scenario
Climate Dynamics(2024)
Comments
By submitting a comment you agree to abide by ourTermsandCommunity Guidelines.If you find something abusive or that does not comply with our terms or guidelines please flag it as inappropriate.
