Adiagramis a symbolicrepresentationofinformationusingvisualizationtechniques. Diagrams have been used since prehistoric times onwalls of caves,but became more prevalent during theEnlightenment.[1]Sometimes, the technique uses athree-dimensionalvisualization which is thenprojectedonto a two-dimensional surface. The wordgraphis sometimes used as asynonymfor diagram.
Overview
editThe term "diagram" in its commonly used sense can have a general or specific meaning:
- visual information device:Like the term "illustration","diagram "is used as a collective term standing for the whole class of technical genres, includinggraphs,technical drawings and tables.
- specific kind of visual display:This is the genre that shows qualitative data with shapes that are connected by lines, arrows, or other visual links.
In science the term is used in both ways. For example, Anderson (1997) stated more generally: "diagrams are pictorial, yet abstract, representations of information, andmaps,line graphs,bar charts,engineeringblueprints,andarchitects'sketchesare all examples of diagrams, whereas photographs and video are not ".[2]On the other hand, Lowe (1993) defined diagrams as specifically "abstract graphic portrayals of the subject matter they represent".[3]
In the specific sense diagrams and charts contrast withcomputer graphics,technical illustrations,infographics,maps, andtechnical drawings,by showing "abstract rather thanliteralrepresentations of information ".[4]The essence of a diagram can be seen as:[4]
- aformof visualformattingdevices
- adisplaythat does not showquantitative data(numerical data), but rather relationships and abstract information
- withbuilding blockssuch as geometrical shapes connected bylines,arrows,or other visual links.
Or in Hall's (1996) words "diagrams are simplified figures, caricatures in a way, intended to convey essential meaning".[5]These simplified figures are often based on a set of rules. The basic shape according to White (1984) can be characterized in terms of "elegance, clarity, ease, pattern, simplicity, and validity".[4]Elegance is basically determined by whether or not the diagram is "the simplest and most fitting solution to a problem".[6]
Diagrammatology
editDiagrammatologyis the academic study of diagrams. Scholars note that while a diagram may look similar to the thing that it represents, this is not necessary. Rather a diagram may only havestructural similarityto what it represents, an idea often attributed toCharles Sanders Peirce.[7]: 42 Structural similarity can be defined in terms of a mapping between parts of the diagram and parts of what the diagram represents and the properties of this mapping, such as maintaining relations between these parts and facts about these relations. This is related to the concept ofisomorphism,orhomomorphismin mathematics.[7]: 43
Sometimes certaingeometricproperties (such as which points are closer) of the diagram can be mapped to properties of the thing that a diagram represents. On the other hand, the representation of an object in a diagram may be overly specific and properties that are true in the diagram may not be true for the object the diagram represents.[7]: 48 A diagram may act as a means of cognitive extension allowingreasoningto take place on the diagram based on which constraints are similar.[7]: 50
Gallery of diagram types
editThere are at least the following types of diagrams:
Logical
edit- Logicalor conceptual diagrams, which take a collection of items and relationships between them, and express them by giving each item a 2D position, while the relationships are expressed as connections between the items or overlaps between the items, for example:


Quantitative
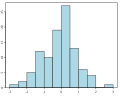
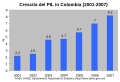
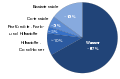
edit- Quantitative diagrams, which display a relationship between two variables that take eitherdiscreteor acontinuousrange of values; for example:
-
-
-
-

-

-
 Hanger diagram.


Schematic
edit- Schematicsand other types of diagrams, for example:


Many of these types of diagrams are commonly generated using diagramming software such asVisioandGliffy.
Diagrams may also be classified according to use or purpose, for example, explanatory and/orhow todiagrams.
Thousands of diagram techniques exist. Some more examples follow:
Specific diagram types
editSee also
edit- commons:Specific diagram types– Gallery of many diagram types at Wikimedia Commons
- Chart– Graphical representation of data
- Data and information visualization– Visual representation of data
- Diagrammatic reasoning– reasoning by the mean of visual representations
- Diagrammatology
- Experience model
- JavaScript graphics libraries– Libraries for creating diagrams and other data visualization
- List of graphical methods
- Mathematical diagram– Visual representation of a mathematical relationship
- PGF/TikZ– Graphics languages
- Plot (graphics)– Graphical technique for data sets
- Table (information)– Arrangement of information or data, typically in rows and columns
References
edit- ^Eddy, Matthew Daniel (2021)."Diagrams".In Blair, Ann; Duguid, Paul; Goeing, Anja-Silvia; Grafton, Anthony (eds.).Information: A Historical Companion.Princeton, NJ:Princeton University Press.pp.397–401.doi:10.2307/j.ctv1pdrrbs.42.ISBN9780691179544.JSTORj.ctv1pdrrbs.42.OCLC1202730160.S2CID240873019.
- ^Michael Anderson (1997). "Introduction to Diagrammatic Reasoning", atcs.hartford.edu.Retrieved 21 July 2008.
- ^Lowe, Richard K. (1993). "Diagrammatic information: techniques for exploring its mental representation and processing".Information Design Journal.7(1):3–18.doi:10.1075/idj.7.1.01low.
- ^abcBrasseur, Lee E.(2003).Visualizing technical information: a cultural critique.Amityville, N.Y: Baywood Pub.ISBN0-89503-240-6.
- ^Bert S. Hall (1996). "The Didactic and the Elegant: Some Thoughts on Scientific and Technological Illustrations in the Middle Ages and Renaissance". in: B. Braigie (ed.)Picturing knowledge: historical and philosophical problems concerning the use of art in science.Toronto: University of Toronto Press. p.9
- ^White, Jan V. (1984).Using charts and graphs: 1000 ideas for visual persuasion.New York: Bowker.ISBN0-8352-1894-5.
- ^abcdPombo, Olga; Gerner, Alexander, eds. (2010).Studies in Diagrammatology and Diagram Praxis.London: College Publications.ISBN978-1-84890-007-3.OCLC648770148.
Further reading
edit- Bounford, Trevor (2000).Digital diagrams.New York: Watson-Guptill Publications.ISBN978-0-8230-1572-6.
- Michael Anderson, Peter Cheng, Volker Haarslev (Eds.) (2000).Theory and Application of Diagrams: First International Conference, Diagrams 2000.Edinburgh, Scotland, UK, September 1–3, 2000. Proceedings.
- Garcia, M. (ed.), (2012)The Diagrams of Architecture.Wiley. Chichester.
External links
edit- What is Gigamapping(website provided by the Oslo School of Architecture and Design)