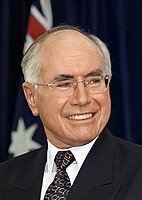
The2001 Australian federal electionwas held in Australia on 10 November 2001. All 150 seats in theHouse of Representativesand 40 seats in the 76-memberSenatewere up for election. The incumbentLiberal Party of Australialed byPrime Minister of AustraliaJohn Howardandcoalitionpartner theNational Party of Australialed byJohn Andersondefeated the oppositionAustralian Labor Partyled byKim Beazley.As of 2024, this was the most recent election to feature a rematch of both major party leaders. Future Opposition LeaderPeter Duttonentered parliament at this election.
| |||||||||||||||||||||||||||||||||||||||||||||||||||||||||
All 150 seats in theHouse of Representatives 76 seats were needed for a majority in the House 40 (of the 76) seats in theSenate | |||||||||||||||||||||||||||||||||||||||||||||||||||||||||
|---|---|---|---|---|---|---|---|---|---|---|---|---|---|---|---|---|---|---|---|---|---|---|---|---|---|---|---|---|---|---|---|---|---|---|---|---|---|---|---|---|---|---|---|---|---|---|---|---|---|---|---|---|---|---|---|---|---|
| Registered | 12,708,837 | ||||||||||||||||||||||||||||||||||||||||||||||||||||||||
| Turnout | 12,054,664 (94.85%) ( | ||||||||||||||||||||||||||||||||||||||||||||||||||||||||
| |||||||||||||||||||||||||||||||||||||||||||||||||||||||||
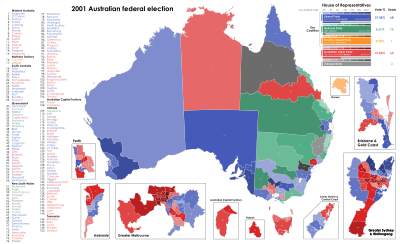
 Results by division for the House of Representatives, shaded by winning party's margin of victory. | |||||||||||||||||||||||||||||||||||||||||||||||||||||||||
| |||||||||||||||||||||||||||||||||||||||||||||||||||||||||
Background
editThroughout much of 2001, the Coalition had been trailing Labor in opinion polls, thanks to dissatisfaction with the government's economic reform programme and high petrol prices.[citation needed]The oppositionAustralian Labor Partyhad won a majority of the two-party-preferred vote atthe previous electionand had won a series of state and territory elections. Labor also recorded positive swings in two by-elections, taking the Queensland seat ofRyanand coming close inAston.
However following theSeptember 11 attacks,and theChildren OverboardandTampa affairs,Polls swung strongly toward the coalition after the "Tampa" controversy but before the 11 September attacks.[1]
In fact, voter concern with terrorism in the aftermath of theSeptember 11 attacksin theUnited Stateswas noted, with the rise in the combined primary votes of the major parties from 79.61% at the previous election in 1998, to 81.17% at this election. There would be further increases in the combined major party primary vote in 2004 and 2007.
Another major issue was the collapse of the country's second-biggest airlineAnsett Australiaand the question of whether it should be given abailout.The Coalition was opposed to any bailout because the collapse was not the government's fault.[citation needed]However, Labor supported a bailout, because the company's collapse was about to result in the biggest mass job loss in Australian history, whilst also arguing that the government was partially responsible for allowing Ansett to be taken over byAir New Zealand,a move which had caused Ansett's failure.[2]Although the two-party preferred result was reasonably close, the ALP recorded its lowest primary vote since 1934.[3]
During the 2001 election campaign, Labor made a 'GSTrollback' a centrepiece of its election platform. Labor attempted to reprise the effects of the birthday cake interview by deriding the application of GST to cooked and uncooked chickens, but failed to ignite public response to the limited scope of the rollbacks applying only to gas and electricity bills. the election loss of Labor in 2001, would effectively end all serious opposition to GST.
Political scientists[who?]have suggested that television coverage has subtly transformed the political system, with a spotlight on leaders rather than parties, thereby making for more of an American presidential-style system. In this election, television news focused on international issues, especially terrorism and asylum seekers. Minor parties were largely ignored as the two main parties monopolised the media's attention. The election was depicted as a horse-race between Howard and Beazley, with Howard running ahead and therefore being given more coverage than his Labor rival.[4]
The election-eveNewspollforecast that the Liberal/National Coalition would get 53 percent of thetwo-party-preferred vote.[5]
Results
editHouse of Representatives results
editCoalition
Liberal(68)
National(13)
CLP(1)
Opposition(65)
Labor(65)
Crossbench(3)
Independent(3)
| Party | Votes | % | Swing | Seats | Change | |||
|---|---|---|---|---|---|---|---|---|
| Liberal | 4,254,072 | 37.08 | +3.19 | 68 | 4 | |||
| National | 643,926 | 5.61 | +0.32 | 13 | 3 | |||
| Country Liberal | 36,961 | 0.32 | –0.00 | 1 | 1 | |||
| Liberal–National coalition | 4,934,959 | 42.92 | +3.41 | 82 | 2 | |||
| Labor | 4,341,420 | 37.84 | −2.26 | 65 | 2 | |||
| Democrats | 620,197 | 5.41 | +0.28 | 0 | ||||
| Greens | 569,074 | 4.96 | +2.82 | 0 | ||||
| One Nation | 498,032 | 4.34 | −4.09 | 0 | ||||
| Independents | 332,118 | 2.89 | +1.00 | 3 | 2 | |||
| Others | 178,274 | 1.64 | 0 | |||||
| Total | 11,474,074 | 150 | 2 | |||||
| Two-party-preferred vote | ||||||||
| Coalition | 5,655,791 | 51.03 | +2.01 | 82 | 2 | |||
| Labor | 5,427,569 | 48.97 | −2.01 | 65 | 2 | |||
| Invalid/blank votes | 580,362 | 4.81 | +1.04 | |||||
| Turnout | 12,054,455 | 95.39 | ||||||
| Registered voters | 12,636,631 | |||||||
| Source:AEC Tally Room | ||||||||
Senate results
editCoalition
Liberal(31)
National(3)
CLP(1)
Opposition(28)
Labor(28)
Crossbench(12)
Democrats(8)
Greens(2)
One Nation(1)
Independent(2)
| Party | Votes | % | Swing | Seats won | Total seats | Change | |||
|---|---|---|---|---|---|---|---|---|---|
| Liberal/National Coalition | |||||||||
| Liberal/Nationaljoint ticket | 2,776,052 | 23.87 | +2.00 | 6 | 11 | ||||
| Liberal | 1,824,745 | 15.69 | +2.06 | 12 | 22 | ||||
| National | 222,860 | 1.92 | +0.06 | 1 | 1 | ||||
| Country Liberal | 40,680 | 0.35 | +0.03 | 1 | 1 | ||||
| Coalition total | 4,863,337 | 41.83 | +4.15 | 20 | 35 | ||||
| Labor | 3,990,997 | 34.32 | -2.99 | 14 | 28 [a] | ||||
| Democrats | 843,130 | 7.25 | -1.20 | 4 | 8 | 1 | |||
| One Nation | 644,364 | 5.54 | -3.44 | 0 | 1 | ||||
| Greens | 574,543 | 4.94 | +2.22 | 2 | 2 | 1 | |||
| Others | 630,600 | 5.44 | +0.22 | 0 | 2 [a] | ||||
| Total | 11,627,529 | 40 | 76 | ||||||
| Invalid/blank votes | 470,515 | 3.9 | |||||||
| Turnout | 12,098,320 | 95.7 | |||||||
| Registered voters | 12,636,631 | ||||||||
| Source:Federal Elections 1998 | |||||||||
House of Representatives preference flows
edit- The Nationals had candidates in 14 seats wherethree-cornered-contestsexisted, with 87.34% of preferences favouring the Liberal Party.
- The Democrats contested 145 electorates with preferences favouring Labor (64.13%).
- The Greens contested 145 electorates with preferences strongly favouring Labor (74.83%).
- One Nation contested 120 electorates with preferences slightly favouring the Liberal/National Coalition (55.87%).
Seats changing hands
editThe following table indicates seats that changed hands from one party to another at this election. It compares the election results with the previous margins, taking into account redistributions inNew South Wales,Western Australia, South Australia,Tasmaniaand both territories. As a result, it includes the seats ofMacarthurandParramatta,which were held by Liberal members but had notional Labor margins. The table also includes the new seat ofHasluck(retained by Labor); the abolishedNorthern Territory,which was divided intoLingiari(retained by Labor) andSolomon(retained by theCLP); andPaterson,a Labor seat made Liberal by the redistribution
See also
editNotes
edit- ^abShayne Murphyhad resigned from the Labor Party on 2 October 2001 and served out the rest of his term as an independent.
- ^For seats that were affected by the redistribution theAustralian Electoral Commissioncalculated "notional" margins for the redistributed divisions by modelling the outcome of the previous election as if the new boundaries had been in place.[7]
- ^Margin is over Labor.
- ^Macarthur had become a notional Labor seat as a result of the redistribution.
- ^Parramatta had become a notional Labor seat as a result of the redistribution.
- ^Patersonhad become a notional Liberal seat as a result of the redistribution.
- ^John Moore(Liberal) had wonRyanat the1998 election,however he resigned in 2001 andLeonie Short(Labor) won the seat at theresulting by-election.
References
edit- ^Issues that swung elections: Tampa and the national security election of 2001The Conversation
- ^"Tampa issue improves Coalition election prospects: ABC 7.30 report 4/9/2001".Abc.net.au. Archived fromthe originalon 22 October 2008.Retrieved13 June2010.
- ^"australianpolitics".australianpolitics.Retrieved13 June2010.
- ^David Denemark, Ian Ward, and Clive Bean, Election Campaigns and Television News Coverage: The Case of the 2001 Australian Election. Australian Journal of Political Science. (2007) 42#1 pp: 89–109online
- ^"Newspoll archive since 1987".Polling.newspoll.au.tmp.anchor.net.au. Archived fromthe originalon 3 March 2016.Retrieved30 July2016.
- ^"2001 Senate national summary".Psephos Adam Carr's Election Archive.Retrieved8 June2022.
- ^"National seat status".Australian Electoral Commission.Retrieved13 May2019.
- ^"Electoral Newsfile 97: Seat Status including notional seat status for SA, NSW, Tas, WA and NT Divisions".Australian Electoral Commission.2001.
External links
edit- Australian Electoral Commission Results
- University of WAArchived18 January 2015 at theWayback Machineelection results in Australia since 1890
- AEC 2PP vote
- AustralianPolitics election details
- Preference flows – ABC

