The demographics ofNew Zealandencompass the gender, ethnic, religious, geographic, and economic backgrounds of the 5.3 million[6]people living in New Zealand.New Zealanderspredominantly live in urban areas on theNorth Island.The five largest cities areAuckland,Wellington,Christchurch,Hamilton,andTauranga.Few New Zealanders live on New Zealand's smaller islands.Waiheke Island(near Auckland) is easily the most populated smaller island with 9,140 residents, whileGreat Barrier Island,theChatham and Pitt Islands,andStewart Islandeach have populations below 1,000. New Zealand ispart of a realmand most people born in the realm's external territories ofTokelau,theRoss Dependency,theCook IslandsandNiueare entitled to New Zealand passports.
| Demographics ofNew Zealand | |
|---|---|
 Population pyramidofNew Zealandin 2023 | |
| Population | 5,338,500 |
| • Year | 2023 (Stats NZestimate) |
| Density | 19.9/km2(51.5/sq mi) |
| Growth rate | 2.1% (Stats NZ projection)[1] |
| Birth rate | 11.4 per 1000 pop. (2022) |
| Death rate | 5.5 per 1000 pop. (2022) |
| Life expectancy | |
| • male | 80.3 years[2] |
| • female | 83.7 years[2] |
| Fertility rate | 1.56 births per woman (2023) |
| Infant mortality rate | 3.53 per 1000 live births (2023) |
| Net migration rate | 14.72 per 1000 pop.[1] |
| Age structure | |
| 0–14 years | 19.6%[1] |
| 15–64 years | 65.5%[1] |
| 65 and over | 14.9%[1] |
| Sex ratio | |
| Total | 0.97 males/female[1] |
| Under 15 | 1.05 males/female[1] |
| 15–64 years | 0.97 males/female[1] |
| 65 and over | 0.87 males/female[1] |
| Nationality | |
| Nationality | New Zealander |
| Major ethnic | European67.8%[3] |
| Minor ethnic |
|
| Language | |
| Official | |
| Spoken |
|
As of the2018 census,the majority of New Zealand's population is ofEuropean descent(70 percent; often referred to asPākehā), with the indigenousMāoribeing the largest minority (16.5 percent), followed byAsians(15.3 percent), and non-MāoriPacific Islandersknown collectively asPasifika(9.0 percent).[4]This is reflected inimmigration,with most new migrants coming from Britain and Ireland, although the numbers from Asia in particular are increasing. Auckland is the most ethnically diverse region in New Zealand with 53.5 percent identifying as Europeans, 28.2 percent as Asian, 11.5 percent as Māori, 15.5 percent as Pasifika, and 2.3 percent as Middle Eastern, Latin American or African (MELAA).[7]New Zealand is considered by some to be unique among Western countries for its high levels ofethnic intermarriage,[8]which has historically been viewed with tolerance.[9][10][8]According to a 2006 study, Māori have on average roughly 43% European ancestry, although the notion of being "mixed-race"is uncommon.[11][12]
English,Māori,andNew Zealand Sign Languageare the official languages, with English being predominant and understood by the vast majority of Māori speakers. Significant minorities speakChinese,Samoan,Hindi,French,andTagalog.New Zealand English is mostlynon-rhotic,but has distinctrhoticdialects as well. Rhoticity is widespread amongPasifikaandMāoriand is becoming increasingly common across the upperNorth Island.[13]The closest English dialect to non-rhotic New Zealand English is Australian English, but they have several key distinctions, such as the New Zealandcentralisationof the shorti.The Māori language has undergone a process of revitalisation and is spoken by 4 percent of the population. New Zealand has an adult literacy rate of 99 percent and over half of the population aged 15–29 hold a tertiary qualification. In the adult population 14.2 percent have abachelor's degreeor higher, 30.4 percent have some form of secondary qualification as their highest qualification and 22.4 percent have no formal qualification. As at the 2018 census, 37 percent of the population identify asChristians,withHinduismandBuddhismbeing the largest minority religions; almost half of the population (48.5 percent) isirreligious.[4]
Farmingis a major occupation in New Zealand, although more people are employed as sales assistants. Most New Zealanders earn wage or salary income, with a median weekly income in 2022 ofNZ$848.[14]
Terminology
editWhile thedemonymfor a New Zealand citizen isNew Zealander,the informal "Kiwi"is commonly used both internationally[15]and by locals.[16]The name derives from thekiwi,a nativeflightless bird,which is thenational symbolof New Zealand. The Māori loanword "Pākehā"usually refers toNew Zealanders of European descent,although some reject this appellation,[17][18]and some Māori use it to refer to all non-Polynesian New Zealanders.[19]Most people born in New Zealand or one of therealm'sexternal territories (Tokelau,theRoss Dependency,theCook IslandsandNiue) before 2006 areNew Zealand citizens.Further conditions apply for those born from 2006 onwards.[n 2][21]
Population size and distribution
edit
The2018 censusenumerated a resident population of 4,699,755 – a 10.8 percent increase over the population recorded in the2013 census.[4]As of February 2025, the total population has risen to an 5,464,380 (estimated by extrapolation).[22]The population is increasing at a rate of 1.4–2.0 percent per year.[23]In May 2020,Statistics New Zealandreported that New Zealand's population had climbed above 5 million people in March 2020;[24]in September 2020, this was revised six months earlier to September 2019 when population estimates were rebased to the 2018 census.[25]
The median child birthing age was 30 and thetotal fertility rateis 2.1 births per woman in 2010. In Māori populations the median age is 26 and fertility rate 2.8.[26]In 2010 theage-standardisedmortality ratewas 3.8 deaths per 1000 (down from 4.8 in 2000) and theinfant mortality ratefor the total population was 5.1 deaths per 1000 live births.[26]Thelife expectancyof a New Zealand child born in 2021-23 was 83.7 years for females, and 80.3 years for males,[2]which isamong the highest in the world.Life expectancy at birth is forecast to increase from 80 years to 85 years in 2050 and infant mortality is expected to decline.[27]In 2050 the median age is forecast to rise from 36 years to 43 years and the percentage of people 60 years of age and older rising from 18 percent to 29 percent.[27][n 3]During early migration in 1858, New Zealand had 131 males for every 100 females, but following changes in migration patterns and the modern longevity advantage of women, females came to outnumber males in 1971.[29]As of 2012 there are 0.99 males per female, with males dominating under 15 years and females dominating in the 65 years or older range.[30]
Graphs are unavailable due to technical issues. Updates on reimplementing the Graph extension, which will be known as the Chart extension, can be found onPhabricatorand onMediaWiki.org. |
Graphs are unavailable due to technical issues. Updates on reimplementing the Graph extension, which will be known as the Chart extension, can be found onPhabricatorand onMediaWiki.org. |
Age structure
edit| Age Group | Male | Female | Total | % |
|---|---|---|---|---|
| Total | 2 542 600 | 2 580 000 | 5 122 600 | 100 |
| 0–4 | 156 710 | 148 800 | 305 510 | 5.96 |
| 5–9 | 167 260 | 158 310 | 325 570 | 6.36 |
| 10–14 | 173 620 | 163 920 | 337 540 | 6.59 |
| 15–19 | 161 330 | 153 550 | 314 880 | 6.15 |
| 20–24 | 172 020 | 161 240 | 333 260 | 6.51 |
| 25–29 | 190 640 | 181 390 | 372 030 | 7.26 |
| 30–34 | 191 640 | 192 470 | 384 110 | 7.50 |
| 35–39 | 168 840 | 172 260 | 341 110 | 6.66 |
| 40–44 | 154 820 | 157 780 | 312 600 | 6.10 |
| 45–49 | 158 830 | 164 650 | 323 490 | 6.31 |
| 50–54 | 161 590 | 169 610 | 331 200 | 6.47 |
| 55–59 | 157 610 | 166 540 | 324 150 | 6.33 |
| 60–64 | 144 220 | 153 870 | 298 090 | 5.82 |
| 65-69 | 122 810 | 130 780 | 253 590 | 4.95 |
| 70-74 | 106 650 | 112 880 | 219 540 | 4.29 |
| 75-79 | 71 690 | 79 510 | 151 200 | 2.95 |
| 80-84 | 46 770 | 56 990 | 103 760 | 2.03 |
| 85-89 | 23 540 | 32 880 | 56 420 | 1.10 |
| 90+ | 12 010 | 22 570 | 34 580 | 0.68 |
| Age group | Male | Female | Total | Percent |
| 0–14 | 497 590 | 471 030 | 968 620 | 18.91 |
| 15–64 | 1 661 540 | 1 673 360 | 3 334 900 | 65.10 |
| 65+ | 383 470 | 435 610 | 819 080 | 15.99 |

The age structure of New Zealand is getting increasingly older. Due to undergoing the demographic transition from a 'pre-industrial' age structure to a 'post-industrial' age structure, the country has a sub-replacement fertility rate which is consequently leading to an older population and more evenly balanced population pyramid.[32]
The average age of the citizen has gone from 25.8 years old in 1965 to 38 in 2020 and is projected to rise to 43.7 years old in 2050.[33]The population of 90 year olds is also expected to rise dramatically, in the 1930s there were approximately 1,000 90+ year olds, in 2016 the number had risen to 29,000, in 2030 it is expected to exceed 50,000 and by the 2060s it is to rise above 180,000 people.[34]
Population density
edit
New Zealand'spopulation densityis relatively low, at 19.9 per square kilometre (51.5 per square mile) (June 2024 estimate).[35]The vast majority of the population live on the mainNorthandSouth Islands,with New Zealand's major inhabited smaller islands beingWaiheke Island(9,140), theChatham and Pitt Islands(720), andStewart Island(381).[35]Over three-quarters of the population (76.4%) live in the North Island, with one-third of the total population (33.7%) living in theAuckland Region.Most Māori live in the North Island (86.0 percent), although less than a quarter (23.8 percent) live in Auckland.[36]
New Zealand is a predominantly urban country, with 84.3 percent of the population living in anurban area.About 64.8 percent of the population live in the 20 main urban areas (population of 30,000 or more) and 43.8 percent live in the four largest cities of Auckland, Christchurch, Wellington, and Hamilton.[35]
Approximately 14 percent of the population live in four different categories ofrural areasas defined byStatistics New Zealand.About 18 percent of the rural population live in areas that have a high urban influence (roughly 12.9 people per square kilometre), many working in the main urban area. Rural areas with moderate urban influence and a population density of about 6.5 people per square kilometre account for 26 percent of the rural population. Areas with low urban influence where the majority of the residents work in the rural area house approximately 42 percent of the rural population. Remote rural areas with a density of less than 1 person per square kilometre account for about 14 percent of the rural population.[37]
Before local government reforms in the late 1980s, aborough councilwith more than 20,000 people could beproclaimed a city.[38][39]The boundaries of councils tended to follow the edge of the built-up area, so there was little difference between the urban area and the local government area. In 1989, all councils were consolidated intoregional councils(top tier) andterritorial authorities(second tier) which cover a much wider area and population than the old city councils.[40]Today a territorial authority must have a predominantly urban population of at least 50,000 before it can be officially recognised as a city.[41]
Vital statistics
editVital statistics since 1921
edit| Population [n 4] |
Live births |
Deaths | Natural change |
Crude birth rate (per 1,000) |
Crude death rate (per 1,000) | Natural change (per 1,000) | Crude Migration change (per 1,000) | Total fertility rate[n 5] | |
|---|---|---|---|---|---|---|---|---|---|
| 1921 | 29,623 | 11,474 | 18,149 | 3.08 | |||||
| 1922 | 30,448 | 11,874 | 18,574 | 3.08 | |||||
| 1923 | 29,148 | 12,239 | 16,909 | 2.96 | |||||
| 1924 | 29,260 | 11,540 | 17,720 | 2.93 | |||||
| 1925 | 29,869 | 11,844 | 18,025 | 2.90 | |||||
| 1926 | 29,904 | 12,517 | 17,387 | 2.88 | |||||
| 1927 | 1,429,700 | 29,278 | 12,600 | 16,678 | 20.3 | 8.8 | 11.6 | 2.9 | 2.79 |
| 1928 | 1,450,400 | 28,938 | 12,860 | 16,078 | 19.8 | 8.8 | 11.0 | 0.7 | 2.70 |
| 1929 | 1,467,400 | 28,859 | 13,220 | 15,639 | 19.5 | 9.0 | 10.6 | 2.1 | 2.64 |
| 1930 | 1,486,100 | 28,822 | 13,145 | 15,677 | 19.3 | 8.8 | 10.5 | 3.4 | 2.60 |
| 1931 | 1,506,800 | 28,867 | 13,062 | 15,805 | 19.1 | 8.6 | 10.4 | 0.2 | 2.56 |
| 1932 | 1,522,800 | 27,535 | 12,875 | 14,660 | 18.0 | 8.4 | 9.6 | -1.8 | 2.38 |
| 1933 | 1,534,700 | 27,204 | 12,862 | 14,342 | 17.7 | 8.3 | 9.3 | -1.2 | 2.31 |
| 1934 | 1,547,100 | 27,220 | 13,810 | 13,410 | 17.5 | 8.9 | 8.6 | -1.3 | 2.29 |
| 1935 | 1,558,400 | 27,150 | 13,664 | 13,486 | 17.4 | 8.7 | 8.6 | -1.3 | 2.25 |
| 1936 | 1,569,700 | 28,395 | 14,658 | 13,737 | 18.0 | 9.3 | 8.7 | 0.8 | 2.30 |
| 1937 | 1,584,600 | 29,896 | 15,215 | 14,681 | 18.8 | 9.6 | 9.2 | 1.7 | 2.39 |
| 1938 | 1,601,800 | 30,845 | 16,874 | 13,971 | 19.2 | 10.5 | 8.7 | 1.6 | 2.44 |
| 1939 | 1,618,300 | 32,872 | 15,933 | 16,939 | 20.2 | 9.8 | 10.4 | 4.0 | 2.56 |
| 1940 | 1,641,600 | 36,945 | 15,875 | 21,070 | 22.6 | 9.7 | 12.9 | -17.8 | 2.84 |
| 1941 | 1,633,600 | 39,170 | 17,047 | 22,123 | 24.0 | 10.4 | 13.6 | -15.1 | 2.93 |
| 1942 | 1,631,200 | 37,818 | 18,117 | 19,701 | 23.1 | 11.1 | 12.1 | -8.9 | 2.87 |
| 1943 | 1,636,400 | 34,684 | 17,122 | 17,562 | 21.2 | 10.4 | 10.7 | -7.3 | 2.61 |
| 1944 | 1,642,000 | 38,037 | 17,049 | 20,988 | 22.9 | 10.3 | 12.7 | 8.2 | 2.85 |
| 1945 | 1,676,300 | 41,534 | 17,686 | 23,848 | 24.4 | 10.4 | 14.0 | 16.7 | 3.10 |
| 1946 | 1,727,800 | 47,524 | 17,720 | 29,804 | 27.1 | 10.1 | 17.0 | 13.9 | 3.45 |
| 1947 | 1,781,200 | 49,698 | 17,442 | 32,256 | 27.6 | 9.7 | 17.9 | 2.5 | 3.63 |
| 1948 | 1,817,500 | 49,062 | 17,285 | 31,777 | 26.7 | 9.4 | 17.3 | 2.7 | 3.57 |
| 1949 | 1,853,900 | 48,841 | 17,578 | 31,263 | 26.1 | 9.4 | 16.7 | 3.9 | 3.53 |
| 1950 | 1,892,100 | 49,331 | 18,084 | 31,247 | 25.8 | 9.5 | 16.4 | 2.4 | 3.55 |
| 1951 | 1,927,700 | 49,806 | 18,836 | 30,970 | 25.6 | 9.7 | 15.9 | 6.3 | 3.60 |
| 1952 | 1,970,500 | 51,846 | 18,896 | 32,950 | 26.0 | 9.5 | 16.5 | 11.0 | 3.67 |
| 1953 | 2,024,600 | 51,888 | 18,354 | 33,534 | 25.3 | 9.0 | 16.4 | 8.3 | 3.65 |
| 1954 | 2,074,700 | 54,055 | 18,876 | 35,179 | 25.8 | 9.0 | 16.8 | 4.3 | 3.78 |
| 1955 | 2,118,400 | 55,596 | 19,225 | 36,371 | 26.0 | 9.0 | 17.0 | 4.9 | 3.88 |
| 1956 | 2,164,800 | 56,531 | 19,696 | 36,835 | 25.8 | 9.0 | 16.8 | 3.7 | 3.98 |
| 1957 | 2,209,200 | 58,425 | 20,862 | 37,563 | 26.1 | 9.3 | 16.8 | 7.5 | 4.03 |
| 1958 | 2,262,800 | 60,556 | 20,301 | 40,255 | 26.5 | 8.9 | 17.6 | 5.9 | 4.11 |
| 1959 | 2,316,000 | 61,798 | 21,128 | 40,670 | 26.4 | 9.0 | 17.4 | 1.5 | 4.18 |
| 1960 | 2,359,700 | 62,779 | 20,892 | 41,887 | 26.4 | 8.8 | 17.6 | 1.0 | 4.24 |
| 1961 | 2,403,600 | 65,390 | 21,782 | 43,608 | 26.9 | 9.0 | 17.9 | 6.1 | 4.31 |
| 1962 | 2,461,300 | 65,014 | 22,081 | 42,933 | 26.1 | 8.9 | 17.3 | 4.8 | 4.19 |
| 1963 | 2,515,800 | 64,527 | 22,416 | 42,111 | 25.4 | 8.8 | 16.6 | 3.7 | 4.05 |
| 1964 | 2,566,900 | 62,302 | 22,861 | 39,441 | 24.0 | 8.8 | 15.2 | 4.3 | 3.80 |
| 1965 | 2,617,000 | 60,047 | 22,976 | 37,071 | 22.7 | 8.7 | 14.0 | 3.9 | 3.54 |
| 1966 | 2,663,800 | 60,003 | 23,778 | 36,225 | 22.3 | 8.8 | 13.5 | 4,3 | 3.41 |
| 1967 | 2,711,300 | 61,022 | 23,007 | 38,015 | 22.4 | 8.4 | 13.9 | -1.5 | 3.35 |
| 1968 | 2,745,000 | 62,112 | 24,464 | 37,648 | 22.5 | 8.9 | 13.6 | -3.4 | 3.34 |
| 1969 | 2,773,000 | 62,360 | 24,161 | 38,199 | 22.4 | 8.7 | 13.7 | -2.5 | 3.28 |
| 1970 | 2,804,000 | 62,050 | 24,840 | 37,210 | 21.9 | 8.8 | 13.2 | 4.0 | 3.17 |
| 1971 | 2,852,100 | 64,460 | 24,309 | 40,151 | 22.4 | 8.5 | 14.0 | 2.3 | 3.18 |
| 1972 | 2,898,500 | 63,215 | 24,801 | 38,414 | 21.6 | 8.5 | 13.1 | 8.0 | 3.00 |
| 1973 | 2,959,700 | 60,727 | 25,312 | 35,415 | 20.3 | 8.5 | 11.8 | 10.2 | 2.76 |
| 1974 | 3,024,900 | 59,336 | 25,261 | 34,075 | 19.4 | 8.3 | 11.1 | 11.0 | 2.58 |
| 1975 | 3,091,900 | 56,639 | 25,114 | 31,525 | 18.2 | 8.1 | 10.1 | 6.7 | 2.37 |
| 1976 | 3,143,700 | 55,105 | 25,457 | 29,648 | 17.5 | 8.1 | 9.4 | -3.1 | 2.27 |
| 1977 | 3,163,400 | 54,179 | 25,961 | 28,218 | 17.1 | 8.2 | 8.9 | -8.0 | 2.21 |
| 1978 | 3,166,400 | 51,029 | 24,669 | 26,360 | 16.1 | 7.8 | 8.3 | -8.7 | 2.07 |
| 1979 | 3,165,200 | 52,279 | 25,340 | 26,939 | 16.5 | 8.0 | 8.5 | -8.9 | 2.12 |
| 1980 | 3,163,900 | 50,542 | 26,676 | 23,866 | 15.9 | 8.4 | 7.5 | -3.5 | 2.03 |
| 1981 | 3,176,400 | 50,794 | 25,150 | 25,644 | 15.9 | 7.9 | 8.1 | -2.4 | 2.01 |
| 1982 | 3,194,500 | 49,938 | 25,532 | 24,406 | 15.6 | 8.0 | 7.6 | 2.5 | 1.95 |
| 1983 | 3,226,800 | 50,474 | 25,991 | 24,483 | 15.6 | 8.0 | 7.5 | 4.3 | 1.92 |
| 1984 | 3,264,800 | 51,636 | 25,378 | 26,258 | 15.7 | 7.7 | 8.0 | 0.6 | 1.93 |
| 1985 | 3,293,000 | 51,798 | 27,480 | 24,318 | 15.7 | 8.3 | 7.4 | -4.3 | 1.93 |
| 1986 | 3,303,100 | 52,824 | 27,045 | 25,779 | 16.0 | 8.2 | 7.8 | -4.7 | 1.96 |
| 1987 | 3,313,500 | 55,254 | 27,419 | 27,835 | 16.6 | 8.2 | 8.4 | 0.2 | 2.03 |
| 1988 | 3,342,100 | 57,546 | 27,408 | 30,138 | 17.2 | 8.2 | 9.0 | -8.1 | 2.10 |
| 1989 | 3,345,200 | 58,091 | 27,042 | 31,049 | 17.3 | 8.1 | 9.2 | -1.8 | 2.12 |
| 1990 | 3,369,800 | 60,153 | 26,531 | 33,622 | 17.7 | 7.8 | 9.9 | 2.18 | |
| 1991 | 3,516,000[43] | 59,911 | 26,389 | 33,522 | 17.3 | 7.6 | 9.7 | 2.09 | |
| 1992 | 3,552,200 | 59,166 | 27,115 | 32,051 | 16.7 | 7.7 | 9.1 | 1.2 | 2.06 |
| 1993 | 3,597,800 | 58,782 | 27,100 | 31,682 | 16.4 | 7.6 | 8.9 | 3.9 | 2.04 |
| 1994 | 3,648,300 | 57,321 | 26,953 | 30,368 | 15.8 | 7.4 | 8.4 | 5.6 | 1.98 |
| 1995 | 3,706,700 | 57,671 | 27,813 | 29,858 | 15.7 | 7.6 | 8.1 | 7.9 | 1.98 |
| 1996 | 3,762,300 | 57,280 | 28,255 | 29,025 | 15.3 | 7.6 | 7.8 | 7.2 | 1.96 |
| 1997 | 3,802,700 | 57,604 | 27,471 | 30,133 | 15.2 | 7.3 | 8.0 | 2.7 | 1.96 |
| 1998 | 3,829,200 | 55,349 | 26,206 | 29,143 | 14.5 | 6.9 | 7.6 | -0.6 | 1.89 |
| 1999 | 3,851,100 | 57,053 | 28,122 | 28,931 | 14.9 | 7.3 | 7.5 | -1.8 | 1.97 |
| 2000 | 3,873,100 | 56,605 | 26,660 | 29,945 | 14.7 | 6.9 | 7.8 | -2.1 | 1.98 |
| 2001 | 3,916,200 | 55,800 | 27,825 | 27,972 | 14.36 | 7.16 | 7.20 | 3.9 | 1.97 |
| 2002 | 3,989,500 | 54,021 | 28,065 | 25,956 | 13.67 | 7.10 | 6.57 | 12.1 | 1.89 |
| 2003 | 4,061,600 | 56,136 | 28,011 | 28,125 | 13.94 | 6.95 | 6.99 | 11.1 | 1.93 |
| 2004 | 4,114,300 | 58,074 | 28,419 | 29,655 | 14.20 | 6.95 | 7.25 | 5.7 | 1.98 |
| 2005 | 4,161,000 | 57,744 | 27,033 | 30,711 | 13.96 | 6.54 | 7.42 | 3.9 | 1.97 |
| 2006 | 4,209,100 | 59,193 | 28,245 | 30,948 | 14.14 | 6.75 | 7.39 | 4.2 | 2.01 |
| 2007 | 4,245,700 | 64,044 | 28,521 | 35,520 | 15.15 | 6.75 | 8.40 | 0.3 | 2.18 |
| 2008 | 4,280,300 | 64,341 | 29,187 | 35,154 | 15.10 | 6.85 | 8.25 | -0.1 | 2.19 |
| 2009 | 4,332,100 | 62,541 | 28,965 | 33,579 | 14.53 | 6.73 | 7.80 | 4.3 | 2.13 |
| 2010 | 4,373,900 | 63,897 | 28,437 | 35,457 | 14.68 | 6.53 | 8.15 | 1.5 | 2.17 |
| 2011 | 4,399,400 | 61,404 | 30,081 | 31,320 | 14.00 | 6.86 | 7.14 | -1.3 | 2.09 |
| 2012 | 4,425,900 | 61,179 | 30,099 | 31,080 | 13.87 | 6.82 | 7.05 | -1.0 | 2.10 |
| 2013 | 4,477,400 | 58,719 | 29,568 | 29,148 | 13.20 | 6.65 | 6.55 | 5.1 | 2.01 |
| 2014 | 4,564,400 | 57,243 | 31,062 | 26,181 | 12.68 | 6.88 | 5.80 | 13.6 | 1.92 |
| 2015 | 4,663,700 | 61,038 | 31,608 | 29,430 | 13.27 | 6.87 | 6.40 | 15.4 | 1.99 |
| 2016 | 4,767,600 | 59,430 | 31,179 | 28,251 | 12.65 | 6.64 | 6.01 | 16.3 | 1.87 |
| 2017 | 4,858,500 | 59,610 | 33,339 | 26,271 | 12.43 | 6.95 | 5.48 | 13.6 | 1.81 |
| 2018 | 4,941,200 | 58,020 | 33,222 | 24,798 | 11.76 | 6.73 | 5.03 | 12.0 | 1.71 |
| 2019 | 5,040,400 | 59,637 | 34,260 | 25,377 | 12.13 | 6.97 | 5.16 | 14.9 | 1.75 |
| 2020 | 5,103,700 | 57,573 | 32,613 | 24,960 | 11.33 | 6.40 | 4.93 | 7.6 | 1.61 |
| 2021 | 5,116,500 | 58,659 | 34,932 | 23,727 | 11.44 | 6.81 | 4.63 | -2.1 | 1.64 |
| 2022 | 5,157,100 | 58,887 | 38,574 | 20,313 | 11.43 | 7.49 | 3.94 | 4.0 | 1.66 |
| 2023 | 5,305,600 | 56,955 | 37,884 | 19,071 | 11.04 | 7.35 | 3.70 | 28.8 | 1.56 |
| 2024 | 5,356,700 | 58,341 | 37,722 | 20,619 | 10.94 | 7.07 | 1.56 |
Current vital statistics
edit| Period | Live births | Deaths | Natural increase |
|---|---|---|---|
| January - September 2023 | 42,945 | 28,464 | +14,481 |
| January - September 2024 | 44,034 | 28,521 | +15,513 |
| Difference |
Graphs are unavailable due to technical issues. Updates on reimplementing the Graph extension, which will be known as the Chart extension, can be found onPhabricatorand onMediaWiki.org. |

Total fertility rates by region
editImmigration
edit
| Country | Number | % |
|---|---|---|
| 3,370,122 | 72.60 | |
| 210,915 | 4.54 | |
| 132,906 | 2.86 | |
| 117,348 | 2.53 | |
| 75,696 | 1.63 | |
| 71,382 | 1.54 | |
| 67,632 | 1.46 | |
| 62,310 | 1.34 | |
| 55,512 | 1.20 | |
| 30,975 | 0.67 | |
| 27,678 | 0.60 | |
| 26,856 | 0.58 | |
| 26,136 | 0.56 | |
| 19,860 | 0.43 | |
| 19,329 | 0.42 | |
| 16,605 | 0.36 | |
| 14,601 | 0.31 | |
| 14,349 | 0.31 | |
| 13,107 | 0.28 | |
| 11,928 | 0.26 | |
| 11,925 | 0.26 | |
| 10,992 | 0.24 | |
| 10,494 | 0.23 | |
| 10,440 | 0.22 | |
| 10,251 | 0.22 | |
| Other countries | 202,548 | 4.36 |
East Polynesians were the first people to reach New Zealand about 1280, followed by the early European explorers, notablyJames Cookin 1769 who explored New Zealand three times and mapped the coastline. Following the Treaty of Waitangi in 1840 when the country became a British colony, immigrants were predominantly from Britain, Ireland and Australia. Due to restrictive policies, limitations were placed on non-European immigrants.[46]During thegold rushperiod (1858–1880s) large number of young men came from California andVictoriato New Zealand goldfields. Apart from British, there were Irish, Germans, Scandinavians, Italians and many Chinese. The Chinese were sent special invitations by the Otago Chamber of Commerce in 1866. By 1873 they made up 40 percent of the diggers in Otago and 25 percent of the diggers in Westland.[47]From 1900 there was also significant Dutch,Dalmatian,[48]and Italian immigration together with indirect European immigration through Australia, North America, South America and South Africa.[49]FollowingWorld War II,policies were relaxed and migrant diversity increased. In 2008–09, a target of 45,000 migrants was set by the New Zealand Immigration Service (plus a 5,000 tolerance).[50]
At the2018 census,27.4 percent of people counted were not born in New Zealand, up from 25.2 percent in 2013. In 2018, over half (50.7 percent) of New Zealand's overseas-born population lived in the Auckland Region, including 70 percent of the country's Pacific Island-born population, 61.5 percent of its Asian-born population, and 52 percent of its Middle Eastern and African- born population.[51]In the late 2000s, Asia overtook the British Isles as the largest source of overseas migrants; in 2013 around 32 percent of overseas-born New Zealand residents were born in Asia (mainly China, India, the Philippines and South Korea) compared to 26 percent born in the UK and Ireland.[52]The number of fee-payinginternational studentsincreased sharply in the late 1990s, with more than 20,000 studying in publictertiary institutionsin 2002.[53]
To be eligible for entry under theskilled migrant planapplicants are assessed by an approved doctor for good health, provide apolice certificateto prove good character and speak sufficient English. Migrants working in some occupations (mainly health) must be registered with the appropriate profession body before they can work within that area.[54]Skilled migrants are assessed byImmigration New Zealandand applicants that they believe will contribute are issued with a residential visa, while those with potential are issued with a work to resident visa.[55]Under the work to residency process applicants are given a temporary work permit for two years and are then eligible to apply for residency.[56]Applicants with a job offer from an accredited New Zealand employer, cultural or sporting talent, looking for work where there has been a long-term skill shortage or to establish a business can apply for work to residency.[56][57]
While most New Zealanders live in New Zealand, there is also a significantdiasporaabroad, estimated as of 2001 at over 460,000 or 14 percent of the international total of New Zealand-born. Of these, 360,000, over three-quarters of the New Zealand-born population residing outside of New Zealand, live in Australia. Other communities of New Zealanders abroad are concentrated in other English-speaking countries, specifically the United Kingdom, the United States and Canada, with smaller numbers located elsewhere.[58]Nearly one quarter of New Zealand's highly skilled workers live overseas, mostly in Australia and Britain, more than any other developed nation.[59]However many educated professionals from Europe and lesser developed countries have recently migrated to New Zealand.[60][61]A common pathway for New Zealanders to move to the UK is through a job offer via the Tier 2 (General) visa, which grants a 3-year initial stay in the country and can later be extended with three more years. After 5 years the person can apply for permanent residency. Another popular option is the UK Working Holiday visa, also known as "Youth Mobility Scheme" (YMS), which grants New Zealanders 2-year rights to live and work in the UK.[62]
Migration data of New Zealand, 2001–present
edit| Year | Migrant Arrivals | Migrant Departures | Net Migration |
|---|---|---|---|
| 2001 | 114,597 | 84,332 | 30,265 |
| 2002 | 134,046 | 73,255 | 60,791 |
| 2003 | 120,591 | 79,175 | 41,416 |
| 2004 | 103,496 | 89,356 | 14,140 |
| 2005 | 103,982 | 92,716 | 11,266 |
| 2006 | 110,687 | 93,974 | 16,713 |
| 2007 | 113,450 | 102,413 | 11,037 |
| 2008 | 119,994 | 107,723 | 12,271 |
| 2009 | 108,265 | 89,996 | 18,269 |
| 2010 | 100,499 | 100,776 | -277 |
| 2011 | 100,206 | 116,350 | -16,144 |
| 2012 | 101,762 | 112,170 | -10,408 |
| 2013 | 110,282 | 92,991 | 17,291 |
| 2014 | 128,180 | 80,767 | 47,413 |
| 2015 | 140,125 | 80,316 | 59,809 |
| 2016 | 143,124 | 80,235 | 62,889 |
| 2017 | 140,102 | 86,822 | 53,280 |
| 2018 | 139,014 | 89,447 | 49,567 |
| 2019 | 165,742 | 93,154 | 72,588 |
| 2020 | 91,444 | 54,600 | 36,844 |
| 2021 | 55,459 | 70,409 | -14,950 |
| 2022 | 119,440 | 94,539 | 24,901 |
| 2023 | 244,763 | 110,319 | 134,445 |
Ethnicity
edit
New Zealand is amultiethnic society,and home to people of many different national origins. Originally composed solely of theMāoriwho arrived in the thirteenth century, theethnicmakeup of the population later became dominated byNew Zealanders of European descent.[65]In the nineteenth century, European settlers brought diseases for which the Māori had no immunity. By the 1890s, the Māori population was approximately 40 percent of its size pre-contact.[65]The Māori population increased during the twentieth century,[66]though it remains a minority. The1961 New Zealand censusrecorded that the population was 92 percent European and 7 percent Māori, withAsianandPasifikaminorities sharing the remaining 1 percent.[67]
At the census in 2018, 70.2 percent identified as European, 16.5 percent as Māori, 15.1 percent as Asian, 8.1 percent as Pasifika, and 1.2 percent asMiddle-Eastern,Latin American,andAfrican(MELAA).[n 1][7]Most New Zealanders are of English,[68]Scottish,[69]and Irish ancestry,[70]with smaller percentages of other European ancestries, such as Dutch, Dalmatian, French, German and Scandinavian.[71]Auckland was the most diverse region with 53.5 percent identifying as European, 28.2 percent as Asian, 11.5 percent as Māori, 15.5 percent as Pasifika and 1.1 percent as MELAA.[7]According toMassey UniversitysociologistPaul Spoonley,ethnic intermarriage has consistently been very common in New Zealand since colonisation. Unlike the United States, New Zealand has never prohibited interracial marriages; they have in fact been historically encouraged by many.[10]In 2015, more than half of Maori, or 53.5 per cent, and almost four in 10, or 37.2 per cent of Pasifika, identified with two or more ethnic groups. At current rates of population growth, Asians, Pasifika and Māori will outnumber Europeans in Auckland within the next decade.[8]
All major ethnic groups except European increased when compared with the 2013 census, in which 74 percent identified as European, 14.6 percent as Māori, 11.8 percent as Asian, and 7.4 percent of Pasifika origin.[64]Heightened immigration from Asia and the Pacific,[52]and higher fertility rates amongst Māori and Pasifika,[72]have resulted in the population of Māori, Asian and Pasifika descent growing at a higher rate than those of European descent.[73]Moreover, non-European ethnic groups make up a greater proportion of younger people, whereas European ethnic groups make up a large proportion of older people due to historic immigration trends and lowerlife expectancyin Māori and Pasifika ethnic groups.[74]For instance, in 2013, the population aged under 15 years was 67 percent European, 27 percent Māori, 14 percent Pacific, 16 percent Asian, and 2 percent MELAA, while the population aged 65 years and older consisted of 86 percent European, 7 percent Māori, 6 percent Asian and 3 percent Pacific.[75]
There was significant public discussion about usage of the term "New Zealander" during the months leading up to the2006 census.[76]The number of people identifying with this term increased from approximately 80,000 (2.4 percent) in 2001 to just under 430,000 people (11.1 percent) in 2006.[77]The European grouping significantly decreased from 80.0 percent of the population in 2001 to 67.6 percent in 2006, however, this is broadly proportional to the large increase in "New Zealanders".[77]The number of people identifying as a "New Zealander" dropped back to under 66,000 in 2013,[77]and further declined to about 45,300 in 2018.[7]
Statistics New Zealand has not released official statistical counts of Māoriiwi(tribes) from the 2018 census due to a low response rate.[78]As last recorded in the 2013 census, the largestiwiisNgāpuhiwith 125,601 people (or 18.8 percent of people of Māori descent).[36]Between 2006 and 2013 the number of people of Māori descent stating Ngāpuhi as theiriwiincreased by 3,390 people (2.8 percent). The second-largest wasNgāti Porou,with 71,049 people (down 1.2 percent from 2006).Ngāi Tahuwas the largest in the South Island and the third-largest overall, with a count of 54,819 people (an increase of 11.4 percent from 2006). A total of 110,928 people (or 18.5 percent) of Māori descent did not know theiriwi(an increase of 8.4 percent compared with 2006).[36]A group of Māori migrated toRēkohu,now known as theChatham Islands,where they developed their distinctMorioriculture.[79][80]The Moriori population was decimated, first, by disease brought by European sealers and whalers and, second, byTaranakiMāori, with only 101 surviving in 1862 and the last known full-blooded Moriori dying in 1933.[80]The number of people identifying as having Moriori descents increased from 105 in 1991 to 945 in 2006,[81]but decreased to 738 in 2013.[82]
| Ethnicity | 2001 census | 2006 census | 2013 census | 2018 census | 2023 census | |||||
|---|---|---|---|---|---|---|---|---|---|---|
| Number | % | Number | % | Number | % | Number | % | Number | % | |
| European | 2,871,432 | 80.1 | 2,609,589 | 67.6 | 2,969,391 | 74.0 | 3,297,864 | 70.2 | 3,383,742 | 67.8 |
| New Zealand European | 2,696,724 | 75.2 | 2,381,076 | 61.7 | 2,727,009 | 68.0 | 3,013,440 | 64.1 | ||
| British & Irish | 100,668 | 2.6 | 105,765 | 2.6 | 121,986 | 2.6 | ||||
| South African European | 14,913 | 0.4 | 21,609 | 0.6 | 28,656 | 0.7 | 37,155 | 0.8 | ||
| European (not further defined) | 23,598 | 0.7 | 21,855 | 0.6 | 26,472 | 0.7 | 34,632 | 0.7 | ||
| Dutch | 27,507 | 0.8 | 28,644 | 0.7 | 28,503 | 0.7 | 29,820 | 0.6 | ||
| Australian | 20,784 | 0.6 | 26,355 | 0.7 | 22,467 | 0.6 | 29,349 | 0.6 | ||
| Māori | 526,281 | 14.7 | 565,329 | 14.6 | 598,605 | 14.9 | 775,836 | 16.5 | 887,493 | 17.8 |
| Asian | 238,179 | 6.6 | 354,552 | 9.2 | 471,708 | 11.8 | 707,598 | 15.1 | 861,576 | 17.3 |
| Chinese | 100,680 | 2.8 | 139,731 | 3.6 | 163,101 | 4.1 | 247,770 | 5.3 | ||
| Indian | 60,213 | 1.7 | 97,443 | 2.5 | 143,520 | 3.6 | 239,193 | 5.1 | ||
| Southeast Asian | 43,962 | 1.1 | 77,733 | 1.9 | 124,932 | 2.7 | ||||
| Other Asian | 59,739 | 1.5 | 68,004 | 1.7 | 90,627 | 1.9 | ||||
| Pasifikas | 231,798 | 6.5 | 265,974 | 6.9 | 295,941 | 7.4 | 381,642 | 8.1 | 442,632 | 8.9 |
| Samoan | 115,017 | 3.2 | 131,103 | 3.4 | 144,138 | 3.6 | 182,721 | 3.9 | ||
| Tongan | 40,716 | 1.1 | 50,481 | 1.3 | 60,333 | 1.5 | 82,389 | 1.8 | ||
| Cook Islands Māori | 51,486 | 1.4 | 56,895 | 1.5 | 61,077 | 1.5 | 80,532 | 1.7 | ||
| Niuean | 20,148 | 0.6 | 22,476 | 0.6 | 23,883 | 0.6 | 30,867 | 0.7 | ||
| Middle Eastern/Latin American/African | 24,084 | 0.7 | 34,743 | 0.9 | 46,953 | 1.2 | 70,332 | 1.5 | 92,760 | 1.9 |
| Other | 801 | <0.1 | 430,881 | 11.2 | 67,752 | 1.7 | 58,053 | 1.2 | ||
| New Zealander | — | 429,429 | 11.1 | 65,973 | 1.6 | 45,330 | 1.0 | |||
| Total people stated | 3,586,644 | 3,860,163 | 4,011,399 | 4,699,755 | ||||||
| Not elsewhere included | 150,702 | 4.0 | 167,784 | 4.2 | 230,646 | 5.4 | ||||
The maps below (taken from 2013 census data[64]) show the percentages of people in each census area unit identifying themselves as European, Māori, Asian, or Pacific Islander (as defined by Statistics New Zealand). As people could identify themselves with multiple groups, percentages are not cumulative.
-
 Europeanfrom 2006 to 2018
 -
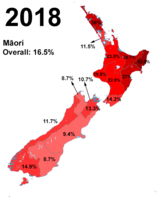 Māoriin 2018
 -
 Asianin 2018
 -
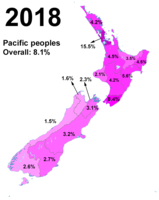 Pasifikasin 2018


Language
editEnglish has long been entrenched as ade factonational language due to its widespread use.[83]In the2018 census,95.4 percent of respondents spoke English,[4]down from 96.1 percent in 2013.[5]TheNew Zealand English dialectis mostlynon-rhoticwith an exception being the Southern Burr found principally inSouthlandand parts ofOtago.[84]It is similar toAustralian Englishand many speakers from the Northern Hemisphere are unable to tell theaccentsapart.[85]In New Zealand English the shorti(as in kit) has becomecentralised,leading to the phrasefish and chipssounding like "fush and chups" to the Australian ear.[86]The wordsrarelyandreally,reelandreal,dollanddole,pullandpool,witchandwhich,andfullandfillcan sometimes be pronounced ashomophones.[87][88][84]Some New Zealanders pronounce thepast participlesgrown,thrownandmownusing twosyllables,whereasgroan,throneandmoanare pronounced as one syllable.[89]New Zealanders often reply to a question or emphasise a point by adding arising intonationat the end of the sentence.[90]

Initially, theMāori language(te reo Māori) was permitted innative schoolsto facilitate English instruction, but as time went on official attitudes hardened against any use of the language. Māori were discouraged from speaking their own language in schools and work places and it existed as a community language only in a few remote areas.[91]The language underwenta revivalbeginning in the 1970s, and now more people speak Māori.[92][93]The future of the language was the subject of a claim before theWaitangi Tribunalin 1985. As a result, Māori was declared an official language in 1987.[94]In the 2013 census, 21.3 percent of Māori people—and 3.7 percent of all respondents, including some non-Māori people—reportedconversational fluencyin the language.[95][n 6]There are now Māori language immersion schools and twoMāori Televisionchannels, the only nationwide television channels to have the majority of their prime-time content delivered in Māori.[97]Many placeshave officially been given dual Māori and English names in recent years.
In the 2018 census, 22,987 people reported the ability to useNew Zealand Sign Language.[4]It was declared one of New Zealand's official languages in 2006.[98]
Samoanis the most widely spoken non-official language (2.2 percent), followed by "Northern Chinese" (includingMandarin;2.0 percent),Hindi(1.5 percent) andFrench(1.2 percent).[4]A considerable proportion of first- and second-generation migrants aremultilingual.[4]
Religion
edit| Religious affiliation in New Zealand (2018)[4] | ||
|---|---|---|
| Affiliation[n 7] | % of New Zealand population | |
| Religious | 44.93 | |
| Anglican | 6.70 | |
| Roman Catholic | 6.29 | |
| Presbyterian | 4.71 | |
| Other Christian[n 8] | 20.23 | |
| Hindu | 2.63 | |
| Muslim | 1.31 | |
| Buddhist | 1.12 | |
| Other religions | 2.83 | |
| Irreligious | 48.47 | |
| Object to answering | 6.66 | |
The predominant religion in New Zealand isChristianity.As recorded in the 2018 census, about 38 percent of the population identified themselves as Christians,[4]although regularchurch attendanceis estimated at 15 percent.[100]Another 48.5 percent indicated that they hadno religion[4](up from 41.9 percent in 2013 and 34.7 percent in 2006[101]) and around 7.5 percent affiliated with other religions.[4]
Theindigenous religionof the Māori population wasanimistic,but with the arrival ofmissionariesfrom the early nineteenth century most of the Māori populationconvertedto Christianity.[102]In the 2018 census, 3,699 Māori identify themselves as adhering to "Māori religions, beliefs and philosophies".[4]
In the 2018 census, the largest reported Christian affiliations areAnglican(6.7 percent of the population),Roman Catholic(6.3 percent),Presbyterian(4.7 percent). There are also significant numbers of Christians who identify themselves withMethodist,Pentecostal,BaptistandLatter-day Saintchurches, and the New Zealand-basedRātanachurch has adherents among Māori.[4]Immigration and associated demographic change in recent decades has contributed to the growth of minority religions,[103]especiallyHinduism,BuddhismandIslam.[104][105]
Other subjects
editEducation
editEducation follows the three-tier model, which includes primary schools, followed by secondary schools (high schools) and tertiary education at universities orpolytechnics.TheProgramme for International Student Assessmentranked New Zealand's education as the seventh highest in 2009.[106]TheEducation Index,published with the UN's 2014Human Development Indexand based on data from 2013, listed New Zealand at 0.917, ranked second after Australia.[107]
In July 2019[update]there were 476,240 primary students, 278,266 secondary students, and 58,340 students attending composite (combined primary and secondary) schools.[108]Primary and secondary schooling is compulsory for children aged 6 to 16[109]with most children starting at 5. Early leaving exemptions may be granted to 15-year-old students that have been experiencing some ongoing difficulties at school or are unlikely to benefit from continued attendance.[110]Parents and caregivers can home school their children if they obtain approval from the Ministry of Education and prove that their child will be taught "as regularly and as well as in a registered school".[111]There are 13 school years and attendingstate (public) schoolsis nominally free from an individual's fifth birthday until the end of the calendar year following their 19th birthday.[111][112]
The academic year in New Zealand varies between institutions, but generally runs from late January until mid-December for primary and secondary schools and polytechnics, and from late February until mid-November for universities. New Zealand has an adult literacy rate of 99 percent,[113]and over half of the population aged 15 to 29 hold a tertiary qualification.[109][n 9]In the adult population 14.2 percent have abachelor's degreeor higher, 30.4 percent have some form of secondary qualification as their highest qualification and 22.4 percent have no formal qualification.[114]
Income
editNew Zealand's early economy was based on sealing, whaling,flax,gold,kauri gum,and native timber.[115]During the 1880s agricultural products became the highest export earner and farming was a major occupation within New Zealand.[116]Farming is still a major employer, with 75 000 people indicating farming as their occupation during the 2006 census,[117]although dairy farming has recently taken over from sheep as the largest sector.[116]The largest occupation recorded during the 2018 census was sales assistant with 108,702 people, followed by office managers (65,907 people), chief executives or managing directors (54,480 people), and sales representatives not elsewhere included (51,747 people).[118]The largest industries of employment were cafes and restaurants (67,608 people), supermarkets and grocery stores (57,609 people), primary education (55,779 people), hospitals (52,887 people), and house construction (51,804 people).[118]Most people earn their income from wages or salaries (60.6 percent), with the other sources of income beingsuperannuation or pensions(17.3 percent), interest and investments (16.8 percent) and self-employment (14.8 percent).[118]
In 1982 New Zealand had the lowest per-capita income of all the developed nations surveyed bythe World Bank.[119]In 2010 the estimated gross domestic product (GDP) atpurchasing power parity(PPP) per capita was roughly US$28,250, between the thirty-first and fifty-first highest for all countries.[n 10]The median personal income in 2006 was $24,400. This was up from $15,600 in 1996, with the largest increases in the $50,000 to $70,000 bracket.[123]Men earn more than womenon average, with the median income for men in 2011 being $31,500, $12,400 more than women.[124]The highest median personal income were for people identifying with the European or "other" ethnic group, while the lowest was from the Asian ethnic group. The median income for people identifying as Māori was $20,900.[125]In 2013, the median personal income had risen slightly to $28,500.[126]
Unemployment peaked above 10 percent in 1991 and 1992,[127]before falling to a record low of 3.7 percent in 2007 (ranking third from twenty-seven comparable OECD nations).[128]Unemployment rose back to 7 percent in late 2009.[129]In the June 2017 quarter, unemployment had fallen to 4.8 percent. This was the lowest unemployment rate since December 2008, after the start of theGreat Recession,when it was 4.4%.[130]That census held in 2006 stated that 15% of New Zealanders did some form of voluntary work through any organisation, group or marae(men 14%, women 17%).[131]Home ownership has declined since 1991, from 73.8 percent to 66.9 percent in 2006.[132]
See also
edit- Demographics of Auckland
- Demographics of the Cook Islands,associated with New Zealand
- Health in New Zealand
- Homelessness in New Zealand
- Housing in New Zealand
- List of cities in New Zealand
- New Zealand census
- Social class in New Zealand
- Demographics of New Zealand Parliament (2014-2017)
- Demographics of New Zealand Parliament (2020-2023)
- Demographics of New Zealand Parliament (2023-2026)
Notes
edit- ^abWhen completing the census people could select more than one ethnic group. The proportions of people adding up to each ethnic group do not therefore add up to 100 percent.
- ^A person born on or after 1 January 2006 acquires New Zealand citizenship at birth only if at least one parent is a New Zealand citizen or permanent resident. People born on or before 31 December 2005 acquired citizenship at birth (jus soli).[20]
- ^By 2036 the number of people aged 65 and over is projected to increase by 77 percent over 2016. One in 4.5 will be aged 65 and over.[28]
- ^For 1921–2000, population in the table means population on 1 January on the year.
For 1991 onwards, population December 31. - ^In fertility rates, 2.1 and above is a stable population and have been marked blue, 2 and below leads to an ageing population with the result that the population reduces.
- ^In 2015, 55 percent of Māori adults (aged 15 years and over) reported some knowledge ofte reo Māori.Of these speakers, 64 percent use Māori at home and 50,000 can speak the language "very well" or "well".[96]
- ^This table includes all people who stated each religious affiliation, whether as their only religious affiliation or as one of several. Where a person reported more than one religious affiliation, they were counted in each applicable group.
- ^Including churches designated as "Māori Christian", such as theRātanachurch.[99]
- ^Tertiary education in New Zealanddescribes all aspects of post-school education and training. Its ranges from informal non-assessed community courses in schools through to undergraduate degrees and advanced, research-based postgraduate degrees.
- ^PPP GDP estimates from different organisations vary. TheInternational Monetary Fund's estimate is US$27,420, ranked 32.[120]The CIAWorld Factbookestimate is $28,000, ranked 51.[121]TheWorld Bank's estimate is US$29,352, ranked 31.[122]
References
edit- ^abcdefghi"National Population Estimates: At 30 June 2016".Statistics New Zealand. 12 August 2016.Retrieved2 April2017.
- ^abc"Life expectancy".Statistics New Zealand. 2024.Retrieved2 March2024.
- ^"Census 2023 data: What the first results reveal".Radio New Zealand.29 May 2024.
- ^abcdefghijklmn"2018 Census totals by topic"(Microsoft Excelspreadsheet).Statistics New Zealand.Retrieved29 October2019.
- ^ab"2013 Census QuickStats about culture and identity – Languages spoken".Statistics New Zealand.Retrieved8 September2016.
- ^"National population estimates: At 31 March 2024 (2018-base)".Stats NZ.15 May 2024.Retrieved15 August2024.
- ^abcd"2018 Census population and dwelling counts | Stats NZ".stats.govt.nz.Retrieved24 September2019.
- ^abc"More Kiwis saying 'I do' to intermarriage".The New Zealand Herald.20 October 2015.Retrieved1 April2023.
- ^Matters of the Heart: A History of Interracial Marriage in New Zealand.
- ^ab"Intermarriage in colonial society – Te Ara Encyclopedia of New Zealand".
- ^"Research shows Maori at least 43 per cent pakeha".The New Zealand Herald.15 October 2006.Retrieved1 April2023.
- ^https:// researchgate.net/publication/268285485_Ethnic_Intermarriage_in_New_Zealand"One might argue that a Maori and Maori-European union is endogamous – that is within-group - mostly because of the historical New Zealand convention of seeing “half-castes” more as Maori than as European. Because of this complexity a clear definition of ethnic intermarriage is not offered. "
- ^"The New Zealand accent explained".stuff.co.nz.Retrieved12 March2024.
- ^"Labour market statistics (income): June 2022 quarter | Stats NZ".stats.govt.nz.Retrieved10 December2022.
- ^Dalby, Simon(September 1993). "The 'Kiwi disease': geopolitical discourse in Aotearoa/New Zealand and the South Pacific".Political Geography.12(5):437–456.doi:10.1016/0962-6298(93)90012-V.
- ^Callister, Paul (2004)."Seeking an Ethnic Identity: Is" New Zealander "a Valid Ethnic Category?"(PDF).New Zealand Population Review.30(1&2):5–22.
- ^Misa, Tapu (8 March 2006)."Ethnic Census status tells the whole truth".The New Zealand Herald.
- ^"Draft Report of a Review of the Official Ethnicity Statistical Standard: Proposals to Address the 'New Zealander' Response Issue".Statistics New Zealand. April 2009. Archived fromthe originalon 13 November 2009.Retrieved18 January2011.
- ^Ranford, Jodie."'Pākehā', Its Origin and Meaning ".Māori News.Retrieved20 February2008.
- ^"Check if you are a citizen".New Zealand Government.Retrieved26 November2021.
- ^"Am I a New Zealand Citizen?".New Zealand Department of Internal Affairs.Retrieved3 March2011.
- ^"Population clock".Statistics New Zealand.Retrieved14 April2016.The population estimate shown is automatically calculated daily at 00:00 UTC and is based on data obtained from the population clock on the date shown in the citation.
- ^"National population projections: 2016(base)–2068"(Press release). Statistics New Zealand. 18 October 2016.Retrieved20 October2018.
- ^"New Zealand population tops 5 million".Stuff.18 May 2020.Retrieved18 May2020.
- ^"New Zealand's population nears 5.1 million".stats.govt.nz.Retrieved24 September2020.
- ^ab"Births and Deaths: Year ended December 2010".Statistics New Zealand.Retrieved13 April2011.
- ^abDepartment of Economic and Social Affairs Population Division(2009)."World Population Prospects"(PDF).2008 revision. United Nations. Archived fromthe original(PDF)on 7 April 2009.Retrieved29 August2009.
- ^"Our ageing population - Super Seniors".New Zealand Ministry of Social Development.Retrieved19 July2020.
- ^"Sex ratios".Population Statistics Unit, Statistics New Zealand Statistics House. Archived fromthe originalon 6 April 2023.Retrieved12 April2012.
- ^"Sex Ratio".The World Factbook.CIA. Retrieved 13 April 2011.
- ^"UNSD — Demographic and Social Statistics".unstats.un.org.Retrieved10 May2023.
- ^"The Ageing of the New Zealand Population, 1881-2051 (WP 03/27)".treasury.govt.nz.September 2003.Retrieved28 October2022.
- ^"New Zealand - average age of the population 1950-2050".Statista.Retrieved28 October2022.
- ^"Interactive population pyramid for New Zealand | Stats NZ".stats.govt.nz.Retrieved28 October2022.
- ^abc"Aotearoa Data Explorer".Statistics New Zealand.Retrieved26 October2024.
- ^abc"2013 Census QuickStats about Māori".Statistics New Zealand. Archived fromthe originalon 6 April 2023.Retrieved19 August2017.
- ^"Appendix 2: Rural Area Population Statistics".Ministry of Economic Development.Retrieved12 April2011.
- ^McLintock, A. H.,ed. (2009) [1966]."Borough and City Status".An Encyclopaedia of New Zealand.Retrieved19 August2017.
- ^Davidson, Kate (28 July 2014)."Is Nelson really a city?".Stuff.Retrieved19 August2017.
- ^"Subnational population estimates at 30 June 2010 (boundaries at 1 November 2010)".Statistics New Zealand. 26 October 2010. Archived fromthe originalon 10 June 2011.Retrieved2 April2011.
- ^"Local Government Act 2002 No 84 (as at 01 July 2017), Public Act 16 Cities".New Zealand Parliamentary Counsel Office.Retrieved18 August2017.
- ^Data from 1921 to 2000 were taken from:"Developed Countries Demography".Institut national d'études démographiques.Archived fromthe originalon 19 July 2018.Retrieved5 August2018.
Population data from 2001 onwards were taken from:"Table: Estimated Resident Population (Mean Quarter Ended) by Sex (1991+) (Qrtly-Mar/Jun/Sep/Dec)".Stats NZ Tatauranga Aotearoa. 2018. Archived fromthe originalon 20 October 2022.Retrieved5 August2018.
Other data from 2001 onwards were taken from:"Births and deaths: Year ended December 2017".Stats NZ Tatauranga Aotearoa. 18 February 2018.Retrieved5 August2018. - ^stats New Zealand, Download historical population summary figures, visited Oktober 1 2023
- ^"Live births and deaths, New Zealand residents, overseas visitors and total registrations (Qrtly-Mar/Jun/Sep/Dec)".
- ^"2018 Census totals by topic – national highlights | Stats NZ".stats.govt.nz.Archived fromthe originalon 23 September 2019.Retrieved24 September2019.
- ^Socidad Peruana de Medicina Intensiva (SOPEMI) (2000).Trends in international migration: continuous reporting system on migration.Organisation for Economic Co-operation and Development.pp.276–278.
- ^Diggers, Hatters and Whores.p 197-198. Eldred-Grigg. Random House. 2011.
- ^Walrond, Carl (21 September 2007)."Dalmatians".Te Ara: The Encyclopedia of New Zealand.Retrieved30 April2010.
- ^"New Zealand Peoples".Te Ara: The Encyclopedia of New Zealand.Retrieved30 April2010.
- ^Hoadley, Stephen (2004)."Our immigration policy: rationality, stability, and politics: Stephen Hoadley discusses New Zealand's approach to the vexed question of immigration controls".New Zealand International Review.29(2): 14. Archived fromthe originalon 6 April 2023.Retrieved20 February2008.
- ^"Birthplace (detailed), for the census usually resident population count, 2006, 2013, and 2018 Censuses (RC, TA, SA2, DHB)".nzdotstat.stats.govt.nz.Retrieved12 December2021.
- ^ab"Birthplace and people born overseas".2013 Census QuickStats about culture and identity.Statistics New Zealand.Retrieved29 August2014.
- ^Butcher, Andrew; McGrath, Terry (2004)."International Students in New Zealand: Needs and Responses"(PDF).International Education Journal.5(4). Archived fromthe original(PDF)on 9 March 2012.Retrieved30 April2011.
- ^"Requirements for the Skilled Migrant Category".Immigration New Zealand.Retrieved22 April2011.
- ^"Overview of the Skilled Migrant Category".Immigration New Zealand.Retrieved30 April2011.
- ^ab"New Zealand Work to Residence Visa".New Zealand Visa Bureau. Archived fromthe originalon 13 July 2011.Retrieved30 April2011.
- ^"Residence from Work – quick check".Immigration New Zealand.Retrieved25 May2011.
- ^John Bryant and David Law (September 2004)."New Zealand's Diaspora and Overseas-born Population: The diaspora".New Zealand Treasury.Archived fromthe originalon 24 July 2011.Retrieved10 August2010.
- ^Collins, Simon (March 2005)."Quarter of NZ's brightest are gone".The New Zealand Herald.
- ^Winkelmann, Rainer (2000). "The labour market performance of European immigrants in New Zealand in the 1980s and 1990s".The International Migration Review.33(1):33–58.doi:10.2307/2676011.JSTOR2676011.Journal subscription required
- ^Bain 2006,p. 44.
- ^"UK visa options for New Zealand citizens".Visa First Migration Agency. Archived fromthe originalon 17 April 2016.Retrieved4 April2016.
- ^"International migration: March 2024".Statistics New Zealand.Retrieved31 May2024.
- ^abc"Ethnicity (detailed single and combination), age, and gender for the census usually resident population count, (RC, TALB, SA2, Health), 2013, 2018, and 2023 Censuses".Statistics New Zealand.Retrieved4 October2024.
- ^abPool, Ian(July 2012)."Death rates and life expectancy - Effects of colonisation on Māori".Te Ara: The Encyclopedia of New Zealand.Retrieved12 July2013.
- ^Pool, Ian(5 May 2011)."Population change - Māori population change".Te Ara: The Encyclopedia of New Zealand.Retrieved21 August2017.
- ^Collins, Simon (October 2010)."Ethnic mix changing rapidly".The New Zealand Herald.
- ^Hearn, Terry (25 March 2015)."English".Te Ara: The Encyclopedia of New Zealand.Retrieved20 August2017.
- ^Wilson, John (25 March 2015)."Scots".Te Ara: The Encyclopedia of New Zealand.Retrieved20 August2017.
- ^Phillips, Jock (25 March 2017)."Irish".Te Ara: The Encyclopedia of New Zealand.Retrieved20 August2017.
- ^"History of immigration".Te Ara: The Encyclopedia of New Zealand.8 February 2005.Retrieved20 August2017.
- ^"Births and deaths: Year ended June 2021 | Stats NZ".stats.govt.nz.Retrieved10 December2022.
- ^Gillian Smeith and Kim Dunstan (June 2004)."Ethnic Population Projections: Issues and Trends".Statistics New Zealand.Retrieved10 August2010.
- ^"Growth in life expectancy slows | Stats NZ".stats.govt.nz.Retrieved10 December2022.
- ^"Ethnic group (detailed total response - level 3) by age and sex, for the census usually resident population count, 2006, 2013, and 2018 Censuses (RC, TA, SA2, DHB)".nzdotstat.stats.govt.nz.Retrieved10 December2022.
- ^Kukutai, Tahu;Didham, Robert."In Search of Ethnic New Zealanders: National Naming in the 2006 Census".Social Policy Journal of New Zealand.Retrieved19 August2017.
- ^abc"2013 Census information by variable".Statistics New Zealand.Retrieved19 August2017.
- ^"2018 Census – real data about real people".Statistics New Zealand.Retrieved22 July2020.
- ^Clark, Ross (1994). "Moriori and Māori: The Linguistic Evidence". In Sutton, Douglas (ed.).The Origins of the First New Zealanders.Auckland:Auckland University Press.pp.123–135.
- ^abDavis, Denise; Solomon, Māui (September 2007)."The impact of new arrivals".Te Ara: The Encyclopedia of New Zealand.Retrieved30 April2010.
- ^Denise Davis and Māui Solomon (4 March 2009)."Moriori – Facts and figures'".Te Ara: The Encyclopedia of New Zealand.Retrieved22 April2011.
- ^"Iwi individual profiles: Moriori".Statistics New Zealand. 2013.Retrieved19 August2017.
- ^Woolf, Amber-Leigh (20 August 2015)."Petition to make English an official language in New Zealand".Stuff.Retrieved17 August2017.
- ^abKortmann et al. 2004,p. 605.
- ^Hay, Maclagan & Gordon 2008,p. 14.
- ^Crystal 2003.
- ^Kortmann et al. 2004,p. 582, 589, 592, 610.
- ^Trudgill, Peterand Jean Hannah. (2002). International English: A Guide to the Varieties of Standard English, 4th ed. London: Arnold., p 24.
- ^Kortmann et al. 2004,p. 611.
- ^Crystal 2003,p. 355.
- ^Phillips, Jock (March 2009)."The New Zealanders – Bicultural New Zealand".Te Ara: The Encyclopedia of New Zealand.Retrieved21 January2011.
- ^"Māori Language Week – Te Wiki o Te Reo Māori".Ministry for Culture and Heritage.Retrieved1 February2008.
- ^Squires, Nick (May 2005)."British influence ebbs as New Zealand takes to talking Māori".The Telegraph.Great Britain.
- ^"Waitangi Tribunal claim – Māori Language Week".Ministry for Culture and Heritage. July 2010. Archived fromthe originalon 2 June 2023.Retrieved19 January2011.
- ^"Māori language speakers".Statistics New Zealand. 2013.Retrieved2 September2017.
- ^"Ngā puna kōrero: Where Māori speak te reo – infographic".Statistics New Zealand.Retrieved8 September2016.
- ^"Māori Television Launches 100 percent Māori Language Channel".Māori Television. Archived fromthe originalon 11 May 2011.Retrieved30 April2010.
- ^New Zealand Sign Language Act 2006 No 18 (as at 30 June 2008), Public Act.New Zealand Parliamentary Counsel Office. Retrieved 29 November 2011.
- ^Table 28, 2013 Census Data – QuickStats About Culture and Identity – Tables.
- ^Opie, Stephen (June 2008).Bible Engagement in New Zealand: Survey of Attitudes and Behaviour(PDF).Bible Society of New Zealand. p. 4. Archived fromthe original(PDF)on 26 May 2010.Retrieved29 May2010.
- ^"QuickStats About Culture and Identity: Religious affiliation".Statistics New Zealand. Archived fromthe originalon 9 March 2013.Retrieved20 January2011.
- ^Wagstrom, Thor (2005). "Broken Tongues and Foreign Hearts". In Brock, Peggy (ed.).Indigenous Peoples and Religious Change.Boston: Brill Academic Publishers. pp. 71 and 73.ISBN978-90-04-13899-5.
- ^Morris, Paul (May 2011)."Diverse religions".Te Ara: The Encyclopedia of New Zealand.Retrieved20 April2017.
- ^"2006 Census Data – QuickStats About Culture and Identity – Tables".2006 Census.Statistics New Zealand. Archived fromthe original(XLS)on 10 June 2011.Retrieved30 April2010.In tables 28 (Religious Affiliation) and 19 (Languages Spoken by Ethnic Group)
- ^"Quick Stats About culture and Identity— 2006 Census"(PDF).Statistics New Zealand. Archived fromthe original(PDF)on 5 February 2011.Retrieved28 September2007.
- ^"Figure 1: Comparing countries' and Economies' performance"(PDF).Programme for International Student AssessmentOECD.
- ^"Human Development Reports - Education Index".UNDP. 2014. Archived fromthe originalon 4 January 2018.Retrieved19 August2017.
- ^"Students enrolled in New Zealand schools".Figure.NZ.July 2019.Retrieved19 July2020.
- ^abDench, Olivia (July 2010)."Education Statistics of New Zealand: 2009".Education Counts.Retrieved19 January2011.
- ^"Early leaving exemptions".Ministry of Education. Archived fromthe originalon 12 October 2010.Retrieved6 May2011.
- ^ab"Types of school".Ministry of Education website. Archived fromthe originalon 21 January 2015.Retrieved25 May2011.
- ^"Fees".Ministry of Education. Archived fromthe originalon 6 April 2023.Retrieved25 May2011.
- ^"The World Factbook – New Zealand".CIA.15 November 2007.Retrieved30 November2007.
- ^"Educational attainment of the population".Education Counts. 2006. Archived fromthe original(xls)on 15 October 2008.Retrieved21 February2008.
- ^McLintock, A. H., ed. (2009) [1966]."Historical evolution and trade patterns".An Encyclopaedia of New Zealand.Retrieved10 February2011.
- ^abStringleman, Hugh; Peden, Robert (October 2009)."Sheep farming – Importance of the sheep industry".Te Ara: The Encyclopedia of New Zealand.Retrieved9 May2011.
- ^"Occupation for the Employed Census Usually Resident Population Count".Statistics New Zealand. Archived fromthe original(xml)on 12 January 2012.Retrieved9 May2011.
- ^abc"2018 Census totals by topic – national highlights (updated) | Stats NZ".stats.govt.nz.Retrieved6 January2022.
- ^Evans, N. "Up From Down Under: After a Century of Socialism, Australia and New Zealand are Cutting Back Government and Freeing Their Economies".National Review.46(16):47–51.
- ^"Report for Selected Countries and Subjects".International Monetary Fund.October 2010.Retrieved30 January2011.
- ^"GDP – per capita (PPP)".The World Factbook,Central Intelligence Agency.Archived fromthe originalon 24 April 2013.Retrieved22 January2011.
- ^"GDP per capita (current US$)".World Bank.Retrieved22 January2011.
- ^"QuickStats About Incomes: Personal Income".New Zealand Statistics. Archived fromthe originalon 25 May 2010.Retrieved9 May2011.
- ^"QuickStats About Incomes: Personal Income by Sex".New Zealand Statistics. Archived fromthe originalon 6 March 2011.Retrieved9 May2011.
- ^"QuickStats About Incomes: Personal income by ethnic group".New Zealand Statistics. Archived fromthe originalon 6 March 2011.Retrieved9 May2011.
- ^"Total Personal Income".Statistics New Zealand. 9 September 2014. Archived fromthe originalon 25 April 2017.Retrieved14 January2017.
- ^"Unemployment".2010 Social report.Retrieved4 February2011.
- ^"Unemployment: the Social Report 2016 – Te pūrongo ōranga tangata".Ministry of Social Development.Retrieved18 August2017.
- ^Bascand, Geoff (February 2011)."Household Labour Force Survey: December 2010 quarter – Media Release".Statistics New Zealand. Archived fromthe originalon 29 April 2011.Retrieved4 February2011.
- ^"Labour Market Statistics: June 2017 quarter".Statistics New Zealand. 2 August 2017.Retrieved17 August2017.
- ^"QuickStats About Unpaid Work".New Zealand Statistics. Archived fromthe originalon 13 November 2010.Retrieved9 May2011.
- ^"QuickStats About Housing: Dwelling ownership".New Zealand Statistics. Archived fromthe originalon 19 November 2011.Retrieved9 May2011.
Bibliography
edit- Bell, Daphne, ed. (2005).New to New Zealand: a guide to ethnic groups in New Zealand(3rd ed.). Reed Books.ISBN978-0-790-00998-8.
- Bain, Carolyn (2006).New Zealand.Lonely Planet.ISBN978-1-74104-535-2.
- Crystal, David(2003).The Cambridge Encyclopedia of the English Language(2nd ed.). Cambridge University Press.ISBN978-0-521-53033-0.
- Hay, Jennifer; Maclagan, Margaret; Gordon, Elizabeth (2008).Dialects of English: New Zealand English.Edinburgh University Press.ISBN978-0-7486-2529-1.
- Kortmann, Bernd; Schneider, Edgar;Burridge, Kate;Mesthrie, Rajend;Upton, Clive(2004).A handbook of varieties of English.Berlin:Mouton de Gruyter.ISBN978-3-11-017532-5.
- 2013 Census QuickStats,Statistics New Zealand,2013,ISBN978-0-478-40864-5
External links
edit- New Zealand's population clockArchived21 February 2020 at theWayback Machine
![]() This article incorporatespublic domain materialfromThe World Factbook.CIA.
This article incorporatespublic domain materialfromThe World Factbook.CIA.