From Wikipedia, the free encyclopedia
1874 German federal election|
|
|
| Registered | 8,523,446 11.33% 11.33% |
|---|
| Turnout | 5,219,830 (61.24%)10.23pp |
|---|
|
|
First party
|
Second party
|
Third party
|
|
|

|

|
DFP
|
| Leader
|
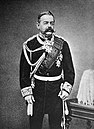
Rudolf von Bennigsen
|
Hermann von Mallinckrodt
|
|
| Party
|
NlP
|
Centre
|
DFP
|
| Leader since
|
1867
|
1870
|
|
| Last election
|
28.97%, 117 seats
|
18.21%, 58 seats
|
9.04%, 45 seats
|
| Seats won
|
147
|
91
|
48
|
| Seat change
|
30
|
33
|
3
|
| Popular vote
|
1,394,250
|
1,438,792
|
458,133
|
| Percentage
|
26.86%
|
27.72%
|
8.83%
|
| Swing
|
 2.11pp 2.11pp
|
9.51pp
|
0.21pp
|
|
|
|
Fourth party
|
Fifth party
|
Sixth party
|
|
|
|
Con
|
PPP
|
| Leader
|
Viktor I, Duke of Ratibor
|
|
|
| Party
|
DRP
|
Conservatives
|
Polish Party
|
| Last election
|
8.83%, 37 seats
|
13.51%, 56 seats
|
4.54%, 13 seats
|
| Seats won
|
32
|
21
|
14
|
| Seat change
|
5
|
35
|
1
|
| Popular vote
|
388,840
|
352,050
|
208,797
|
| Percentage
|
7.49%
|
6.78%
|
4.02%
|
| Swing
|
1.34pp
|
6.73pp
|
0.52pp
|
|
 Map of results (by constituencies) |
|
Federal electionswere held inGermanyon 10 January 1874.[1]TheNational Liberal Partyremained the largest party in theReichstag,with 147 of the 397 seats.[2]Voter turnout was 61.2%.[3]
Campaign[edit]
TheKulturkampfpolicies to suppress the political power ofCatholicism in Germanywere launched in 1873. However, theCatholic Centre Partysaw its support double from the previous election.
Results[edit]
|
|---|
| Party | Votes | % | +/– | Seats | +/– |
|---|
| Centre Party | 1,438,792 | 27.72 | +9.51 | 91 | +33 |
| National Liberal Party | 1,394,250 | 26.86 | −2.11 | 147 | +30 |
| German Progress Party | 458,133 | 8.83 | −0.21 | 48 | +3 |
| German Reich Party | 388,840 | 7.49 | −1.34 | 32 | −5 |
| Conservative Party | 352,050 | 6.78 | −6.73 | 21 | −35 |
| Alsace-Lorraine parties | 234,545 | 4.52 | New | 15 | New |
| Polish Party | 208,797 | 4.02 | −0.52 | 14 | +1 |
| General German Workers' Association | 179,250 | 3.45 | +2.01 | 3 | +3 |
| Social Democratic Workers' Party | 171,873 | 3.31 | +2.25 | 7 | +6 |
| Imperial Liberal Party | 98,072 | 1.89 | −5.16 | 8 | −25 |
| German-Hanoverian Party | 73,436 | 1.41 | −1.48 | 4 | −3 |
| Independent liberals | 69,905 | 1.35 | −0.58 | 4 | −1 |
| German People's Party | 39,110 | 0.75 | −0.01 | 1 | 0 |
| Independent conservatives | 21,546 | 0.42 | +0.04 | 1 | 0 |
| Danish Party | 19,856 | 0.38 | −0.16 | 1 | 0 |
| Schleswig-Holstein Particularist Liberals | 13,945 | 0.27 | +0.09 | 0 | −2 |
| Old Liberals | 8,937 | 0.17 | −0.47 | 0 | −2 |
| Others | 18,806 | 0.36 | +0.21 | 0 | 0 |
| Unknown | 111 | 0.00 | −0.02 | 0 | 0 |
| Total | 5,190,254 | 100.00 | – | 397 | +15 |
|
| Valid votes | 5,190,254 | 99.43 | |
|---|
| Invalid/blank votes | 29,576 | 0.57 | |
|---|
| Total votes | 5,219,830 | 100.00 | |
|---|
| Registered voters/turnout | 8,523,446 | 61.24 | |
|---|
| Source:Wahlen in Deutschland |
Alsace-Lorraine[edit]
| Party | Votes | % | Seats | +/– |
|---|
| Clericals | 106,106 | 43.86 | 9 | New |
| Protesters | 83,082 | 34.35 | 6 | New |
| Autonomists | 45,357 | 18.75 | 0 | New |
| National Liberal Party | 5,072 | 2.10 | 0 | 0 |
| Social Democratic Workers' Party | 680 | 0.28 | 0 | 0 |
| Others | 1,605 | 0.66 | 0 | 0 |
| Total | 241,902 | 100.00 | 15 | New |
|
| Valid votes | 241,902 | 99.08 | |
|---|
| Invalid/blank votes | 2,252 | 0.92 | |
|---|
| Total votes | 244,154 | 100.00 | |
|---|
| Registered voters/turnout | 319,477 | 76.42 | |
|---|
| Source:Wahlen in Deutschland |
References[edit]
Works cited[edit]


