From Wikipedia, the free encyclopedia
Election in Pennsylvania
1940 United States presidential election in Pennsylvania|
|
|
|
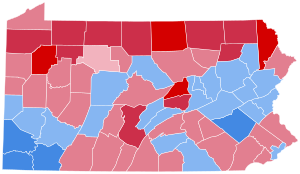 County Results
|
Roosevelt
50-60%
60-70%
|
Willkie
40-50%
50-60%
60-70%
70-80%
| |
|
The1940 United States presidential election in Pennsylvaniatook place on November 5, 1940 as part of the1940 United States presidential election.Voters chose 36 representatives, or electors to theElectoral College,who voted forpresidentandvice president.
Pennsylvaniavoted to giveDemocraticnominee,PresidentFranklin D. Rooseveltan unprecedented third term, over theRepublicannominee, corporate lawyerWendell Willkie,adark horsecandidate who had never before run for a political office. Roosevelt won Pennsylvania by a margin of 6.9%. This was the last election until1976that Pennsylvania voted for a different candidate than nearbyMichigan.
Results[edit]
Results by county[edit]
| County
|
Franklin Delano Roosevelt
Democratic
|
Wendell Lewis Willkie
Republican
|
Various candidates
Other parties
|
Margin
|
Total votes cast[2]
|
| #
|
%
|
#
|
%
|
#
|
%
|
#
|
%
|
| Adams
|
7,354
|
46.01%
|
8,609
|
53.86%
|
20
|
0.13%
|
-1,255
|
-7.85%
|
15,983
|
| Allegheny
|
367,926
|
58.03%
|
263,285
|
41.52%
|
2,849
|
0.45%
|
104,641
|
16.50%
|
634,060
|
| Armstrong
|
12,144
|
45.44%
|
14,524
|
54.34%
|
60
|
0.22%
|
-2,380
|
-8.90%
|
26,728
|
| Beaver
|
33,609
|
57.78%
|
24,324
|
41.81%
|
239
|
0.41%
|
9,285
|
15.96%
|
58,172
|
| Bedford
|
7,388
|
45.32%
|
8,864
|
54.38%
|
49
|
0.30%
|
-1,476
|
-9.05%
|
16,301
|
| Berks
|
53,301
|
61.31%
|
32,111
|
36.94%
|
1,522
|
1.75%
|
21,190
|
24.37%
|
86,934
|
| Blair
|
21,573
|
44.65%
|
26,639
|
55.13%
|
106
|
0.22%
|
-5,066
|
-10.48%
|
48,318
|
| Bradford
|
6,605
|
30.75%
|
14,826
|
69.02%
|
49
|
0.23%
|
-8,221
|
-38.27%
|
21,480
|
| Bucks
|
25,169
|
54.75%
|
20,586
|
44.78%
|
212
|
0.46%
|
4,583
|
9.97%
|
45,967
|
| Butler
|
13,875
|
41.52%
|
19,450
|
58.20%
|
96
|
0.29%
|
-5,575
|
-16.68%
|
33,421
|
| Cambria
|
42,894
|
58.44%
|
30,306
|
41.29%
|
193
|
0.26%
|
12,588
|
17.15%
|
73,393
|
| Cameron
|
1,450
|
44.60%
|
1,793
|
55.15%
|
8
|
0.25%
|
-343
|
-10.55%
|
3,251
|
| Carbon
|
12,777
|
54.50%
|
10,618
|
45.29%
|
51
|
0.22%
|
2,159
|
9.21%
|
23,446
|
| Centre
|
9,869
|
47.90%
|
10,665
|
51.77%
|
68
|
0.33%
|
-796
|
-3.86%
|
20,602
|
| Chester
|
22,473
|
44.18%
|
28,222
|
55.48%
|
174
|
0.34%
|
-5,749
|
-11.30%
|
50,869
|
| Clarion
|
6,564
|
41.99%
|
9,035
|
57.79%
|
34
|
0.22%
|
-2,471
|
-15.81%
|
15,633
|
| Clearfield
|
17,705
|
53.23%
|
15,407
|
46.32%
|
148
|
0.44%
|
2,298
|
6.91%
|
33,260
|
| Clinton
|
7,419
|
54.03%
|
6,291
|
45.81%
|
22
|
0.16%
|
1,128
|
8.21%
|
13,732
|
| Columbia
|
12,523
|
56.76%
|
9,518
|
43.14%
|
21
|
0.10%
|
3,005
|
13.62%
|
22,062
|
| Crawford
|
10,197
|
38.92%
|
15,891
|
60.65%
|
115
|
0.44%
|
-5,694
|
-21.73%
|
26,203
|
| Cumberland
|
15,758
|
50.64%
|
15,297
|
49.16%
|
61
|
0.20%
|
461
|
1.48%
|
31,116
|
| Dauphin
|
38,305
|
47.30%
|
42,394
|
52.35%
|
276
|
0.34%
|
-4,089
|
-5.05%
|
80,975
|
| Delaware
|
60,225
|
42.74%
|
80,158
|
56.88%
|
534
|
0.38%
|
-19,933
|
-14.15%
|
140,917
|
| Elk
|
6,920
|
49.78%
|
6,949
|
49.99%
|
31
|
0.22%
|
-29
|
-0.21%
|
13,900
|
| Erie
|
31,735
|
46.19%
|
36,608
|
53.29%
|
355
|
0.52%
|
-4,873
|
-7.09%
|
68,698
|
| Fayette
|
41,960
|
63.47%
|
23,908
|
36.16%
|
246
|
0.37%
|
18,052
|
27.30%
|
66,114
|
| Forest
|
919
|
33.59%
|
1,811
|
66.19%
|
6
|
0.22%
|
-892
|
-32.60%
|
2,736
|
| Franklin
|
12,713
|
49.21%
|
13,084
|
50.64%
|
39
|
0.15%
|
-371
|
-1.44%
|
25,836
|
| Fulton
|
1,982
|
48.40%
|
2,108
|
51.48%
|
5
|
0.12%
|
-126
|
-3.08%
|
4,095
|
| Greene
|
10,214
|
60.17%
|
6,726
|
39.63%
|
34
|
0.20%
|
3,488
|
20.55%
|
16,974
|
| Huntingdon
|
5,631
|
37.97%
|
9,141
|
61.64%
|
58
|
0.39%
|
-3,510
|
-23.67%
|
14,830
|
| Indiana
|
12,035
|
43.53%
|
15,547
|
56.23%
|
68
|
0.25%
|
-3,512
|
-12.70%
|
27,650
|
| Jefferson
|
8,559
|
41.37%
|
12,081
|
58.40%
|
47
|
0.23%
|
-3,522
|
-17.03%
|
20,687
|
| Juniata
|
3,579
|
50.46%
|
3,507
|
49.44%
|
7
|
0.10%
|
72
|
1.02%
|
7,093
|
| Lackawanna
|
71,343
|
56.32%
|
54,931
|
43.36%
|
411
|
0.32%
|
16,412
|
12.95%
|
126,685
|
| Lancaster
|
32,210
|
41.62%
|
44,939
|
58.07%
|
245
|
0.32%
|
-12,729
|
-16.45%
|
77,394
|
| Lawrence
|
18,814
|
49.07%
|
19,361
|
50.50%
|
167
|
0.44%
|
-547
|
-1.43%
|
38,342
|
| Lebanon
|
13,315
|
49.61%
|
13,449
|
50.11%
|
73
|
0.27%
|
-134
|
-0.50%
|
26,837
|
| Lehigh
|
33,007
|
52.44%
|
29,584
|
47.00%
|
356
|
0.57%
|
3,423
|
5.44%
|
62,947
|
| Luzerne
|
101,577
|
55.85%
|
79,685
|
43.81%
|
622
|
0.34%
|
21,892
|
12.04%
|
181,884
|
| Lycoming
|
18,363
|
46.05%
|
21,423
|
53.72%
|
91
|
0.23%
|
-3,060
|
-7.67%
|
39,877
|
| McKean
|
6,911
|
31.63%
|
14,822
|
67.84%
|
115
|
0.53%
|
-7,911
|
-36.21%
|
21,848
|
| Mercer
|
16,968
|
44.42%
|
21,058
|
55.12%
|
175
|
0.46%
|
-4,090
|
-10.71%
|
38,201
|
| Mifflin
|
6,993
|
52.31%
|
6,352
|
47.51%
|
24
|
0.18%
|
641
|
4.79%
|
13,369
|
| Monroe
|
6,670
|
52.57%
|
6,001
|
47.30%
|
16
|
0.13%
|
669
|
5.27%
|
12,687
|
| Montgomery
|
49,409
|
40.15%
|
73,250
|
59.52%
|
403
|
0.33%
|
-23,841
|
-19.37%
|
123,062
|
| Montour
|
3,080
|
53.04%
|
2,723
|
46.89%
|
4
|
0.07%
|
357
|
6.15%
|
5,807
|
| Northampton
|
33,304
|
56.49%
|
25,385
|
43.06%
|
266
|
0.45%
|
7,919
|
13.43%
|
58,955
|
| Northumberland
|
26,315
|
53.31%
|
22,914
|
46.42%
|
134
|
0.27%
|
3,401
|
6.89%
|
49,363
|
| Perry
|
4,601
|
43.87%
|
5,877
|
56.03%
|
11
|
0.10%
|
-1,276
|
-12.17%
|
10,489
|
| Philadelphia
|
532,149
|
59.69%
|
354,878
|
39.81%
|
4,459
|
0.50%
|
177,271
|
19.88%
|
891,486
|
| Pike
|
1,818
|
41.08%
|
2,596
|
58.65%
|
12
|
0.27%
|
-778
|
-17.58%
|
4,426
|
| Potter
|
2,731
|
34.30%
|
5,205
|
65.36%
|
27
|
0.34%
|
-2,474
|
-31.07%
|
7,963
|
| Schuylkill
|
48,739
|
52.71%
|
43,505
|
47.05%
|
231
|
0.25%
|
5,234
|
5.66%
|
92,475
|
| Snyder
|
2,478
|
30.17%
|
5,722
|
69.66%
|
14
|
0.17%
|
-3,244
|
-39.49%
|
8,214
|
| Somerset
|
14,085
|
44.71%
|
17,369
|
55.13%
|
52
|
0.17%
|
-3,284
|
-10.42%
|
31,506
|
| Sullivan
|
1,626
|
44.04%
|
2,059
|
55.77%
|
7
|
0.19%
|
-433
|
-11.73%
|
3,692
|
| Susquehanna
|
5,383
|
36.04%
|
9,520
|
63.73%
|
35
|
0.23%
|
-4,137
|
-27.69%
|
14,938
|
| Tioga
|
4,434
|
27.51%
|
11,645
|
72.24%
|
40
|
0.25%
|
-7,211
|
-44.74%
|
16,119
|
| Union
|
2,220
|
28.27%
|
5,612
|
71.45%
|
22
|
0.28%
|
-3,392
|
-43.19%
|
7,854
|
| Venango
|
6,873
|
27.89%
|
17,728
|
71.95%
|
38
|
0.15%
|
-10,855
|
-44.06%
|
24,639
|
| Warren
|
5,825
|
34.39%
|
11,016
|
65.04%
|
97
|
0.57%
|
-5,191
|
-30.65%
|
16,938
|
| Washington
|
50,829
|
63.43%
|
29,026
|
36.22%
|
285
|
0.36%
|
21,803
|
27.21%
|
80,140
|
| Wayne
|
3,460
|
27.26%
|
9,203
|
72.50%
|
30
|
0.24%
|
-5,743
|
-45.25%
|
12,693
|
| Westmoreland
|
64,567
|
59.90%
|
42,643
|
39.56%
|
577
|
0.54%
|
21,924
|
20.34%
|
107,787
|
| Wyoming
|
2,548
|
32.51%
|
5,273
|
67.28%
|
16
|
0.20%
|
-2,725
|
-34.77%
|
7,837
|
| York
|
39,543
|
56.56%
|
30,228
|
43.23%
|
146
|
0.21%
|
9,315
|
13.32%
|
69,917
|
| Totals |
2,175,538 |
53.35% |
1,885,265 |
46.23% |
17,004 |
0.42% |
290,273 |
7.12% |
4,077,807
|
See also[edit]
References[edit]


