1990 Australian federal election
| |||||||||||||||||||||||||||||||||||||||||||
All 148 seats in theHouse of Representatives 75 seats were needed for a majority in the House 40 (of the 76) seats in theSenate | |||||||||||||||||||||||||||||||||||||||||||
|---|---|---|---|---|---|---|---|---|---|---|---|---|---|---|---|---|---|---|---|---|---|---|---|---|---|---|---|---|---|---|---|---|---|---|---|---|---|---|---|---|---|---|---|
| Registered | 10,728,435 | ||||||||||||||||||||||||||||||||||||||||||
| Turnout | 10,225,800 (95.31%) ( | ||||||||||||||||||||||||||||||||||||||||||
| |||||||||||||||||||||||||||||||||||||||||||
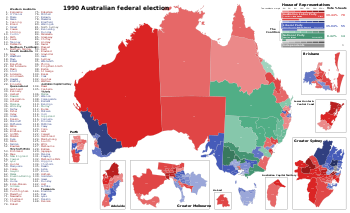
 Results by division for the House of Representatives, shaded by winning party's margin of victory. | |||||||||||||||||||||||||||||||||||||||||||
| |||||||||||||||||||||||||||||||||||||||||||
1990 Australian federal election |
|---|
| National results |
| State and territory results |
|
|
The1990 Australian federal electionwas held in Australia on 24 March 1990. All 148 seats in theHouse of Representativesand 40 seats in the 76-memberSenatewere up for election. The incumbentAustralian Labor Party,led byBob Hawke,defeated the oppositionLiberal Party of Australia,led byAndrew Peacock,with its coalitionpartner, theNational Party of Australia,led byCharles Blunt,despite losing the nationwide popular andtwo-party-preferred vote.The result saw the re-election of the Hawke government for a fourth successive term.
It was the first and, to date, only time the Labor party won four consecutive elections. As of 2023[update]it is the most recent federal election in which leaders of both the largest parties represented divisions outsideNew South Wales,the last to have both major party leaders from the same city other thanSydney,the last to have a rematch justsix years earlierand until2001,thus was the last for the 20th century, which unlike 13 years earlier in1977when it's the last rematch with the same major party leaders appeared consecutively after the previous federal election in the 20th century just2 years earlier,and the last to have both major party leaders born prior toWorld War II.
Background[edit]
AfterJohn Howardlost the1987 electionto Hawke,Andrew Peacockwas elected Deputy Leader in a show of party unity. In May 1989, Peacock's supporters mounted a party room coup which returned Peacock to the leadership. Hawke's Treasurer, Keating, ridiculed Peacock by asking: "Can thesoufflérise twice? "and calling him" all feathers and no meat ".
Hawke's government was in political trouble, with high interest rates and a financial crisis in Victoria. The controversy over theMultifunction Polisboiled over during the federal election campaign. Peacock, declared that a future Coalition Government would abandon the project.[1]He shared the Asian "enclave" fears ofRSLpresidentAlf Garlandand others.[2]The following day,The Australiannewspaper ran a headline "Peacock a 'danger in the Lodge'".[3]
Voting intention[edit]
| Date | Brand | Primary vote | |||
|---|---|---|---|---|---|
| ALP | L/NP | DEM | OTH | ||
| 24 March 1990 election | 39.44% | 43.46 | 11.26% | 5.83% | |
| 22 March 1990 | Newspoll | 41.5% | 39.5% | 14% | 5% |
| 4 March 1990 | Newspoll | 42% | 39% | 13% | 6% |
| 10 December 1989 | Newspoll | 44.5% | 40% | 9.5% | 6% |
| 27 March 1988 | Newspoll | 38% | 48% | 9% | 5% |
| 23 August 1987 | Newspoll | 49% | 41% | 8% | 2% |
| 18 July 1987 election | 45.90% | 45.90% | 6.00% | 2.18% | |
Results[edit]
House of Representatives results[edit]

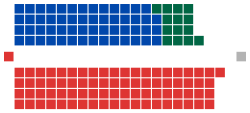
Labor(78)
Opposition(69)
Coalition
Liberal(55)
National(14)
Crossbench(1)
Independent(1)
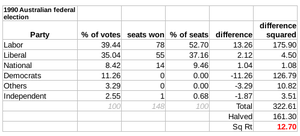
| Party | Votes | % | Swing | Seats | Change | ||||
|---|---|---|---|---|---|---|---|---|---|
| Liberal | 3,440,902 | 34.76 | +0.44 | 55 | |||||
| National | 833,557 | 8.42 | –3.10 | 14 | |||||
| Country Liberal | 27,668 | 0.28 | +0.05 | 0 | |||||
| Liberal–National coalition | 4,302,127 | 43.46 | –2.44 | 69 | |||||
| Labor | 3,904,138 | 39.44 | –6.46 | 78 | |||||
| Democrats | 1,114,216 | 11.26 | +5.26 | ||||||
| Greens(state-based)[a] | 137,351 | 1.37 | |||||||
| Independents [b] | 257,139 | 2.60 | +0.94 | 1 | |||||
| Others | 184,703 | 1.86 | +1.67 | ||||||
| Total | 9,899,674 | 148 | |||||||
| Two-party-preferred vote | |||||||||
| Labor | 4,930,837 | 49.90 | −0.93 | 78 | |||||
| Liberal–National coalition | 4,950,072 | 50.10 | +0.93 | 69 | |||||
| Invalid/blank votes | 326,126 | 3.19 | –1.75 | ||||||
| Turnout | 10,225,800 | 95.32 | |||||||
| Registered voters | 10,728,131 | ||||||||
| Source:Federal Elections 1990 | |||||||||
Senate results[edit]

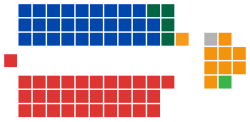
Labor(32)
Opposition(34)
Coalition
Liberal(29)
National(4)
CLP(1)
Crossbench(10)
Democrats(8)
WA Greens(1)
Independent(1)
| Party | Votes | % | Swing | Seats won | Seats held | Change | ||
|---|---|---|---|---|---|---|---|---|
| Liberal–National joint ticket | 2,429,552 | 24.47 | +10.71 | 5 | N/A | N/A | ||
| Liberal | 1,445,872 | 14.56 | –6.41 | 12 | 29 | |||
| National | 258,164 | 2.60 | −4.49 | 1 | 4 | |||
| Country Liberal | 29,045 | 0.29 | +0.08 | 1 | 1 | |||
| Liberal–National coalition | 4,162,633 | 41.92 | –0.12 | 19 | 34 | |||
| Labor | 3,813,547 | 38.41 | −4.42 | 15 | 32 | |||
| Democrats | 1,253,807 | 12.63 | +4.15 | 5 | 8 | |||
| Greens [c] | 208,157 | 2.10 | +1.66 | 1 | 1 | |||
| Nuclear Disarmament [d] | 38,079 | 0.38 | –0.71 | |||||
| Independents [e] | 29,974 | 0.30 | –1.59 | 1 | ||||
| Others | 423,568 | 4.25 | +2.07 | |||||
| Total | 9,929,765 | 40 | 76 | |||||
| Invalid/blank votes | 349,065 | 3.40 | –0.64 | |||||
| Turnout | 10,728,830 | 95.81 | ||||||
| Registered voters | 10,728,131 | |||||||
| Source:Federal Elections 1990 | ||||||||
Seats changing hands[edit]
Members listed in italics did not contest their seat at this election. Where redistributions occurred, the pre-1990 margin represents the redistributed margin.
Notes[edit]
- Adelaide, SA,won by Labor at the previous election, was won by Liberal in a by-election. The margin listed above is the by-election margin.
- Deakin, Vic,won by Liberal at the previous election, was made notionally Labor in the redistribution and is considered a Liberal gain.
- Isaacs, VicandMoore, WA,won by Labor at the previous election, were made notionally Liberal in the redistribution and are considered Liberal retains.
- Henty, VicandStreeton, Vic,won by Labor at the previous election, were abolished.
Outcome[edit]

The 1990 election resulted in a modest swing to the opposition Coalition. Though Labor had to contend with thelate 80s/early 90s recession,they won a record fourth successive election and a record 10 years in government withBob Hawkeas leader, a level of political success not previously seen by federal Labor. The election was to be Hawke's last as Prime Minister and Labor leader, he was replaced byPaul Keatingon 20 December 1991 who would go on to lead Labor to win a record fifth successive election and a record 13 years (to the day) in government resulting from the1993 election.
At the election, the Coalition won a slim majority of the two-party vote, and slashed Labor's majority from 24 seats to nine, most of the gains made in Victoria.[5]However, it only managed a two-party swing of 0.9 percent, which was not nearly enough to deliver the additional seven seats the Coalition needed to make Peacock Prime Minister. Despite having regained much of what the non-Labor forces had lost three years earlier, Peacock was forced to resign after the election.
This election saw the peak of theAustralian Democrats' popularity underJanine Haines,and aWA Greenscandidate won a seat in theAustralian Senatefor the first time – although the successful candidate,Jo Vallentine,was already a two-term senator, having previously won a seat for theNuclear Disarmament Partyat the1984 election,and the Vallentine Peace Group at the 1987 election. Until 2010, this was the only post-war election where a third party (excluding splinter state parties and the Nationals) has won more than 10% of the primary vote for elections to the Australian House of Representatives.
After the1918 Swan by-election,which Labor unexpectedly won with the largest primary vote, a predecessor of the Liberals, theNationalist Party of Australia,changed the federal lower house voting system fromfirst-past-the-postto full-preferencepreferential votingfor the subsequent1919 election,and it has remained in place since, allowing theCoalitionparties to safely contest the same seats. Full-preference preferential voting re-elected the Hawke government, the first time in federal history that Labor had obtained a net benefit from preferential voting.[6]
It also saw the Nationals' leader,Charles Blunt,defeated in his own seat ofRichmondby Labor challengerNeville Newell—only the second time that a major party leader had lost his own seat. Newell benefited from the presence of independent and anti-nuclear activistHelen Caldicott.Her preferences flowed overwhelmingly to Newell on the third count, allowing Newell to win despite having been second on the primary vote.
See also[edit]
- Candidates of the Australian federal election, 1990
- Members of the Australian House of Representatives, 1990–1993
- Members of the Australian Senate, 1990–1993
Notes[edit]
- ^There was no federalAustralian Greensparty at this election. The Greens total includesGreens Western Australia(67,164),NSW Green Alliance [f](45,819),Queensland Greens(10,054),United Tasmania Group(6,367),Greens South Australia(1,878) andACT Green Democratic Alliance(6,069).
- ^The independent member wasTed Mack(NSW).
- ^The Greens total in the Senate includesGreens Western Australia(76,381 and elected one senator), NSW Green Alliance (64,583),Victorian Greens(23,420),Greens South Australia(19,499),United Tasmania Group(14,160),ACT Green Democratic Alliance(5,288),Greens New South Wales(4,826) and Australian Gruen (4,826).
- ^The election ofNuclear DisarmamentSenatorRobert Woodwas void.Irina Dunnwas declared elected in his place but was expelled from the party and served out the remainder of her term as an independent.
- ^Jo Vallentinehad been re-elected in 1987 as an independent however she joined theGreensfor this election. The sitting independent wasBrian Harradine.
- ^At this election the Greens in New South Wales were a loose alliance largely organised bylocal groups,with 18 candidates running under a variety of names: Australian Gruen Party (Fowler,Macarthur,Mackellar,Macquarie,Prospect,St George,ThrosbyandWerriwa), the Greens (PhillipandWentworth), Illawarra Greens (CunninghamandHughes),SydneyGreens, South Sydney Greens (Kingsford Smith), Central Coast Green Party (DobellandRobertson), Greens inLoweandCowperGreens.
References[edit]
- ^Hamilton, "Serendipity City", pp. 152-55.
- ^ Jupp, James (2 April 2007).From White Australia to Woomera: The Story of Australian Immigration.Cambridge University Press.pp. 107–219.ISBN978-0-521-69789-7.Retrieved12 January2008.
- ^Washington, David (23 May 2016)."The more opinion, the less it matters".Crikey.Retrieved23 July2023.
- ^"Federal Newspoll Archive - Infogram".infogram.com.Retrieved8 April2023.
- ^Megalogenis, George (25 June 2021)."Hard lessons: On unis, Coalition has embraced Howard's way".The Sydney Morning Herald.Retrieved27 June2021.
- ^Green, Antony(23 September 2015)."The Origin of Senate Group Ticket Voting, and it didn't come from the Major Parties".Blogs.abc.net.au.Retrieved30 July2016.
- University of WAArchived18 January 2015 at theWayback Machineelection results in Australia since 1890
- AEC 2PP vote
- AustralianPolitics.com election details


