
Air pollution


| Part of aserieson |
| Pollution |
|---|
 |
| Part ofa serieson |
| Weather |
|---|
|
|
Air pollutionis the contamination of air due to the presence of substances called pollutants in the atmosphere that are harmful to the health of humans and other living beings, or cause damage to the climate or to materials.[1]It is also the contamination of the indoor or outdoor environment either by chemical, physical, orbiological agentsthat alters the natural features of the atmosphere.[1]There are many different types of air pollutants, such as gases (includingammonia,carbon monoxide,sulfur dioxide,nitrous oxides,methaneandchlorofluorocarbons),particulates(both organic and inorganic) andbiological molecules.Air pollution can cause diseases, allergies, and even death to humans; it can also cause harm to other living organisms such as animals and crops, and may damage the natural environment (for example,climate change,ozone depletionorhabitat degradation) orbuilt environment(for example,acid rain).[2]Air pollution can be caused by both human activities[3]and natural phenomena.[4]
Air quality is closely related to theEarth's climateandecosystemsglobally. Many of the contributors of air pollution are also sources ofgreenhouse emissioni.e., burning offossil fuel.[1]
Air pollution is a significantrisk factorfor a number ofpollution-related diseases,includingrespiratory infections,heart disease,chronic obstructive pulmonary disease(COPD),stroke,andlung cancer.[5]Growing evidence suggests that air pollution exposure may be associated with reduced IQ scores, impaired cognition,[6]increased risk for psychiatric disorders such asdepression[7]and detrimentalperinatalhealth.[8]The human health effects of poor air quality are far reaching, but principally affect the body's respiratory system and thecardiovascular system.[9][10]Individual reactions to air pollutants depend on the type of pollutant a person is exposed to,[11][12]the degree of exposure, and the individual's health status andgenetics.[13]
Air pollution is the largest environmental risk factor for disease and premature death[5][14]and the fourth largest risk factor overall for human health.[15]Air pollution causes the premature deaths of around 7 million people worldwide each year,[5]or a global mean loss of life expectancy (LLE) of 2.9 years,[16]and there has been no significant change in the number of deaths caused by all forms of pollution since at least 2015.[14][17][18]Outdoor air pollution attributable to fossil fuel use alone causes ~3.61 million deaths annually,[19]making it oneof the top contributors to human death.[5]Anthropogenic ozone causes around 470,000 premature deaths a year and fine particulate (PM2.5) pollution around another 2.1 million.[20]The scope of the air pollution crisis is large: In 2018, WHO estimated that "9 out of 10 people breathe air containing high levels of pollutants."[21]Although the health consequences are extensive, the way the problem is handled is considered largely haphazard[22][21][23]or neglected.[14]
The World Bank has estimated that welfare losses (premature deaths) andproductivitylosses (lost labour) caused by air pollution cost theworld economy$5 trillion per year.[24][25][26]The costs of air pollution are generally anexternalityto the contemporaryeconomic systemand most human activity, although they are sometimes recovered throughmonitoring, legislation, and regulation.[27][28]
Many different technologies and strategies are available for reducing air pollution.[29]Although a majority of countries haveair pollution laws,according toUNEP,43 percent of countries lack a legal definition of air pollution, 31 percent lack outdoor air quality standards, 49 percent restrict their definition to outdoor pollution only, and just 31 percent have laws for tackling pollution originating from outside their borders.[30]National air quality laws have often been highly effective, notably the 1956Clean Air Actin Britain and theUS Clean Air Act,introduced in 1963.[31][32]Some of these efforts have been successful at the international level, such as theMontreal Protocol,[33]which reduced the release of harmfulozonedepleting chemicals, and the 1985Helsinki Protocol,[34]which reducedsulfur emissions,[35]while others, such asinternational action on climate change,[36][37][38]have been less successful.
Sources of air pollution
[edit]There are many different sources of air pollution. Some air pollutants (such as nitrogen oxides) originate mainly from human activities,[39]while some (notablyradongas) come mostly from natural sources.[40]However, many air pollutants (including dust and sulfur dioxide) come from a mixture of natural and human sources.[41]
Anthropogenic (human-made) sources
[edit]


- Stationary sources include:
- fossil-fuelpower plants andbiomasspower plants both have smoke stacks (see for exampleenvironmental impact of the coal industry)[42]
- Oil and gas sites that havemethane leaks[43][44][45][46]
- burning of traditional biomass such as wood, crop waste and dung. (In developing and poor countries,[47]traditional biomass burning is the major source of air pollutants.[48][49]It is also the main source of particulate pollution in many developed areas including the UK & New South Wales.[50][51]Its pollutants includePAHs.[52])
- manufacturing facilities (factories)[53]
- a 2014 study found that in China equipment-,machinery-, and devices-manufacturing and construction sectors contributed more than 50% of air pollutant emissions.[54][better source needed]This high emission is due to highemission intensityand highemission factorsin its industrial structure.[55]
- construction[56][57]
- renovation[58]
- waste incineration (incineratorsas well as open and uncontrolled fires of mismanaged waste, making up about a fourth of municipal solid terrestrial waste)[59][60]
- furnaces and other types of fuel-burning heating devices[61]
- fossil-fuelpower plants andbiomasspower plants both have smoke stacks (see for exampleenvironmental impact of the coal industry)[42]
- Mobile sourcesincludemotor vehicles,trains (particularlydiesel locomotivesandDMUs), marine vessels and aircraft[62]as well asrocketsand re-entry of components anddebris.[63]Theair pollution externality of carsenters the air from theexhaust gasand car tires (includingmicroplastics[64]). Road vehicles make a significant amount of all air pollution (typically, for example, around a third to a half of all nitrogen dioxide emissions)[65][66][67]and are a major driver ofclimate change.[68][69]
- Agriculture andforest managementstrategies using controlled burns. Practices likeslash-and-burnin forests like the Amazon cause large air pollution with thedeforestation.[70]Controlled or prescribed burning is a practice used inforest management,agriculture,prairie restoration,andgreenhouse gasreduction.[71]Foresterscan use controlled fire as a tool because fire is a natural feature of both forest and grassland ecology.[72][73]Controlled burning encourages the sprouting of some desirable forest trees, resulting in a forest renewal.[74]
There are also sources from processes other thancombustion:
- Fumes from paint,hair spray,varnish,aerosol spraysand other solvents. These can be substantial; emissions from these sources was estimated to account for almost half of pollution fromvolatile organic compoundsin the Los Angeles basin in the 2010s.[75]
- Waste deposition in landfills producesmethane[76]and open burning of waste releases harmful substances.[77]
- Nuclear weapons,toxic gases,germ warfare,and rocketry are examples of military resources.[78]
- Agricultural emissionsandemissions from meat production or livestockcontribute substantially to air pollution[79][80]
- Fertilized farmland may be a major source ofnitrogen oxides.[81]
| Food Types | Acidifying Emissions (g SO2eq per 100g protein) |
|---|---|
| Beef | |
| Cheese | |
| Pork | |
| Lamb and mutton | |
| Farmed crustaceans | |
| Poultry | |
| Farmed fish | |
| Eggs | |
| Groundnuts | |
| Peas | |
| Tofu |
Natural sources
[edit]
- Dustfrom natural sources, usually large areas of land with little or no vegetation.
- Methane,emitted by thedigestionof food by animals, for examplecattle.
- Radongas fromradioactive decaywithin theEarth's crust.Radon is a colorless, odorless, naturally occurring, radioactivenoble gasthat is formed from the decay ofradium.It is considered to be a health hazard. Radon gas from natural sources can accumulate in buildings, especially in confined areas such as the basement and it is the second most frequent cause oflung cancer,aftercigarettesmoking.
- Smoke andcarbon monoxidefromwildfires.During periods of active wildfires, smoke from uncontrolledbiomasscombustioncan make up almost 75% of all air pollution by concentration.[83]
- Vegetation,in some regions, emits environmentally significant amounts ofvolatile organic compounds(VOCs) on warmer days. These VOCs react with primary anthropogenic pollutants – specifically, NOx,SO2,andanthropogenicorganic carbon compounds – to produce a seasonal haze of secondary pollutants.[84]Black gum,poplar, oak andwilloware some examples of vegetation that can produce abundant VOCs. The VOC production from these species result in ozone levels up to eight times higher than the low-impact tree species.[85]
- Volcanicactivity, which producessulfur,chlorine,andashparticulates.[86]
Emission factors
[edit]
Air pollutant emission factors are reported representative values that aim to link the quantity of a pollutant released into the ambient air to an activity connected with that pollutant's release.[2][87][88][89]The weight of the pollutant divided by a unit weight, volume, distance, or time of the activity generating the pollutant is how these factors are commonly stated (e.g., kilograms of particulate emitted per tonne of coal burned). These criteria make estimating emissions from diverse sources of pollution easier. Most of the time, these components are just averages of all available data of acceptable quality, and they are thought to be typical of long-term averages.
TheStockholm Convention on Persistent Organic Pollutantsidentified pesticides and otherpersistent organic pollutantsof concern. These includedioxinsandfuranswhich are unintentionally created by combustion of organics, like open burning of plastics, and areendocrine disruptorsandmutagens.

TheUnited States Environmental Protection Agencyhas published a compilation of air pollutant emission factors for a wide range of industrial sources.[90]The United Kingdom, Australia, Canada, and many other countries have published similar compilations, as well as theEuropean Environment Agency.[91][92][93][94]
Pollutants
[edit]
An air pollutant is a material in the air that can have many effects on humans and the ecosystem.[95]The substance can be solid particles, liquid droplets, or gases, and often takes the form of anaerosol(solid particles or liquid droplets dispersed and carried by a gas).[96]A pollutant can be of natural origin or man-made. Pollutants are classified as primary or secondary. Primary pollutants are usually produced by processes such as ash from a volcanic eruption.
Other examples include carbon monoxide gas from motor vehicle exhausts or sulfur dioxide released from factories. Secondary pollutants are not emitted directly. Rather, they form in the air when primary pollutants react or interact.Ground level ozoneis a prominent example of a secondary pollutant. Some pollutants may be both primary and secondary: they are both emitted directly and formed from other primary pollutants.
Primary pollutants
[edit]Pollutants emitted into the atmosphere by human activity include:
- Ammonia:Emitted mainly by agricultural waste. Ammonia is a compound with the formula NH3.It is normally encountered as a gas with a characteristic pungent odor. Ammonia contributes significantly to the nutritional needs of terrestrial organisms by serving as a precursor to foodstuffs and fertilizers. Ammonia, either directly or indirectly, is also a building block for the synthesis of manypharmaceuticals.Although in wide use, ammonia is both caustic and hazardous.[97]In the atmosphere, ammonia reacts withoxides of nitrogenand sulfur to form secondary particles.[98]
- Carbon dioxide(CO2): Carbon dioxide is a natural component of the atmosphere, essential for plant life and given off by the humanrespiratory system.[99]It is potentially lethal at very high concentrations (typically 100 times "normal" atmospheric levels).[100][101]Although theWorld Health Organizationrecognizes CO2as a climate pollutant, it does not include the gas in itsAir Quality Guidelinesor set recommended targets for it.[102]Because of its role as agreenhouse gas,CO2has been described as "the worst climate pollutant".[103]Statements such as this refer to its long-term atmospheric effects rather than shorter-term effects on such things as human health, food crops, and buildings. This question of terminology has practical consequences, for example, in determining whether the U.S.Clean Air Act(which is designed to improve air quality) is deemed to regulate CO2emissions.[104]That issue was resolved in the United States by theInflation Reduction Actof 2022, which specifically amended the Clean Air Act "to define the carbon dioxide produced by the burning offossil fuelsas an 'air pollutant.' "[105]CO2currently forms about 410 parts per million (ppm) of Earth's atmosphere, compared to about 280 ppm in pre-industrial times,[106]and billions of metric tons of CO2are emitted annually by burning of fossil fuels.[107]CO2increase in Earth's atmosphere has been accelerating.[108]CO2is anasphyxiant gasand not classified as toxic or harmful in general.[109]Workplace exposure limits exist in places like UK (5,000 ppm for long-term exposure and 15,000 ppm for short-term exposure).[101]Natural disasters like thelimnic eruptionatLake Nyoscan result in a sudden release of huge amount of CO2as well.[110]
- Carbon monoxide(CO): CO is a colorless, odorless, toxic gas.[111]It is a product ofcombustionof fuel such as natural gas, coal or wood. Vehicular exhaust contributes to the majority of carbon monoxide let into the atmosphere. It creates a smog type formation in the air that has been linked to many lung diseases and disruptions to the natural environment and animals.
- Chlorofluorocarbons(CFCs): Emitted from goods that are now prohibited from use; harmful to the ozone layer. These are gases emitted by air conditioners, freezers, aerosol sprays, and other similar devices. CFCs reach the stratosphere after being released into the atmosphere.[112]They interact with other gases here, causing harm to the ozone layer. UV rays are able to reach the Earth's surface as a result of this. This can result in skin cancer, eye problems, and even plant damage.[113]
- Nitrogen oxides(NOx): Nitrogen oxides, particularlynitrogen dioxide,are expelled from high temperature combustion, and are also produced during thunderstorms byelectric discharge.They can be seen as a brownhazedome above or aplumedownwind of cities. Nitrogen dioxide is a chemical compound with the formula NO2.It is one of several nitrogen oxides. One of the most prominent air pollutants, this reddish-brown toxic gas has a characteristic sharp, biting odor.
- Odors: Such as from garbage, sewage, and industrial processes.
- Particulate matter/particles (PM), also known as particulates, atmospheric particulate matter (APM), or fine particles, are microscopic solid or liquid particles suspended in a gas.[114]Aerosol is a mixture of particles and gas. Volcanoes,dust storms,forest and grassland fires, living plants, and sea spray are all sources of particles. Aerosols are produced by human activities such as the combustion of fossil fuels in automobiles, power plants, and numerous industrial processes.[115]Averaged worldwide, anthropogenic aerosols – those made by human activities – currently account for approximately 10% of the atmosphere. Increased levels of fine particles in the air are linked to health hazards such as heart disease,[116]altered lung function and lung cancer. Particulates are related to respiratory infections and can be particularly harmful to those with conditions likeasthma.[117]
- Persistent organic pollutants,which can attach to particulates. Persistent organic pollutants are organic compounds that are resistant toenvironmental degradationdue to chemical, biological, orphotolyticprocesses (POPs). As a result, they've been discovered to survive in the environment, be capable of long-range transmission,bioaccumulatein human and animal tissue, biomagnify in food chains, and pose a major threat to human health and theecosystem.[118]
- Persistent free radicalsconnected to airborne fine particles are linked to cardiopulmonary disease.[119][120]
- Polycyclic Aromatic Hydrocarbons(PAHs): a group of aromatic compounds formed from the incomplete combustion of organic compounds including coal and oil and tobacco.[121]
- Radioactive pollutants:Produced bynuclear explosions,nuclear events, war explosives, and natural processes such as the radioactive decay of radon.
- Sulfur oxides(SOx): particularly sulfur dioxide, a chemical compound with the formula SO2.SO2is produced by volcanoes and in various industrial processes. Coal and petroleum often contain sulfur compounds, and their combustion generates sulfur dioxide. Further oxidation of SO2,usually in the presence of a catalyst such as NO2,forms H2SO4,and thusacid rainis formed. This is one of the causes for concern over the environmental impact of the use of these fuels as power sources.
- Toxic metals, such asleadandmercury,especially their compounds.
- Volatile organic compounds(VOC): VOCs are both indoor and outdoor air pollutants.[122]They are categorized as either methane (CH4) or non-methane (NMVOCs). Methane is an extremely efficient greenhouse gas which contributes to enhancedglobal warming.Other hydrocarbon VOCs are also significant greenhouse gases because of their role in creating ozone and prolonging the life ofmethane in the atmosphere.This effect varies depending on local air quality. The aromatic NMVOCs benzene, toluene and xylene are suspected carcinogens and may lead to leukemia with prolonged exposure. 1,3-butadiene is another dangerous compound often associated with industrial use.
Secondary pollutants
[edit]Secondary pollutants include:
- Ground level ozone(O3): Ozone is created when NOx and VOCs mix. It is a significant part of the troposphere.[123]It's also an important part of the ozone layer, which can be found in different sections of the stratosphere. Photochemical and chemical reactions involving it fuel many of the chemical activities that occur in the atmosphere during the day and night. It is a pollutant and a component ofsmogthat is produced in large quantities as a result of human activities (mostly the combustion of fossil fuels).[124]O3is largely produced by chemical reactions involving NOxgases (nitrogen oxides, especially from combustion) and volatile organic compounds in the presence of sunlight. Due to the influence of temperature and sunlight on this reaction, high ozone levels are most common on hot summer afternoons.[125]
- Peroxyacetyl nitrate(C2H3NO5): similarly formed from NOxand VOCs.
- Photochemical smog:particles are formed from gaseous primary contaminants and chemicals.[126]Smog is a type of pollution that occurs in the atmosphere. Smog is caused by a huge volume of coal being burned in a certain region, resulting in a mixture of smoke and sulfur dioxide.[127]Modern smog is usually caused by automotive and industrial emissions, which are acted on in the atmosphere by UV light from the sun to produce secondary pollutants, which then combine with the primary emissions to generate photochemical smog.
Other pollutants
[edit]There are many other chemicals classed as hazardous air pollutants. Some of these are regulated in the USA under theClean Air Actand in Europe under numerousdirectives(including the Air "Framework" Directive, 96/62/EC, on ambient air quality assessment and management, Directive 98/24/EC, on risks related to chemical agents at work, and Directive 2004/107/EC covering heavy metals and polycyclic aromatic hydrocarbons in ambient air).[128][129]
| To display all pages, subcategories and images click on the "►": |
|---|
-
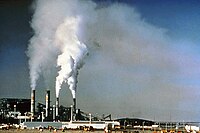 Beforeflue-gas desulfurizationwas installed, the emissions from this power plant inNew Mexicocontained excessive amounts ofsulfur dioxide.
 -
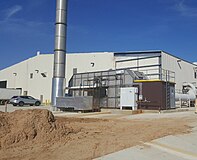 Thermal oxidisersare air pollution abatement options forhazardous air pollutants(HAPs),volatile organic compounds(VOCs), and odorous emissions.
 -
This video provides an overview of a NASA study on the human fingerprint on global air quality.


Exposure
[edit]The risk of air pollution is determined by the pollutant's hazard and the amount of exposure to that pollutant. Air pollution exposure can be measured for a person, a group, such as a neighborhood or a country's children, or an entire population. For example, one would want to determine a geographic area's exposure to a dangerous air pollution, taking into account the various microenvironments and age groups. This can be calculated[130]as an inhalation exposure. This would account for daily exposure in various settings, e.g. different indoor micro-environments and outdoor locations. The exposure needs to include different ages and other demographic groups, especially infants, children, pregnant women, and other sensitive subpopulations.[130]
For each specific time that the subgroup is in the setting and engaged in particular activities, the exposure to an air pollutant must integrate the concentrations of the air pollutant with regard to the time spent in each setting and the respective inhalation rates for each subgroup, playing, cooking, reading, working, spending time in traffic, etc. A little child's inhaling rate, for example, will be lower than that of an adult. A young person engaging in strenuous exercise will have a faster rate of breathing than a child engaged in sedentary activity. The daily exposure must therefore include the amount of time spent in each micro-environmental setting as well as the kind of activities performed there. The air pollutant concentration in each microactivity/microenvironmental setting is summed to indicate the exposure.[130]
For some pollutants such asblack carbon,traffic related exposures may dominate total exposure despite short exposure times since high concentrations coincide with proximity to major roads or participation in (motorized) traffic.[131]A large portion of total daily exposure occurs as short peaks of high concentrations, but it remains unclear how to define peaks and determine their frequency and health impact.[132]
In 2021, the WHO halved its recommended guideline limit for tiny particles from burning fossil fuels. The new limit fornitrogen dioxide(NO2) is 75% lower.[133]Growing evidence that air pollution—even when experienced at very low levels—hurts human health, led the WHO to revise its guideline (from 10 μg/m3to 5 μg/m3) for what it considers a safe level of exposure of particulate pollution, bringing most of the world—97.3 percent of the global population—into the unsafe zone.[134]
Indoor air quality
[edit]

A lack of ventilation indoors concentrates air pollution where people often spend the majority of their time. Indoor air pollution can pose a significant health risk. According to EPA reports, the concentrations of many air pollutants can be two to five times higher in indoor air than in outdoor air. Indoor air pollutants can be up to 100 times higher in some cases than they are inside. People can spend up to 90% of their time indoors, according to the American Lung Association; the US Consumer Product Safety Commission (CPSC) 2012; and the US Environmental Protection Agency 2012a.[135]
Indoor contaminants that can cause pollution include asbestos, biologic agents, building materials, radon, tobacco smoke, and wood stoves, gas ranges, or other heating systems.[135]
Radon(Rn) gas, acarcinogen,is exuded from the Earth in certain locations and trapped inside houses. Building materials including carpeting andplywoodemitformaldehyde(H-CHO) gas. Paint and solvents give off volatile organic compounds (VOCs) as they dry.Leadpaint can degenerate intodustand be inhaled.[136][137]
Intentional air pollution is introduced with the use ofair fresheners,incense,and other scented items. Controlled wood fires in cook stoves and fireplaces can add significant amounts of harmful smoke particulates into the air, inside and out.[136][137]Indoor pollution fatalities may be caused by usingpesticidesand other chemical sprays indoors without proper ventilation. Also the kitchen in a modern produce harmful particles and gases, with equipment like toasters being one of the worst sources.[138]
Carbon monoxide poisoning and fatalities are often caused by faulty vents and chimneys, or by the burning of charcoal indoors or in a confined space, such as a tent.[139]Chroniccarbon monoxide poisoningcan result even from poorly-adjustedpilot lights.Traps are built into all domesticplumbingto keep sewer gas andhydrogen sulfide,out of interiors. Clothing emitstetrachloroethylene,or other dry cleaning fluids, for days after dry cleaning.
Though its use has now been banned in many countries, the extensive use ofasbestosin industrial and domestic environments in the past has left a potentially very dangerous material in many localities.Asbestosisis a chronicinflammatorymedical condition affecting the tissue of the lungs. It occurs after long-term, heavy exposure to asbestos from asbestos-containing materials in structures. Those with asbestosis have severedyspnea(shortness of breath) and are at an increased risk regarding several different types oflung cancer.As clear explanations are not always stressed in non-technical literature, care should be taken to distinguish between several forms of relevant diseases. According to the World Health Organization,[140]these may be defined as asbestosis, lung cancer, andperitoneal mesothelioma(generally a very rare form of cancer, when more widespread it is almost always associated with prolonged exposure to asbestos).
Biological sources of air pollution are also found indoors, as gases and airborne particulates. Pets produce dander, people produce dust from minute skin flakes and decomposed hair,dust mitesin bedding, carpeting and furniture produce enzymes and micrometre-sized fecal droppings, inhabitants emit methane, mold forms on walls and generatesmycotoxinsand spores,air conditioningsystems can incubateLegionnaires' diseaseand mold, and houseplants, soil and surrounding gardens can producepollen,dust, and mold. Indoors, the lack of air circulation allows these airborne pollutants to accumulate more than they would otherwise occur in nature.
Health effects
[edit]Air pollution has both acute and chronic effects on human health, affecting a number of different systems and organs but principally affect the body's respiratory system and the cardiovascular system. Afflictions include minor to chronic upper respiratory irritation such as difficulty in breathing, wheezing, coughing,asthma[141]andheart disease,lung cancer,stroke,acuterespiratory infectionsin children and chronic bronchitis in adults, aggravating pre-existing heart and lung disease, or asthmatic attacks.
Short and long term exposures have been linked with premature mortality and reduced life expectancy[142]and can result in increased medication use, increased doctor oremergency departmentvisits, more hospital admissions and premature death.[130][better source needed]Diseases that develop from persistent exposure to air pollution areenvironmental healthdiseases, which develop when a health environment is not maintained.[143]
Even at levels lower than those considered safe by United States regulators, exposure to three components of air pollution, fine particulate matter, nitrogen dioxide and ozone, correlates with cardiac and respiratory illness.[144]Individual reactions to air pollutants depend on the type of pollutant a person is exposed to, the degree of exposure, and the individual's health status and genetics.[130]The most common sources of air pollution include particulates and ozone (often from burning fossil fuels),[145]nitrogen dioxide, and sulfur dioxide. Children aged less than five years who live in developing countries are the most vulnerable population to death attributable to indoor and outdoor air pollution.[146]
Under theClean Air Act,U.S. EPAsets limits on certain air pollutants, including setting limits on how much can be in the air anywhere in the United States.[147]Mixed exposure to bothcarbon blackand ozone could result in significantly greater health affects.[148]
Mortality
[edit]


Estimates of deaths toll due to air pollution vary.[150]In 2014 the World Health Organization estimated that every year air pollution causes the premature death of 7 million people worldwide,[5]1 in 8 deaths worldwide.[151]A study published in 2019 indicated that in 2015 the number may be closer to 8.8 million, with 5.5 million of these premature deaths due to air pollution from anthropogenic sources.[152][153]A 2022 review concluded that in 2019 air pollution was responsible for approximately million deaths. It concluded that since 2015 little real progress against pollution has been made.[14][154]Causes of deaths include strokes, heart disease,COPD,lung cancer, and lung infections.[5]Children are particularly at risk.[155]
In 2021, the WHO reported that outdoor air pollution was estimated to cause 4.2 million premature deaths worldwide in 2019.[156]
The global mean loss of life expectancy (LLE; similar toYPLL) from air pollution in 2015 was 2.9 years, substantially more than, for example, 0.3 years from all forms of direct violence.[16]Communities with persons that live beyond 85 years have low ambient air pollution, suggesting a link between air pollution levels and longevity.[157]
Primary mechanisms
[edit]The WHO estimates that in 2016, ~58% of outdoor air pollution-related premature deaths were due to ischaemic heart disease and stroke.[156]The mechanisms linking air pollution to increased cardiovascular mortality are uncertain, but probably include pulmonary and systemic inflammation.[158]
By region
[edit]India and China have the highest death rate due to air pollution.[159][160]India also has more deaths from asthma than any other nation according to the World Health Organization. In 2019, 1.6 million deaths in India were caused by air pollution.[161]In 2013, air pollution was estimated to kill 500,000 people in China each year.[162]In 2012, 2.48% of China's total air pollution emissions were caused by exports due to US demand, causing an additional 27,963 deaths across 30 provinces.[163]
Annual premature European deaths caused by air pollution are estimated at 430,000[164]to 800,000.[153]An important cause of these deaths is nitrogen dioxide and other nitrogen oxides (NOx) emitted by road vehicles.[164]Across theEuropean Union,air pollution is estimated to reducelife expectancyby almost nine months.[165]In a 2015 consultation document the UK government disclosed that nitrogen dioxide is responsible for 23,500 premature UK deaths per annum.[166]There is a positive correlation betweenpneumonia-related deaths and air pollution from motor vehicle emissions in England.[167]
Eliminating energy-related fossil fuel emissions in the United States would prevent 46,900–59,400 premature deaths each year and provide $537–$678 billion in benefits from avoided PM2.5-related illness and death.[168]
A study published in 2023 inSciencefocused onsulfur dioxideemissions by coal power plants (coal PM2.5) and concluded that "exposure to coal PM2.5was associated with 2.1 times greater mortality risk than exposure to PM2.5from all sources. "[169]From 1999 to 2020, a total of 460,000 deaths in the US were attributed to coal PM2.5.[169]

Major causes
[edit]
The largest cause of air pollution isfossil fuelcombustion[171]– mostly the production and use ofcars,electricity production, and heating.[172]There are estimated 4.5 million annual premature deaths worldwide due to pollutants released by high-emission power stations and vehicle exhausts.[173]
Diesel exhaust(DE) is a major contributor to combustion-derived particulate matter air pollution. In several human experimental studies, using a well-validated exposure chamber setup, DE has been linked to acute vascular dysfunction and increased thrombus formation.[174][175]
A study concluded that PM2.5air pollutioninducedby the contemporary free trade and consumption by the19G20 nations causes two million premature deaths annually, suggesting that the average lifetime consumption of about ~28 people in these countries causes at least one premature death (average age ~67) while developing countries "cannot be expected" to implement or be able to implement countermeasures without external support or internationally coordinated efforts.[176][170]
Guidelines
[edit]The US EPA has estimated that limiting ground-level ozone concentration to 65 parts per billion (ppb), would avert 1,700 to 5,100 premature deaths nationwide in 2020 compared with the 75 ppb standard. The agency projected the more protective standard would also prevent an additional 26,000 cases of aggravated asthma, and more than a million cases of missed work or school.[177][178]Following this assessment, the EPA acted to protectpublic healthby lowering the National Ambient Air Quality Standards (NAAQS) for ground-level ozone to 70 ppb.[179]
A 2008 economic study of the health impacts and associated costs of air pollution in the Los Angeles Basin and San Joaquin Valley of Southern California shows that more than 3,800 people die prematurely (approximately 14 years earlier than normal) each year because air pollution levels violate federal standards. The number of annual premature deaths is considerably higher than the fatalities related to auto collisions in the same area, which average fewer than 2,000 per year.[180][181][182]A 2021 study found that outdoor air pollution is associated with substantiallyincreased mortality"even at low pollution levels below the current European and North American standards and WHO guideline values" shortly before the WHO adjusted its guidelines.[183][184]
Cardiovascular disease
[edit]According to theGlobal Burden of Disease Study,air pollution is responsible for 19% of all cardiovascular deaths.[185][186]There is strong evidence linking both short- and long-term exposure to air pollution with cardiovascular disease mortality and morbidity, stroke, blood pressure, andischemic heartdiseases (IHD).[186]
Air pollution is a leading risk factor for stroke, particularly in developing countries where pollutant levels are highest.[187]A systematic analysis of 17 different risk factors in 188 countries found air pollution is associated with nearly one in three strokes (29%) worldwide (33.7% of strokes in developing countries versus 10.2% in developed countries).[187][188]In women, air pollution is not associated with hemorrhagic but with ischemic stroke.[189]Air pollution was found to be associated with increased incidence and mortality from coronary stroke.[190]Associations are believed to be causal and effects may be mediated by vasoconstriction, low-grade inflammation andatherosclerosis.[191]Other mechanisms such as autonomic nervous system imbalance have also been suggested.[192][193]
Lung disease
[edit]Research has demonstrated increased risk of developing asthma[194]andchronic obstructive pulmonary disease(COPD)[195]from increased exposure to traffic-related air pollution. Air pollution has been associated with increased hospitalization and mortality from asthma and COPD.[196][197]
COPD comprises a spectrum of clinical disorders that includeemphysema,bronchiectasis,andchronic bronchitis.[198]COPD risk factors are both genetic and environmental. Elevated particle pollution contributes to the exacerbation of this disease and likely its pathogenesis.[199]
The risk of lung disease from air pollution is greatest for infants and young children, whose normal breathing is faster than that of older children and adults; the elderly; those who work outside or spend a lot of time outside; and those who have heart or lung diseasecomorbidities.[200]
A study conducted in 1960–1961 in the wake of theGreat Smogof 1952 compared 293 London residents with 477 residents of Gloucester, Peterborough, and Norwich, three towns with low reported death rates from chronic bronchitis. All subjects were male postal truck drivers aged 40 to 59. Compared to the subjects from the outlying towns, the London subjects exhibited more severe respiratory symptoms (including cough, phlegm, anddyspnea), reduced lung function (FEV1and peak flow rate), and increased sputum production and purulence. The differences were more pronounced for subjects aged 50 to 59. The study controlled for age and smoking habits, so concluded that air pollution was the most likely cause of the observed differences.[201] More studies have shown that air pollution exposure from traffic reduces lung function development in children[202]and lung function may be compromised by air pollution even at low concentrations.[203]
It is believed that, much likecystic fibrosis,serious health hazards become more apparent when living in a more urban environment. Studies have shown that in urban areas people experiencemucushypersecretion, lower levels of lung function, and more self-diagnosis of chronic bronchitis and emphysema.[204]
Cancer (lung cancer)
[edit]
Around 300,000 lung cancer deaths were attributed globally in 2019 to exposure tofine particulate matter,PM2.5,suspended in the air.[207]PM2.5exposure, such as from car exhausts, activates dormant mutations in lung cells, causing them to become cancerous.[208][207]
Long-term exposure to PM2.5(fine particulates) increases the overall risk of non-accidental mortality by 6% per 10 μg/m3increase. Exposure to PM2.5is also associated with an increased risk of mortality fromlung cancer(range: 15–21% per 10 μg/m3increase) and total cardiovascular mortality (range: 12–14% per 10 μg/m3increase).[209]
The review further noted that living close to busy traffic appears to be associated with elevated risks of these three outcomes – increase in lung cancer deaths, cardiovascular deaths, and overall non-accidental deaths. The reviewers also found suggestive evidence that exposure to PM2.5is positively associated with mortality from coronary heart diseases and exposure to SO2increases mortality from lung cancer, but the data was insufficient to provide solid conclusions.[209]Another investigation showed that higher activity level increases deposition fraction of aerosol particles in human lung and recommended avoiding heavy activities like running in outdoor space at polluted areas.[210]
In 2011, a large Danish epidemiological study found an increased risk of lung cancer for people who lived in areas with high nitrogen oxide concentrations.[211]Another Danish study, likewise noted evidence of possible associations between air pollution and other forms of cancer, including cervical cancer and brain cancer.[212]
Kidney disease
[edit]A study of 163,197 Taiwanese residents over the period of 2001–2016 estimated that every 5μg/m3decrease (from an approximate peak of 30μg/m3) in the ambient concentration of PM2.5was associated with a 25% reduced risk ofchronic kidney diseasedevelopment.[213]According to a cohort study involving 10,997atherosclerosispatients, higher PM 2.5 exposure is associated with increasedalbuminuria.[214]
Fertility
[edit]Nitrogen dioxide (NO2)
[edit]An increase in NO2is significantly associated with a lowerlive birth ratein women undergoingIVFtreatment.[215]In the general population, there is a significant increase inmiscarriagerate in women exposed to NO2compared to those not exposed.[215]
Carbon monoxide (CO)
[edit]CO exposure is significantly associated withstillbirthin the second and third trimester.[215]

Polycyclic aromatic hydrocarbons
[edit]Polycyclic aromatic hydrocarbons(PAHs) have been associated with reduced fertility. Benzo(a)pyrene (BaP) is a well-known PAH and carcinogen which is often found in exhaust fumes and cigarette smoke.[216]PAHs have been reported to administer their toxic effects through oxidative stress by increasing the production ofReactive Oxygen Species(ROS) which can result in inflammation and cell death. More long-term exposure to PAHs can result inDNA damageand reduced repair.[217]
Exposure to BaP has been reported to reducesperm motilityand increasing the exposure worsens this effect. Research has demonstrated that more BaPs were found in men with reported fertility issues compared to men without.[218]
Studies have shown that BaPs can affectfolliculogenesisand ovarian development by reducing the number of ovarian germ cells via triggering cell death pathways and inducing inflammation which can lead to ovarian damage.[219]
Particulate matter
[edit]Particulate matter (PM)refers to the collection of solids and liquids suspended in the air. These can be harmful to humans, and more research has shown that these effects may be more extensive than first thought; particularly on male fertility. PM can be different sizes, such asPM2.5which are tiny particles of 2.5 microns in width or smaller, compared withPM10which are classified as 10 microns in diameter or less.
A study in California found that increased exposure to PM2.5led to decreased sperm motility and increased abnormal morphology. Similarly, in Poland exposure to PM2.5and PM10led to an increase in the percentage of cells with immaturechromatin(DNA that has not fully developed or has developed abnormally).[220]
In Turkey, a study examined the fertility of men who work as toll collectors and are therefore exposed to high levels of traffic pollutants daily. Traffic pollution often has high levels of PM10alongsidecarbon monoxideand nitrogen oxides.[220]There were significant differences insperm countand motility in this study group compared to a control group with limited air pollution exposure.
In women, while overall effects on fertility do not appear significant there is an association between increased exposure to PM10and early miscarriage. Exposure to smaller particulate matter, PM2.5,appears to have an effect on conception rates in women undergoingIVFbut does not affect live birth rates.[215]

Ground-level ozone pollution
[edit]Ground-level ozone(O3), when in high concentrations, is regarded as an air pollutant and is often found in smog in industrial areas.
There is limited research about the effect that ozone pollution has on fertility.[215]At present, there is no evidence to suggest that ozone exposure poses a deleterious effect on spontaneous fertility in either females or males. However, there have been studies which suggest that high levels of ozone pollution, often a problem in the summer months, exert an effect on in vitro fertilisation (IVF) outcomes. Within an IVF population, NOxand ozone pollutants were linked with reduced rates of live birth.[215]
While most research on this topic is focused on the direct human exposure of air pollution, other studies have analysed the impact of air pollution on gametes and embryos within IVF laboratories. Multiple studies have reported a marked improvement inembryo quality,implantationand pregnancy rates after IVF laboratories have implemented air filters in a concerted effort to reduce levels of air pollution.[221]Therefore, ozone pollution is considered to have a negative impact on the success ofassisted reproductive technologies(ART) when occurring at high levels.
Ozone is thought to act in a biphasic manner where a positive effect on live birth is observed when ozone exposure is limited to before IVF embryo implantation. Conversely, a negative effect is demonstrated upon exposure to ozone after embryo implantation. However, after adjusting for NO2, the association between O3 and IVF live birth rate was no longer significant.[222][223]
In terms of male fertility, ozone is reported to cause a significant decrease in the concentration and count of sperm in semen after exposure.[224]Similarly, sperm vitality, the proportion of live spermatozoa in a sample, was demonstrated to be diminished as a result of exposure to air pollution.[223]However, findings on the effect of ozone exposure on male fertility are somewhat discordant, highlighting the need for further research.[223]
Children
[edit]Children and infants are among the most vulnerable to air pollution. Polluted air leads to the poisoning of millions of children under the age of 15, resulting in the death of some 600,000 children annually (543,000 under 5 years of age and 52,000 aged 5-15 years).[225]Children in low or middle income countries are exposed to higher levels of fine particulate matter than those in high income countries.[225]
Health effects of air pollution on children include asthma, pneumonia and lower respiratory tract infections and low birth weight.[226]A study in Europe found that exposure toultrafineparticles can increase blood pressure in children.[227]
Prenatal exposure
[edit]Prenatal exposure to polluted air has been linked to a variety ofneurodevelopmental disordersin children. For example, exposure topolycyclic aromatic hydrocarbons(PAH) was associated with reduced IQ scores and symptoms ofanxietyanddepression.[228]They can also lead to detrimentalperinatalhealth outcomes that are often fatal in developing countries.[8]A 2014 study found that PAHs might play a role in the development of childhoodattention deficit hyperactivity disorder(ADHD).[229]
Researchers have found a correlation between air pollution and risk ofautism spectrum disorder(ASD) diagnosis, although definitive causality has not yet been established. In Los Angeles, children living in areas with high levels of traffic-related air pollution were more likely to be diagnosed with autism between three–five years of age.[230]A cohort study in Southern California linked in-utero exposure to near-roadway air pollution to an increased risk of ASD diagnosis[231]and a study in Sweden concluded that exposure to PM2.5during pregnancy was associated with ASD.[232]A Danish study linked exposure to air pollution during infancy, but not during pregnancy, to an increased risk of ASD diagnosis.[233]
The connection between air pollution and neurodevelopmental disorders in children is thought to be related to epigenetic dysregulation of the primordial germ cells, embryo, and fetus during a critical period. Some PAHs are considered endocrine disruptors and are lipid soluble. When they build up in adipose tissue they can be transferred across the placenta can exert agenotoxiceffect, cauding DNA damange and mutations.[234]Air pollution has been associated with the prevalence of preterm births.[235]
Infants
[edit]Ambient levels of air pollution have been associated withpreterm birthandlow birth weight.A 2014 WHO worldwide survey on maternal and perinatal health found a statistically significant association between low birth weights (LBW) and increased levels of exposure to PM2.5.Women in regions with greater than average PM2.5levels had statistically significant higher odds of pregnancy resulting in a low-birth weight infant even when adjusted for country-related variables.[236]The effect is thought to be from stimulatinginflammationand increasingoxidative stress.
A study found that in 2010 exposure to PM2.5was strongly associated with 18% of preterm births globally, which was approximately 2.7 million premature births. The countries with the highest air pollution associated preterm births were in South and East Asia, the Middle East, North Africa, and West sub-Saharan Africa.[237]In 2019, ambient particulate matter pollution in Africa resulted in at least 383,000 early deaths, according to new estimates of the cost of air pollution in the continent. This increased from 3.6% in 1990 to around 7.4% of all premature deaths in the area.[238][239][240]
The source of PM2.5differs greatly by region. In South and East Asia, pregnant women are frequently exposed to indoor air pollution because of wood and otherbiomassfuels being used for cooking, which are responsible for more than 80% of regional pollution. In the Middle East, North Africa and West sub-Saharan Africa, fine PM comes from natural sources, such asdust storms.[237]The United States had an estimated 50,000 preterm births associated with exposure to PM2.5in 2010.[237]
A study between 1988 and 1991 found a correlation betweensulfur dioxide(SO2) and total suspended particulates (TSP) and preterm births and low birth weights in Beijing. A group of 74,671 pregnant women, in four separate regions of Beijing, were monitored from early pregnancy to delivery along with daily air pollution levels of SO2and TSP (along with other particulates). The estimated reduction in birth weight was 7.3 g for every 100 μg/m3increase inSO2and 6.9 g for each 100 μg/m3increase in TSP. These associations were statistically significant in both summer and winter, although summer was greater. The proportion of low birth weight attributable to air pollution, was 13%. This is the largest attributable risk ever reported for the known risk factors of low birth weight.[241]Coal stoves, which are in 97% of homes, are a major source of air pollution in this area.
Brauer et al. studied the relationship between air pollution and proximity to a highway with pregnancy outcomes in a Vancouver cohort of pregnant women using addresses to estimate exposure during pregnancy. Exposure to NO, NO2,CO, PM10and PM2.5were associated with infants born small for gestational age (SGA). Women living less than 50 meters away from an expressway or highway were 26% more likely to give birth to a SGA infant.[242]
Central nervous system
[edit]Data is accumulating that air pollution exposure also affects thecentral nervous system.[243]
Air pollution increases the risk of dementia in people over 50 years old.[244]Indoor air pollution exposure during childhood may negatively affect cognitive function and neurodevelopment.[245][246]Prenatal exposuremay also affect neurodevelopment.[247][248]Studies show that air pollution is associated with a variety of developmental disabilities, oxidative stress, andneuro-inflammationand that it may contribute to Alzheimer's disease and Parkinson's disease.[246]
Researchers found that early exposure to air pollution causes the same changes in the brain asautismandschizophreniain mice. It also showed that air pollution also affectedshort-term memory,learning ability, andimpulsivity.In this study, air pollution had a larger negative impact on male mice than on females.[249][250]Lead researcher on the study, Deborah Cory-Slechta, said that:[251]
When we looked closely at theventricles,we could see that thewhite matterthat normally surrounds them hadn't fully developed. It appears thatinflammationhad damaged thosebrain cellsand prevented that region of the brain from developing, and the ventricles simply expanded to fill the space. Our findings add to the growing body of evidence that air pollution may play a role in autism, as well as in otherneurodevelopmental disorders.
Exposure to fine particulate matter can increase levels ofcytokines- neurotransmitters produced in response to infection and inflammation that are also associated with depression and suicide. Pollution has been associated with inflammation of the brain, which may disrupt mood regulation. Heightened PM2.5levels are linked to more self-reported depressive symptoms, and increases in daily suicide rates.[252][253]
In 2015, experimental studies reported the detection of significant episodic (situational) cognitive impairment from impurities in indoor air breathed by test subjects who were not informed about changes in the air quality. Significant deficits were observed in the performance scores achieved in increasing concentrations of eithervolatile organic compounds(VOCs) or carbon dioxide, while keeping other factors constant. The highest impurity levels reached are not uncommon in some classroom or office environments.[254][255]Higher PM2.5and CO2concentrations were shown to be associated with slower response times and reduced accuracy in tests.[256]

"Clean" areas
[edit]
Even in areas with relatively low levels of air pollution, public health effects can be significant and costly, since a large number of people breathe in such pollutants. A study found that even in areas of the U.S. where ozone and PM2.5meet federal standards,Medicarerecipients who are exposed to more air pollution have higher mortality rates.[257]
Rural populations in India, like those in urban areas, are also exposed to high levels of air pollution.[258]In 2020, scientists found that theboundary layer airover the Southern Ocean around Antarctica is 'unpolluted' by humans.[259]
Agricultural effects
[edit]Various studies have estimated the impacts of air pollution on agriculture, especially ozone. A 2020 study showed that ozone pollution in California may reduce yields of certain perennial crops such as table grapes by as much as 22% per year, translating into economic damages of more than $1 billion per year.[260]After air pollutants enter the agricultural environment, they not only directly affect agricultural production and quality, but also enter agricultural waters and soil.[261]The COVID-19 induced lockdown served as a natural experiment to expose the close links between air quality and surface greenness. In India, the lockdown induced improvement in air quality, enhanced surface greenness and photosynthetic activity, with the positive response of vegetation to reduce air pollution was dominant in croplands.[262]On the other hand, agriculture in its traditional form is one of the primary contributors to the emission of trace gases like atmospheric ammonia.[263]
Economic effects
[edit]Air pollution costs theworld economy$5 trillion per year as a result of productivity losses and degraded quality of life.[24][25][26]These productivity losses are caused by deaths due to diseases caused by air pollution. One out of ten deaths in 2013 was caused by diseases associated with air pollution and the problem is getting worse.
A small improvement in air quality (1% reduction of ambient PM2.5and ozone concentrations) would produce $29 million in annual savings in the lowerFraser Valleyregion in 2010.[264]This finding is based on health valuation of lethal (death) and sub-lethal (illness) affects.
The problem is even more acute in thedeveloping world."Children under age 5 in lower-income countries are more than 60 times as likely to die from exposure to air pollution as children in high-income countries."[24][25]The report states that additional economic losses caused by air pollution, including health costs[265]and the adverse effect on agricultural and other productivity were not calculated in the report, and thus the actual costs to the world economy are far higher than $5 trillion.
A study published in 2022 found "a strong and significant connection between air pollution and construction site accidents" and that "a 10-ppb increase in NO2levels increases the likelihood of an accident by as much as 25% ".[266]
Other effects
[edit]Artificial air pollution may be detectable on Earth from distant vantage points such as other planetary systems viaatmospheric SETI– including NO2pollution levels and with telescopic technology close to today. It may also be possible to detect extraterrestrial civilizations this way.[267][268][269]
Historical disasters
[edit]The world's worst short-term civilian pollution crisis was the 1984Bhopal Disasterin India.[270]Leaked industrial vapours from the Union Carbide factory, belonging to Union Carbide, Inc., U.S.A. (later bought byDow Chemical Company), killed at least 3787 people and injured from 150,000 to 600,000. The United Kingdom suffered its worst air pollution event when the 4 DecemberGreat Smogof 1952 formed over London. In six days more than 4,000 died and more recent estimates put the figure at nearer 12,000.[271]
Anaccidental leak of anthraxspores from abiological warfarelaboratory in the former USSR in 1979 near Yekaterinburg (formerly Sverdlovsk) is believed to have caused at least 64 deaths.[272]The worst single incident of air pollution to occur in the US occurred inDonora, Pennsylvania,in late October 1948, when 20 people died and over 7,000 were injured.[273]
Reduction and regulation
[edit]Global depletion of the surrounding air pollution will require valiant leadership, a surplus of combined resources from the international community, and extensive societal changes.[274]Pollution prevention seeks to prevent pollution such as air pollution and could include adjustments to industrial and business activities such asdesigning sustainable manufacturing processes (and the products' designs)[275]and related legal regulations as well as efforts towardsrenewable energy transitions.[276][277]
Efforts to reduce particulate matter in the air may result in better health.[278]
The9-Euro-Ticketscheme in Germany which allowed people to buy a monthly pass allowing use on all local and regional transport (trains, trams and busses) for 9 euro (€) for one month of unlimited travel saved 1.8 million tons of CO2emissions during its three-month implementation from June to August 2022.[279]
Pollution control
[edit]
Various pollution control technologies and strategies are available to reduce air pollution.[280][281]At its most basic level,land-use planningis likely to involve zoning and transport infrastructure planning. In most developed countries, land-use planning is an important part of social policy, ensuring that land is used efficiently for the benefit of the wider economy and population, as well as to protect the environment.[282]Stringent environmental regulations, effective control technologies and shift towards the renewable source of energy also helping countries like China and India to reduce their sulfur dioxide pollution.[283]
Titanium dioxidehas been researched for its ability to reduce air pollution.Ultravioletlight will release free electrons from material, thereby creating free radicals, which break up VOCs andNOxgases. One form issuperhydrophilic.[284]
Pollution-eatingnanoparticlesplaced near a busy road were shown to absorb toxic emission from around 20 cars each day.[285]
Energy transition
[edit]Since a large share of air pollution is caused by combustion of fossil fuels such as coal and oil, the reduction of these fuels can reduce air pollution drastically. Most effective is the switch to clean power sources such aswind power,solar power,hydro powerwhich do not cause air pollution.[286]Efforts to reduce pollution from mobile sources includes expanding regulation to new sources (such as cruise and transport ships, farm equipment, and small gas-powered equipment such asstring trimmers,chainsaws,andsnowmobiles), increasedfuel efficiency(such as through the use ofhybrid vehicles), conversion to cleaner fuels, and conversion toelectric vehicles.For example, buses in New Delhi, India, have run oncompressed natural gassince 2000, to help eliminate the city's "pea-soup" smog.[226][287]
A very effective means to reduce air pollution is thetransitiontorenewable energy.According to a study published inEnergy and Environmental Sciencein 2015 the switch to100% renewable energyin the United States would eliminate about 62,000 premature mortalities per year and about 42,000 in 2050, if no biomass were used. This would save about $600 billion in health costs a year due to reduced air pollution in 2050, or about 3.6% of the 2014 U.S. gross domestic product.[286]Air quality improvement is a near-term benefit among the many societal benefits fromclimate change mitigation.
Alternatives to pollution
[edit]

There are now practical alternatives to the principal causes of air pollution:
- Strategic substitution of air pollution sources in transport with lower-emission or, during the lifecycle, emission-free forms ofpublic transport[288][289]andbicycle use and infrastructure(as well as with remote work, reductions of work, relocations, andlocalizations)
- Phase-out of fossil fuel vehiclesis a critical component of a shift tosustainable transport;however, similar infrastructure and design decisions like electric vehicles may be associated with similar pollution for production as well as mining and resource exploitation for large numbers of needed batteries as well as the energy for their recharging[290][291]
- Areas downwind (over 20 miles) of major airports have more than doubletotal particulate emissions in airthan other areas, even when factoring in areas with frequent ship calls, and heavy freeway and city traffic like Los Angeles.[292]Aviation biofuelmixed in with jetfuel at a 50/50 ratio can reduce jet derived cruise altitude particulate emissions by 50–70%, according to aNASAled 2017 study (however, this should imply ground level benefits to urban air pollution as well).[293]
- Ship propulsion and idling can be switched to much cleaner fuels like natural gas. (Ideally arenewable sourcebut not practical yet)
- Combustion of fossil fuels for space heating can be replaced by usingground source heat pumpsandseasonal thermal energy storage.[294]
- Electricity generated from the combustion of fossil fuels can be replaced by nuclear and renewable energy. Heating and home stoves, which contribute significantly to regional air pollution, can be replaced with a much cleaner fossil fuel, such as natural gas, or, preferably, renewables, in poor countries.[295][296]
- Motor vehicles driven by fossil fuels, a key factor in urban air pollution, can be replaced by electric vehicles. Though lithium supply and cost is a limitation, there are alternatives. Herding more people into clean public transit such as electric trains can also help. Nevertheless, even in emission-free electric vehicles,rubber tires produce significant amounts of air pollutionthemselves, ranking as 13th worst pollutant in Los Angeles.[297]
- Reducing travel in vehicles can curb pollution. After Stockholm reduced vehicle traffic in the central city with a congestion tax, nitrogen dioxide and PM10pollution declined, as did acute pediatric asthma attacks.[298]
- Biodigesterscan be utilized in poor nations whereslash and burnis prevalent, turning a useless commodity into a source of income. The plants can be gathered and sold to a central authority that will break them down in a large modern biodigester, producing much needed energy to use.[299]
- Induced humidity and ventilation both can greatly dampen air pollution in enclosed spaces, which was found to be relatively high inside subway lines due to braking and friction and relatively less ironically inside transit buses than lower sitting passenger automobiles or subways.[300]
Control devices
[edit]

The following items are commonly used as pollution control devices in industry and transportation. They can either destroy contaminants or remove them from an exhaust stream before it is emitted into the atmosphere.
- Particulate control
- Mechanical collectors (dust cyclones,multicyclones)
- Electrostatic precipitators:An electrostatic precipitator (ESP), or electrostatic air cleaner, is a particulate collection device that removes particles from a flowing gas (such as air), using the force of an induced electrostatic charge. Electrostatic precipitators are highly efficient filtration devices that minimally impede the flow of gases through the device, and can easily remove fine particulates such as dust and smoke from the air stream.
- Baghouses:Designed to handle heavy dust loads, a dust collector consists of a blower, dust filter, a filter-cleaning system, and a dust receptacle or dust removal system (distinguished from air cleaners which utilize disposable filters to remove the dust).
- Particulate scrubbers:A wet scrubber is a form of pollution control technology. The term describes a variety of devices that use pollutants from a furnace flue gas or from other gas streams. In a wet scrubber, the polluted gas stream is brought into contact with the scrubbing liquid, by spraying it with the liquid, by forcing it through a pool of liquid, or by some other contact method, so as to remove the pollutants.
- Scrubbers
- NOxcontrol
- LO-NOx burners
- Selective catalytic reduction(SCR)
- Selective non-catalytic reduction(SNCR)
- NOx scrubbers
- Exhaust gas recirculation
- Catalytic converter(also for VOC control)
- VOC abatement
- Acid gas/SO2control
- Mercurycontrol
- Sorbent injection technology
- Electro-catalytic oxidation (ECO)
- K-Fuel
- Dioxinandfurancontrol
- Miscellaneous associated equipment
- Source capturing systems
- Continuous emissions monitoring systems(CEMS)
Monitoring
[edit]Spatiotemporalmonitoring of air quality may be necessary for improving air quality, and thereby the health and safety of the public, and assessing impacts of interventions.[301]Such monitoring is done to different extents with different regulatory requirements with discrepant regional coverage by a variety of organizations and governance entities such as using a variety of technologies for use of the data and sensing such mobileIoTsensors,[302][303]satellites,[304][305][306]and monitoring stations.[307][308]Some websites attempt to map air pollution levels using available data.[309][310][311]
Air quality modeling
[edit]Numerical models either on a global scale using tools such as GCMs (general circulation modelscoupled with a pollution module) or CTMs (Chemical transport model) can be used to simulate the levels of different pollutants in the atmosphere. These tools can have several types (Atmospheric model) and different uses. These models can be used in forecast mode which can help policy makers to decide on appropriate actions when an air pollution episode is detected. They can also be used for climate modeling including evolution of air quality in the future, for example the IPCC (Intergovernmental Panel on Climate Change) provides climate simulations including air quality assessments in their reports (latest report accessible through theirsite).
Regulations
[edit]
In general, there are two types of air quality standards. The first class of standards (such as the U.S.National Ambient Air Quality Standardsand E.U. Air Quality Directive[312]) set maximum atmospheric concentrations for specific pollutants. Environmental agencies enact regulations which are intended to result in attainment of these target levels. The second class (such as the North Americanair quality index) take the form of a scale with various thresholds, which is used to communicate to the public the relative risk of outdoor activity. The scale may or may not distinguish between different pollutants.
Canada
[edit]In Canada, air pollution and associated health risks are measured with theAir Quality Health Index(AQHI).[313]It is a health protection tool used to make decisions to reduce short-term exposure to air pollution by adjusting activity levels during increased levels of air pollution.
The AQHI is a federal program jointly coordinated byHealth CanadaandEnvironment Canada.However, the AQHI program would not be possible without the commitment and support of the provinces, municipalities andNGOs.From air quality monitoring to healthrisk communicationand community engagement, local partners are responsible for the vast majority of work related to AQHI implementation. The AQHI provides a number from 1 to 10+ to indicate the level of health risk associated with local air quality. Occasionally, when the amount of air pollution is abnormally high, the number may exceed 10. The AQHI provides a local air quality current value as well as a local air quality maximums forecast for today, tonight and tomorrow and provides associated health advice.
| 1 | 2 | 3 | 4 | 5 | 6 | 7 | 8 | 9 | 10 | + |
| Risk: | Low(1–3) | Moderate(4–6) | High(7–10) | Very high(above 10) |
As it is now known that even low levels of air pollution can trigger discomfort for the sensitive population, the index has been developed as a continuum: The higher the number, the greater the health risk and need to take precautions. The index describes the level of health risk associated with this number as 'low', 'moderate', 'high' or 'very high', and suggests steps that can be taken to reduce exposure.[314]
| Health risk | Air Quality Health Index | Health messages[315] | |
|---|---|---|---|
| At risk population | General population | ||
| Low | 1–3 | Enjoyyour usual outdoor activities. | Idealair quality for outdoor activities |
| Moderate | 4–6 | Consider reducingor rescheduling strenuous activities outdoors if you are experiencing symptoms. | No need to modifyyour usual outdoor activities unless you experience symptoms such as coughing and throat irritation. |
| High | 7–10 | Reduceor reschedule strenuous activities outdoors. Children and the elderly should also take it easy. | Consider reducingor rescheduling strenuous activities outdoors if you experience symptoms such as coughing and throat irritation. |
| Very high | Above 10 | Avoidstrenuous activities outdoors.Childrenand theelderlyshould also avoid outdoor physical exertion and should stay indoors. | Reduceor reschedule strenuous activities outdoors, especially if you experience symptoms such as coughing and throat irritation. |
The measurement is based on the observed relationship ofnitrogen dioxide(NO2), ground-level ozone (O3) and particulates (PM2.5) with mortality, from an analysis of several Canadian cities. Significantly, all three of these pollutants can pose health risks, even at low levels of exposure, especially among those with pre-existing health problems.
When developing the AQHI, Health Canada's original analysis of health effects included five major air pollutants: particulates,ozone,andnitrogen dioxide(NO2), as well assulfur dioxide(SO2), andcarbon monoxide(CO). The latter two pollutants provided little information in predicting health effects and were removed from the AQHI formulation.
The AQHI does not measure the effects of odour, pollen, dust, heat or humidity.
Germany
[edit]TA Luftis the German air quality regulation.[316]
Governing urban air pollution
[edit]In Europe, Council Directive 96/62/EC on ambient air quality assessment and management provides a common strategy against whichmember statescan "set objectives for ambient air quality in order to avoid, prevent or reduce harmful effects on human health and the environment... and improve air quality where it is unsatisfactory".[317]
In July 2008, in the caseDieter Janecek v. Freistaat Bayern,theEuropean Court of Justiceruled that under this directive[317]citizens have the right to require national authorities to implement a short term action plan that aims to maintain or achieve compliance to air quality limit values.[318][319]
This important case law appears to confirm the role of the EC as centralised regulator to European nation-states as regards air pollution control. It places asupranationallegal obligation on the UK to protect its citizens from dangerous levels of air pollution, furthermore superseding national interests with those of the citizen.
In 2010, theEuropean Commission(EC) threatened the UK with legal action against the successive breaching ofPM10limit values.[320]The UK government has identified that if fines are imposed, they could cost the nation upwards of £300 million per year.[321]
In March 2011, the Greater London Built-up Area remained the only UK region in breach of the EC's limit values, and was given three months to implement an emergency action plan aimed at meeting the EU Air Quality Directive.[322]The City of London has dangerous levels of PM10concentrations, estimated to cause 3000 deaths per year within the city.[323]As well as the threat of EU fines, in 2010 it was threatened with legal action for scrapping the westerncongestion chargezone, which is claimed to have led to an increase in air pollution levels.[324]
In response to these charges, mayor of LondonBoris Johnsonhas criticised the current need for European cities to communicate with Europe through their nation state'scentral government,arguing that in future "A great city like London" should be permitted to bypass its government and deal directly with the European Commission regarding its air quality action plan.[322]
This can be interpreted as recognition that cities can transcend the traditional national government organisational hierarchy and develop solutions to air pollution using global governance networks, for example through transnational relations. Transnational relations include but are not exclusive to national governments and intergovernmental organisations,[325]allowing sub-national actors including cities and regions to partake in air pollution control as independent actors.
Global city partnerships can be built into networks, for example theC40 Cities Climate Leadership Group,of which London is a member. The C40 is a public 'non-state' network of the world's leading cities that aims to curb their greenhouse emissions.[326]The C40 has been identified as 'governance from the middle' and is an alternative to intergovernmental policy.[327]It has the potential to improve urban air quality as participating cities "exchange information, learn from best practices and consequently mitigate carbon dioxide emissions independently from national government decisions".[326]A criticism of the C40 network is that its exclusive nature limits influence to participating cities and risks drawing resources away from less powerful city and regional actors.
Indigenous people
[edit]Because Indigenous people[328]frequently experience a disproportionate share of the effects of environmental degradation and climate change, even while they have made very little contribution to the processes causing these changes, environmental justice is especially important to them. Indigenous peoples have been marginalized and their lands and resources have been exploited as a result of historical and continuing colonization, institutional injustices, and inequality.
Indigenous groups frequently lack the political and financial clout to influence policy decisions that impact their lands and means of subsistence or to lessen the effects of climate change. This makes the already-existing inequalities in these communities' social, economic, and health conditions worse. Furthermore, traditional ecological knowledge and Indigenous knowledge systems provide insightful information about sustainable resource management and climate change adaptation techniques. To promote persistence and environmental justice, Indigenous viewpoints must be acknowledged and integrated into efforts to mitigate the effects of climate change and adapt to them.
Combating climate change necessitates an all-encompassing strategy that recognizes the interdependence of social, economic, and environmental elements. This entails defending treaty rights, advancing Indigenous sovereignty and self-determination, and aiding Indigenous-led projects for sustainable development and environmental preservation.
Hotspots
[edit]Air pollution hotspots are areas where air pollution emissions expose individuals to increased negative health effects.[329]They are particularly common in highly populated, urban areas, where there may be a combination of stationary sources (e.g. industrial facilities) and mobile sources (e.g. cars and trucks) of pollution. Emissions from these sources can causerespiratory disease,childhoodasthma,[141]cancer,and other health problems. Fine particulate matter such asdiesel soot,which contributes to more than 3.2 million premature deaths around the world each year, is a significant problem. It is very small and can lodge itself within the lungs and enter the bloodstream. Diesel soot is concentrated in densely populated areas, and one in six people in the U.S. live near a diesel pollution hot spot.[330]
| External videos | |
|---|---|
While air pollution hotspots affect a variety of populations, some groups are more likely to be located in hotspots. Previous studies have shown disparities in exposure to pollution by race and/or income.Hazardousland uses (toxic storage and disposal facilities, manufacturing facilities, major roadways) tend to be located where property values and income levels are low. Lowsocioeconomicstatus can be a proxy for other kinds ofsocial vulnerability,including race, a lack of ability to influence regulation and a lack of ability to move to neighborhoods with less environmental pollution. These communities bear a disproportionate burden of environmental pollution and are more likely to face health risks such ascancerorasthma.[332]
Studies show that patterns in race and income disparities not only indicate a higher exposure to pollution but also higher risk of adverse health outcomes.[333]Communities characterized by lowsocioeconomicstatus and racial minorities can be more vulnerable to cumulative adverse health impacts resulting from elevated exposure to pollutants than more privileged communities.[333]Blacks and Latinos generally face more pollution than Whites and Asians, and low-income communities bear a higher burden of risk than affluent ones.[332]Racial discrepancies are particularly distinct in suburban areas of the Southern United States and metropolitan areas of the Midwestern and Western United States.[334]Residents in public housing, who are generally low-income and cannot move to healthier neighborhoods, are highly affected by nearbyrefineriesand chemical plants.[335]
Cities
[edit]
Air pollution is usually concentrated in densely populatedmetropolitan areas,especially in developing countries where cities are experiencing rapid growth and environmental regulations are relatively lax or nonexistent. Urbanization leads to a rapid rise in prematuremortalitydue to anthropogenic air pollution in fast-growing tropical cities.[336]However, even populated areas in developed countries attain unhealthy levels of pollution, with Los Angeles and Rome being two examples.[337]Between 2002 and 2011 the incidence of lung cancer in Beijing near doubled. While smoking remains the leading cause of lung cancer in China, the number of smokers is falling while lung cancer rates are rising.[338]
| World's Most Polluted Cities 2020 | 2020 Average | 2019 Average |
|---|---|---|
| Hotan, China | 110.2 | 110.1 |
| Ghaziabad, India | 106.6 | 110.2 |
| Bulandshahr, India | 98.4 | 89.4 |
| Bisrakh Jalalpur, India | 96.0 | - |
| Bhiwadi, India | 95.5 | 83.4 |
Tehran was declared the most polluted city in the world on May 24, 2022.[340]
Projections
[edit]In a 2019 projection, by 2030 half of the world's pollution emissions could be generated by Africa.[341]Potential contributors to such an outcome include increased burning activities (such as the burning of open waste), traffic, agri-food and chemical industries, sand dust from the Sahara, and overallpopulation growth.
In a 2012 study, by 2050 outdoor air pollution (particulate matter and ground-level ozone) is projected to become the top cause of environmentally related deaths worldwide.[342]
See also
[edit]Source
- Beehive burner
- Bottom ash
- Concrete#Concrete – health and safety
- Diwali-related air pollution
- Flue-gas emissions from fossil-fuel combustion
- Health impacts of sawdust
- Joss paper
- Metal working
- Mining
- Non-exhaust emissions
- Power tool
- Rubber pollution
- Slag
- Smelting
- Tire fire
- Welding
- Wood ash
Measurement
- Air pollutant concentrations
- Air pollution measurement
- Organic molecular tracers
- Intake fraction
- Particulate matter sampler
Others
- Air stagnation
- ASEAN Agreement on Transboundary Haze Pollution
- Asian brown cloud
- Atmospheric chemistry
- BenMAP
- Best Available Control Technology
- Critical load
- Emission standard
- Emissions & Generation Resource Integrated Database
- Environmental agreement
- Environmental racism
- Exposome
- Global Atmosphere Watch
- Global dimming
- Great Smogof London
- Haze
- Health Effects Institute(HEI)
- Indicator value
- International Agency for Research on Cancer
- International Day of Clean Air for Blue Skies
- Kyoto Protocol
- Light water reactor sustainability
- List of smogs by death toll
- Lowest Achievable Emissions Rate
- NASA Clean Air Study
- NIEHS
- Phytoremediation
- Polluter pays principle
- Regulation of greenhouse gases under the Clean Air Act
- Silicosis#Prevention
References
[edit]- ^abc"Air pollution".www.who.int.Retrieved14 January2023.
- ^abManisalidis I, Stavropoulou E, Stavropoulos A, Bezirtzoglou E (2020)."Environmental and Health Impacts of Air Pollution: A Review".Frontiers in Public Health.8:14.doi:10.3389/fpubh.2020.00014.ISSN2296-2565.PMC7044178.PMID32154200.
- ^Howell R,Pickerill J(2016). "The Environment and Environmentalism". In Daniels P,Bradshaw M,Shaw D, Sidaway J, Hall T (eds.).An Introduction To Human Geography(5th ed.).Pearson.p. 134.ISBN978-1-292-12939-6.
- ^Dimitriou A, Christidou V (26 September 2011), Khallaf M (ed.),"Causes and Consequences of Air Pollution and Environmental Injustice as Critical Issues for Science and Environmental Education",The Impact of Air Pollution on Health, Economy, Environment and Agricultural Sources,InTech,doi:10.5772/17654,ISBN978-953-307-528-0,retrieved31 May2022
- ^abcdef"7 million premature deaths annually linked to air pollution".WHO.25 March 2014.Retrieved25 March2014.
- ^Allen JL, Klocke C, Morris-Schaffer K, Conrad K, Sobolewski M, Cory-Slechta DA (June 2017)."Cognitive Effects of Air Pollution Exposures and Potential Mechanistic Underpinnings".Current Environmental Health Reports.4(2): 180–191.Bibcode:2017CEHR....4..180A.doi:10.1007/s40572-017-0134-3.ISSN2196-5412.PMC5499513.PMID28435996.
- ^Newbury JB, Stewart R, Fisher HL, Beevers S, Dajnak D, Broadbent M, et al. (2021)."Association between air pollution exposure and mental health service use among individuals with first presentations of psychotic and mood disorders: retrospective cohort study".The British Journal of Psychiatry.219(6) (published 19 August 2021): 678–685.doi:10.1192/bjp.2021.119.ISSN0007-1250.PMC8636613.PMID35048872.
- ^abGhosh R, Causey K, Burkart K, Wozniak S, Cohen A, Brauer M (28 September 2021)."Ambient and household PM2.5 pollution and adverse perinatal outcomes: A meta-regression and analysis of attributable global burden for 204 countries and territories".PLOS Medicine.18(9): e1003718.doi:10.1371/journal.pmed.1003718.ISSN1549-1676.PMC8478226.PMID34582444.
- ^Dominski FH, Lorenzetti Branco JH, Buonanno G, Stabile L, Gameiro da Silva M, Andrade A (October 2021). "Effects of air pollution on health: A mapping review of systematic reviews and meta-analyses".Environmental Research.201:111487.Bibcode:2021ER....20111487D.doi:10.1016/j.envres.2021.111487.ISSN0013-9351.PMID34116013.
- ^Lee KK, Bing R, Kiang J, Bashir S, Spath N, Stelzle D, et al. (November 2020)."Adverse health effects associated with household air pollution: a systematic review, meta-analysis, and burden estimation study".The Lancet Global Health.8(11): e1427–e1434.doi:10.1016/S2214-109X(20)30343-0.ISSN2214-109X.PMC7564377.PMID33069303.
- ^Stanek LW, Brown JS, Stanek J, Gift J, Costa DL (2011)."Air Pollution Toxicology—A Brief Review of the Role of the Science in Shaping the Current Understanding of Air Pollution Health Risks".Toxicological Sciences.120:S8–S27.doi:10.1093/toxsci/kfq367.PMID21147959.Retrieved7 November2022.
- ^Majumder N, Kodali V, Velayutham M, Goldsmith T, Amedro J, Khramtsov VV, et al. (2022)."Aerosol physicochemical determinants of carbon black and ozone inhalation co-exposure induced pulmonary toxicity".Toxicological Sciences.191(1): 61–78.doi:10.1093/toxsci/kfac113.PMC9887725.PMID36303316.
- ^Daniel A. Vallero (2014).Fundamentals of Air Pollution.Academic Press. pp. 43, 122, 215.ISBN978-0-12-404602-3.
- ^abcdFuller R, Landrigan PJ, Balakrishnan K, Bathan G, Bose-O'Reilly S, Brauer M, et al. (June 2022). "Pollution and health: a progress update".The Lancet Planetary Health.6(6): e535–e547.doi:10.1016/S2542-5196(22)00090-0.PMID35594895.S2CID248905224.
- ^Juginović A, Vuković M, Aranza I, Biloš V (18 November 2021)."Health impacts of air pollution exposure from 1990 to 2019 in 43 European countries".Scientific Reports.11(1): 22516.Bibcode:2021NatSR..1122516J.doi:10.1038/s41598-021-01802-5.eISSN2045-2322.PMC8602675.PMID34795349.
- ^abLelieveld J, Pozzer A, Pöschl U, Fnais M, Haines A, Münzel T (1 September 2020)."Loss of life expectancy from air pollution compared to other risk factors: a worldwide perspective".Cardiovascular Research.116(11): 1910–1917.doi:10.1093/cvr/cvaa025.ISSN0008-6363.PMC7449554.PMID32123898.
- ^"Energy and Air Pollution"(PDF).Iea.org.Archived fromthe original(PDF)on 11 October 2019.Retrieved12 March2019.
- ^"Study Links 6.5 Million Deaths Each Year to Air Pollution".The New York Times.26 June 2016.Retrieved27 June2016.
- ^Lelieveld J, Klingmüller K, Pozzer A, Burnett RT, Haines A, Ramanathan V (25 March 2019)."Effects of fossil fuel and total anthropogenic emission removal on public health and climate".Proceedings of the National Academy of Sciences of the United States of America.116(15): 7192–7197.Bibcode:2019PNAS..116.7192L.doi:10.1073/pnas.1819989116.PMC6462052.PMID30910976.S2CID85515425.
- ^Silva RA, West JJ, Zhang Y, Anenberg SC, Lamarque JF, Shindell DT, et al. (2013)."Global premature mortality due to anthropogenic outdoor air pollution and the contribution of past climate change".Environmental Research Letters.8(3): 034005.Bibcode:2013ERL.....8c4005S.doi:10.1088/1748-9326/8/3/034005.
- ^ab"9 out of 10 people worldwide breathe polluted air, but more countries are taking action".World Health Organization.2 May 2018.Retrieved18 May2021.
- ^"Cheap air pollution monitors help plot your walk".European Investment Bank.Retrieved18 May2021.
- ^"Assessing the risks to health from air pollution".www.eea.europa.eu.European Environment Agency.Retrieved18 May2021.
- ^abcWorld Bank,Institute for Health Metrics and Evaluation at University of Washington – Seattle (2016).The Cost of Air Pollution: Strengthening the Economic Case for Action(PDF).Washington, D.C.:The World Bank.xii.
- ^abcMcCauley L (8 September 2016)."Making Case for Clean Air, World Bank Says Pollution Cost Global Economy $5 Trillion".Common Dreams.Retrieved3 February2018.
- ^ab"The Rising Cost of Smog".Fortune:15. 1 February 2018.ISSN0015-8259.
- ^Batool R, Zaman K, Khurshid MA, Sheikh SM, Aamir A, Shoukry AM, et al. (October 2019). "Economics of death and dying: a critical evaluation of environmental damages and healthcare reforms across the globe".Environmental Science and Pollution Research International.26(29): 29799–29809.Bibcode:2019ESPR...2629799B.doi:10.1007/s11356-019-06159-x.ISSN1614-7499.PMID31407261.S2CID199528114.
- ^Bherwani H, Nair M, Musugu K, Gautam S, Gupta A, Kapley A, et al. (10 June 2020)."Valuation of air pollution externalities: comparative assessment of economic damage and emission reduction under COVID-19 lockdown".Air Quality, Atmosphere & Health.13(6): 683–694.Bibcode:2020AQAH...13..683B.doi:10.1007/s11869-020-00845-3.ISSN1873-9318.PMC7286556.PMID32837611.
- ^Boubel R, Vallero D, Fox D, Turner B, Stern A (2013).Fundamentals of Air Pollution(Third ed.). Elsevier. pp. 447–522.ISBN9780080507071.Retrieved10 April2024.
- ^Regulating Air Quality: The First Global Assessment of Air Pollution Legislation.Nairobi, Kenya: United Nations Environment Programme. 2021.ISBN978-92-807-3872-8.Retrieved10 April2024.
- ^Brimblecombe P(2006)."The clean air act after 50 years".Weather.61(11): 311–314.Bibcode:2006Wthr...61..311B.doi:10.1256/wea.127.06.Retrieved11 April2024.
- ^"Progress Cleaning the Air and Improving People's Health".US Environmental Protection Agency.8 June 2015.Retrieved11 April2024.
- ^Environment UN (29 October 2018)."About Montreal Protocol".Ozonaction.Retrieved7 June2022.
- ^"The Montreal Protocol on Substances That Deplete the Ozone Layer".United States Department of State.Retrieved7 June2022.
- ^"Protocol On Further Reduction Of Sulphur Emissions To The Convention On Long-Range Transboundary Air Pollution | International Environmental Agreements (IEA) Database Project".iea.uoregon.edu.Retrieved7 June2022.
- ^Nations U."ClimateChange".United Nations.Retrieved7 June2022.
- ^"Climate change".www.who.int.World Health Organization.Retrieved7 June2022.
- ^"Global Climate Agreements: Successes and Failures".Council on Foreign Relations.Retrieved7 June2022.
- ^"Basic Information about NO2".US Environmental Protection Agency.6 July 2016.Retrieved12 April2024.
- ^"Radon".World Health Organization.Retrieved12 April2024.
- ^Manisalidis I, Stavropoulou E, Stavropoulos A, Bezirtzoglou E (2020)."Environmental and Health Impacts of Air Pollution: A Review".Front Public Health.8:14.doi:10.3389/fpubh.2020.00014.PMC7044178.PMID32154200.
- ^Perera F (23 December 2017)."Pollution from Fossil-Fuel Combustion is the Leading Environmental Threat to Global Pediatric Health and Equity: Solutions Exist".International Journal of Environmental Research and Public Health.15(1): 16.doi:10.3390/ijerph15010016.ISSN1660-4601.PMC5800116.PMID29295510.
- ^"Mapping methane emissions on a global scale".ESA. Archived fromthe originalon 3 February 2022.
- ^"Climate change: Satellites map huge methane plumes from oil and gas".BBC News.4 February 2022.Retrieved16 March2022.
- ^"Cracking down on methane 'ultra emitters' is a quick way to combat climate change, researchers find".The Washington Post.Retrieved16 March2022.
- ^Lauvaux T, Giron C, Mazzolini M, d'Aspremont A, Duren R, Cusworth D, et al. (4 February 2022)."Global assessment of oil and gas methane ultra-emitters".Science.375(6580): 557–561.arXiv:2105.06387.Bibcode:2022Sci...375..557L.doi:10.1126/science.abj4351.ISSN0036-8075.PMID35113691.S2CID246530897.
- ^Rentschler J, Leonova N (2023)."Global air pollution exposure and poverty".Nature Communications.14(1): 4432.Bibcode:2023NatCo..14.4432R.doi:10.1038/s41467-023-39797-4.PMC10363163.PMID37481598.
- ^Pennise D, Smith K."Biomass Pollution Basics"(PDF).World Health Organization.Archived fromthe original(PDF)on 9 July 2012.
- ^"Indoor air pollution and household energy".WHOand UNEP. 2011.
- ^Hawkes N (22 May 2015). "Air pollution in UK: the public health problem that won't go away".BMJ.350(may22 1): h2757.doi:10.1136/bmj.h2757.PMID26001592.S2CID40717317.
- ^"Wood burning heaters and your health - Fact sheets".www.health.nsw.gov.au.
- ^Tsiodra I, Grivas G, Tavernaraki K, Bougiatioti A, Apostolaki M, Paraskevopoulou D, et al. (7 December 2021)."Annual exposure to polycyclic aromatic hydrocarbons in urban environments linked to wintertime wood-burning episodes".Atmospheric Chemistry and Physics.21(23): 17865–17883.Bibcode:2021ACP....2117865T.doi:10.5194/acp-21-17865-2021.ISSN1680-7316.S2CID245103794.
- ^Nace T."China Shuts Down Tens Of Thousands Of Factories In Widespread Pollution Crackdown".Forbes.Retrieved16 June2022.
... it is estimated that 40 percent of all China's factories have been shut down at some point in order to be inspected... [and] over 80,000 factories have been hit with fines and criminal offenses as a result of their emissions.
- ^Huo H, Zhang Q, Guan D, Su X, Zhao H, He K (16 December 2014). "Examining Air Pollution in China Using Production- And Consumption-Based Emissions Accounting Approaches".Environmental Science & Technology.48(24): 14139–14147.Bibcode:2014EnST...4814139H.doi:10.1021/es503959t.ISSN0013-936X.PMID25401750.
- ^Huo H, Zhang Q, Guan D, Su X, Zhao H, He K (16 December 2014)."Examining Air Pollution in China Using Production- And Consumption-Based Emissions Accounting Approaches".Environmental Science & Technology.48(24): 14139–14147.Bibcode:2014EnST...4814139H.doi:10.1021/es503959t.ISSN0013-936X.PMID25401750.
- ^"EMEP/EEA air pollutant emission inventory guidebook 2019".
- ^"Particulate Matter (PM), US EPA".19 April 2016.
- ^"GovHK: Green Tips for Home Renovation".GovHK.16 September 2024.Retrieved22 September2024.
- ^"Health crisis: Up to a billion tons of waste potentially burned in the open every year".phys.org.Retrieved13 February2021.
- ^Cook E, Velis CA (6 January 2021)."Global Review on Safer End of Engineered Life".Global Review on Safer End of Engineered Life.Retrieved13 February2021.
- ^"Combustion Pollutants in Your Home - Guidelines".California Air Resources Board.Retrieved16 June2022.
"... most furnaces, wood stoves, fireplaces, gas water heaters, and gas clothes dryers, usually vent (exhaust) the combustion pollutants directly to the outdoors. However, if the vent system is not properly designed, installed, and maintained, indoor pollutants can build up quickly inside the home.
- ^"Overview of Air Pollution from Transportation".US Environmental Protection Agency. 15 December 2021.Retrieved16 June2022.
- ^Ryan RG, Marais EA, Balhatchet CJ, Eastham SD (June 2022)."Impact of Rocket Launch and Space Debris Air Pollutant Emissions on Stratospheric Ozone and Global Climate".Earth's Future.10(6): e2021EF002612.Bibcode:2022EaFut..1002612R.doi:10.1029/2021EF002612.ISSN2328-4277.PMC9287058.PMID35865359.
- ^Yeung J."Microplastics in our air 'spiral the globe' in a cycle of pollution, study finds".CNN.Retrieved4 August2022.
- ^Wang J, Wu Q, Liu J, Yang H, Yin M, Chen S, et al. (2019)."Vehicle emission and atmospheric pollution in China: problems, progress, and prospects".PeerJ.7:e6932.doi:10.7717/peerj.6932.PMC6526014.PMID31143547.
- ^Air Quality Expert Group(2004).Nitrogen Dioxide in the United Kingdom(PDF).Department for Environment, Food and Rural Affairs.Retrieved12 April2024.
- ^Aggarwal P, Jain S (2015)."Impact of air pollutants from surface transport sources on human health: A modeling and epidemiological approach".Environ Int.83:146–57.Bibcode:2015EnInt..83..146A.doi:10.1016/j.envint.2015.06.010.PMID26142107.
- ^"NASA GISS: NASA News & Feature Releases:Road Transportation Emerges as Key Driver of Warming".www.giss.nasa.gov.Retrieved4 August2022.
- ^"Car Emissions & Global Warming | Union of Concerned Scientists".www.ucsusa.org.Retrieved4 August2022.
- ^"NASA's AIRS Maps Carbon Monoxide from Brazil Fires".NASA Jet Propulsion Laboratory (JPL).Retrieved4 August2022.
- ^Harper AR, Doerr SH, Santin C, Froyd CA, Sinnadurai P (15 May 2018)."Prescribed fire and its impacts on ecosystem services in the UK".Science of the Total Environment.624:691–703.Bibcode:2018ScTEn.624..691H.doi:10.1016/j.scitotenv.2017.12.161.ISSN0048-9697.PMID29272838.
- ^George Neary D, McMichael Leonard J (8 April 2020), Missiakô Kindomihou V (ed.),"Effects of Fire on Grassland Soils and Water: A Review",Grasses and Grassland Aspects,IntechOpen,doi:10.5772/intechopen.90747,ISBN978-1-78984-949-3,S2CID213578405,retrieved7 June2022
- ^Husseini R, Aboah DT, Issifu H (1 March 2020)."Fire control systems in forest reserves: An assessment of three forest districts in the Northern region, Ghana".Scientific African.7:e00245.Bibcode:2020SciAf...700245H.doi:10.1016/j.sciaf.2019.e00245.ISSN2468-2276.S2CID213400214.
- ^Reyes O, Casal M (November 2004)."Effects of forest fire ash on germination and early growth of four pinus species".Plant Ecology.175(1): 81–89.Bibcode:2004PlEco.175...81R.doi:10.1023/B:VEGE.0000048089.25497.0c.ISSN1385-0237.S2CID20388177.
- ^Chatterjee R (15 February 2018)."Wall Paint, Perfumes and Cleaning Agents Are Polluting Our Air".NPR.Retrieved12 March2019.
- ^"Basic Information about Landfill Gas".US Environmental Protection Agency.15 April 2016.Retrieved9 August2022.
Landfill gas (LFG) is a natural byproduct of the decomposition of organic material in landfills. LFG is composed of roughly 50 percent methane...
- ^"Open waste burning prevention | Climate & Clean Air Coalition".www.ccacoalition.org.7 September 2023.Retrieved22 December2023.
- ^Hafemeister D (2016), "Biological and Chemical Weapons",Nuclear Proliferation and Terrorism in the Post-9/11 World,Cham:Springer International Publishing,pp. 337–351,doi:10.1007/978-3-319-25367-1_15,ISBN978-3-319-25365-7,PMC7123302
- ^Sun F, Dai Y, Yu X (December 2017). "Air pollution, food production and food security: A review from the perspective of food system".Journal of Integrative Agriculture.16(12): 2945–2962.Bibcode:2017JIAgr..16.2945S.doi:10.1016/S2095-3119(17)61814-8.
- ^Lelieveld J, Evans JS, Fnais M, Giannadaki D, Pozzer A (September 2015). "The contribution of outdoor air pollution sources to premature mortality on a global scale".Nature.525(7569): 367–371.Bibcode:2015Natur.525..367L.doi:10.1038/nature15371.ISSN1476-4687.PMID26381985.S2CID4460927.
Whereas in much of the USA and in a few other countries emissions from traffic and power generation are important, in eastern USA, Europe, Russia and East Asia agricultural emissions make the largest relative contribution to PM2.5, with the estimate of overall health impact depending on assumptions regarding particle toxicity.
- ^Diep F (31 January 2018)."California's Farms Are an Even Larger Source of Air Pollution Than We Thought".Pacific Standard.Retrieved2 February2018.
- ^Nemecek T, Poore J (1 June 2018)."Reducing food's environmental impacts through producers and consumers".Science.360(6392): 987–992.Bibcode:2018Sci...360..987P.doi:10.1126/science.aaq0216.ISSN0036-8075.PMID29853680.S2CID206664954.
- ^"Education Data, Visualizations & Graphics on particulate pollution".www.cleanairresources.com.Archived fromthe originalon 20 March 2019.Retrieved20 March2019.
- ^Goldstein AH, Koven CD,Heald CL,Fung IY (5 May 2009)."Biogenic carbon and anthropogenic pollutants combine to form a cooling haze over the southeastern United States".Proceedings of the National Academy of Sciences.106(22): 8835–40.Bibcode:2009PNAS..106.8835G.doi:10.1073/pnas.0904128106.PMC2690056.PMID19451635.
- ^Fischetti M (2014). "Trees That Pollute".Scientific American.310(6): 14.Bibcode:2014SciAm.310f..14F.doi:10.1038/scientificamerican0614-14.PMID25004561.
- ^"Volcanic Pollution |".Retrieved27 February2022.
- ^"Air Pollution Emissions".US EPA.2016.Retrieved7 June2022.
- ^Environment and Climate Change Canada (14 June 2010)."Air pollutant emissions".Canada.ca.Retrieved7 June2022.
- ^Manisalidis I, Stavropoulou E, Stavropoulos A, Bezirtzoglou E (20 February 2020)."Environmental and Health Impacts of Air Pollution: A Review".Frontiers in Public Health.8:14.doi:10.3389/fpubh.2020.00014.ISSN2296-2565.PMC7044178.PMID32154200.
- ^"AP 42, Volume I".US Environmental Protection Agency.Archivedfrom the original on 24 September 2010.Retrieved29 August2010.
- ^"United Kingdom's emission factor database".Naei.org.uk.Archived fromthe originalon 7 July 2010.Retrieved29 August2010.
- ^"EMEP/EEA air pollutant emission inventory guidebook—2009".Eea.europa.eu.European Environmental Agency.19 June 2009.Retrieved11 December2012.
- ^"Environmental Pollution".Theenvironmentalblog.org.16 December 2011.Retrieved11 December2012.
- ^"Revised 1996 IPCC Guidelines for National Greenhouse Gas Inventories (reference manual)".Ipcc-nggip.iges.or.jp.Archived fromthe originalon 21 March 2008.Retrieved29 August2010.
- ^US EPA O (10 December 2015)."Managing Air Quality - Air Pollutant Types".www.epa.gov.US Environmental Protection Agency.Retrieved27 February2022.
- ^Hidy G (2012).Aerosols: An Industrial and Environmental Science.Elsevier. p. 1.ISBN978-0-323-14251-9.
- ^Carrington D (4 November 2021)."Ammonia from farms behind 60% of UK particulate air pollution – study".The Guardian.Retrieved7 November2021.
- ^"The Effect of Changing Background Emissions on External Cost Estimates for Secondary Particulates".Open environmental sciences. 2008.
- ^Johnson K (18 April 2009)."How Carbon Dioxide Became a 'Pollutant'".Wall Street Journal.
- ^"Carbon dioxide".The National Institute for Occupational Safety and Health (NIOSH).U.S. Department of Health & Human Services. 30 October 2019.Retrieved19 April2023.
- ^ab"General hazards of Carbon Dioxide".Health and Safety Executive.UK Government.Retrieved19 April2023.
For over a century CO2has been recognised as a workplace hazard at high concentrations. CO2is naturally present in the air we breathe at a concentration of about 0.037% and is not harmful to health at low concentrations.
- ^Air Quality Guidelines Global Update 2005: Particulate matter, ozone, nitrogen dioxide and sulfur dioxide.Copenhagen, Denmark: World Health Organization. 2006. p. 12.ISBN92-890-2192-6.
Some pollutants, and especially those associated with greenhouse warming effects (carbon dioxide, nitrous oxide and methane)...
- ^Vaidyanathan G."The Worst Climate Pollution Is Carbon Dioxide".Scientific American.
- ^Barbalace RC (7 November 2006)."CO2Pollution and Global Warming: When does carbon dioxide become a pollutant? ".Environmentalchemistry.com.
- ^Friedman L (22 August 2022)."Democrats Designed the Climate Law to Be a Game Changer. Here's How".The New York Times.Retrieved19 April2023.
- ^"Graphic: The relentless rise of carbon dioxide".Climate Change: Vital Signs of the Planet.NASA.
- ^"How much of U.S. carbon dioxide emissions are associated with electricity generation?".Retrieved16 December2016.
- ^"Full Mauna Loa CO2record ".Earth System Research Laboratory.Retrieved10 January2017.
- ^"OECD Test Guidelines for Chemicals".
- ^"The Strange Lake Nyos CO2Gas Disaster: Impacts and The Displacement and Return of Affected Communities ".
- ^"Carbon Monoxide Poisoning – NHS".17 October 2017.
- ^US EPA O (5 June 2017)."Basic Ozone Layer Science".www.epa.gov.US Environmental Protection Agency.Retrieved7 June2022.
- ^"Chlorofluorocarbons (CFCs) are heavier than air, so how do scientists suppose that these chemicals reach the altitude of the ozone layer to adversely affect it?".Scientific American.Retrieved7 June2022.
- ^"What is Particulate Matter? | Urban Environmental Program in New England".US EPA.29 March 2022. Archived fromthe originalon 7 June 2022.Retrieved7 June2022.
- ^Munsif R, Zubair M, Aziz A, Nadeem Zafar M (7 January 2021), Viskup R (ed.),"Industrial Air Emission Pollution: Potential Sources and Sustainable Mitigation",Environmental Emissions,IntechOpen,doi:10.5772/intechopen.93104,ISBN978-1-83968-510-1,S2CID234150821,retrieved7 June2022
- ^"Evidence growing of air pollution's link to heart disease, death".Archived fromthe originalon 3 June 2010.Retrieved18 May2010.// American Heart Association. 10 May 2010
- ^Balmes J, Fine J, Sheppard D (1987). "Symptomatic bronchoconstriction after short-term inhalation of sulfur dioxide".American Review of Respiratory Disease.136(5): 1117–21.doi:10.1164/ajrccm/136.5.1117.PMID3674573.
- ^Singh R, Kumar S, Karmakar S, Siddiqui AJ, Mathur A, Adnan M, et al. (2021). "2: Causes, Consequences, and Control of Persistent Organic Pollutants". In Kumar N, Shukla V (eds.).Persistent Organic Pollutants in the Environment: Origin and Role.CRC Press.pp. 31–54.ISBN978-1-003-05317-0.Retrieved11 June2022.
- ^"Newly detected air pollutant mimics damaging effects of cigarette smoke"(PDF).Physorg.com.Retrieved29 August2010.
- ^"Infant Inhalation Of Ultra-fine Air Pollution Linked To Adult Lung Disease".Sciencedaily.com.23 July 2009.Retrieved29 August2010.
- ^Kim KH, Jahan SA, Kabir E, Brown RJ (1 October 2013)."A review of airborne polycyclic aromatic hydrocarbons (PAHs) and their human health effects".Environment International.60:71–80.Bibcode:2013EnInt..60...71K.doi:10.1016/j.envint.2013.07.019.ISSN0160-4120.PMID24013021.
- ^"Technical Overview of Volatile Organic Compounds".US Environmental Protection Agency.14 March 2023.Retrieved20 April2023.
- ^Read "Rethinking the Ozone Problem in Urban and Regional Air Pollution" at NAP.edu.1991.doi:10.17226/1889.ISBN978-0-309-04631-2.
- ^"ESS Topic 6.3: Photochemical Smog".Amazing World of Science With Mr. Green.Retrieved7 June2022.
- ^Arkansas Energy Department of Energy and Environment."Cars and Air Pollution".www.adeq.state.ar.us.Retrieved24 August2024.
- ^Acharya B (1 January 2018), Basu P (ed.),"Chapter 10 - Cleaning of Product Gas of Gasification",Biomass Gasification, Pyrolysis and Torrefaction (Third Edition),Academic Press, pp. 373–391,ISBN978-0-12-812992-0,retrieved7 June2022
- ^"smog | National Geographic Society".education.nationalgeographic.org.National Geographic.Retrieved7 June2022.
- ^"Hazardous Air Pollutants".US Environmental Protection Agency.9 February 2023.Retrieved29 April2023.
- ^"Air quality standards".European Environment Agency.Retrieved29 April2023.
- ^abcdeVallero DA (1 October 2007).Fundamentals of Air Pollution(4th ed.). Academic Press.ISBN9780124054813.
- ^Dons E (2011). "Impact of time-activity patterns on personal exposure to black carbon".Atmospheric Environment.45(21): 3594–3602.Bibcode:2011AtmEn..45.3594D.doi:10.1016/j.atmosenv.2011.03.064.
- ^Dons E (2019). "Transport most likely to cause air pollution peak exposures in everyday life: Evidence from over 2000 days of personal monitoring".Atmospheric Environment.213:424–432.Bibcode:2019AtmEn.213..424D.doi:10.1016/j.atmosenv.2019.06.035.hdl:10044/1/80194.S2CID197131423.
- ^Carrington D (22 September 2021)."WHO slashes guideline limits on air pollution from fossil fuels".The Guardian.Retrieved22 September2021.
- ^"Most of the World Breathes Unsafe Air, Taking More Than 2 Years Off Global Life Expectancy".AQLI.14 June 2022.Retrieved12 July2022.
- ^ab"Taking an Exposure History: What Are Possible Sources of Indoor Air Pollution | Environmental Medicine | ATSDR".www.atsdr.cdc.gov.9 February 2021.Retrieved8 July2024.
 This article incorporates text from this source, which is in thepublic domain.
- ^abDuflo E, Greenstone M, Hanna R (26 November 2008)."Indoor air pollution, health and economic well-being".S.A.P.I.EN.S.1(1).Retrieved29 August2010.
- ^ab"Improved Clean Cookstoves".Project Drawdown.7 February 2020.Retrieved5 December2020.
- ^Twilley N (1 April 2019)."The Hidden Air Pollution in Our Homes".The New Yorker– via www.newyorker.com.
- ^"Bucknell tent death: Hannah Thomas-Jones died from carbon monoxide poisoning".BBC News.17 January 2013.Retrieved22 September2015.
- ^"Chapter 6.2. Asbestos. Air quality guidelines, Second edition"(PDF).World Health OrganizationEurope.Archived fromthe original(PDF)on 24 May 2011.
- ^abCarrington D (18 May 2021)."Air pollution linked to 'huge' rise in child asthma GP visits".The Guardian.Retrieved22 May2021.
- ^Kampa M, Castanas E (1 January 2008)."Human health effects of air pollution".Environmental Pollution.Proceedings of the 4th International Workshop on Biomonitoring of Atmospheric Pollution (With Emphasis on Trace Elements).151(2): 362–367.Bibcode:2008EPoll.151..362K.doi:10.1016/j.envpol.2007.06.012.ISSN0269-7491.PMID17646040.S2CID38513536.
- ^Dovjak M, Kukec A (2019). "Health Outcomes Related to Built Environments".Creating Healthy and Sustainable Buildings.Switzerland: Springer International Publishing. pp. 43–82.doi:10.1007/978-3-030-19412-3_2.ISBN978-3-030-19411-6.OCLC1285508857.S2CID190160283.
- ^"Long-Term Exposure to Low Levels of Air Pollution Increases Risk of Heart and Lung Disease".Science Daily.22 February 2021.
- ^Vohra K, Vodonos A, Schwartz J, Marais EA, Sulprizio MP, Mickley LJ (1 April 2021)."Global mortality from outdoor fine particle pollution generated by fossil fuel combustion: Results from GEOS-Chem".Environmental Research.195:110754.Bibcode:2021ER....19510754V.doi:10.1016/j.envres.2021.110754.ISSN0013-9351.PMID33577774.
- ^"Air quality and health".Who.int.World Health Organization.Retrieved26 November2011.
- ^US EPA O (22 February 2013)."Regulatory and Guidance Information by Topic: Air".www.epa.gov.Retrieved10 November2022.
- ^Majumder N, Kodali V, Velayutham M, Goldsmith T, Amedro J, Khramtsov VV, et al. (2022)."Aerosol physicochemical determinants of carbon black and ozone inhalation co-exposure induced pulmonary toxicity".Toxicological Sciences.191(1): 61–78.doi:10.1093/toxsci/kfac113.PMC9887725.PMID36303316.
- ^Ritchie H,Roser M(2021)."What are the safest and cleanest sources of energy?".Our World in Data.Archivedfrom the original on 15 January 2024.Data sources: Markandya & Wilkinson (2007); UNSCEAR (2008; 2018); Sovacool et al. (2016); IPCC AR5 (2014); Pehl et al. (2017); Ember Energy (2021).
- ^Roser M (18 March 2024)."Data review: how many people die from air pollution?".Our World in Data.
- ^Whitacre P (9 February 2021)."Air Pollution Accounts for 1 in 8 Deaths Worldwide, According to New WHO Estimates".National Institute of Environmental Health Sciences.Archived fromthe originalon 4 November 2022.Retrieved18 February2022.
- ^Lelieveld J, Klingmüller K, Pozzer A, Burnett RT, Haines A, Ramanathan V (9 April 2019)."Effects of fossil fuel and total anthropogenic emission removal on public health and climate".Proceedings of the National Academy of Sciences.116(15): 7192–7197.Bibcode:2019PNAS..116.7192L.doi:10.1073/pnas.1819989116.ISSN0027-8424.PMC6462052.PMID30910976.
- ^abCarrington D (12 March 2019)."Air pollution deaths are double previous estimates, finds research".The Guardian.Retrieved12 March2019.
- ^Dickie G (18 May 2022)."Pollution killing 9 million people a year, Africa hardest hit - study".Reuters.Retrieved23 June2022.
- ^World Health Organisation (29 October 2018)."More than 90% of the world's children breathe toxic air every day".www.who.int.Retrieved13 August2024.
- ^ab"Ambient (outdoor) air pollution".www.who.int.World Health Organization.Retrieved20 December2021.
- ^Baccarelli AA, Hales N, Burnett RT, Jerrett M, Mix C, Dockery DW, et al. (1 November 2016)."Particulate Air Pollution, Exceptional Aging, and Rates of Centenarians: A Nationwide Analysis of the United States, 1980–2010".Environmental Health Perspectives.124(11): 1744–1750.doi:10.1289/EHP197.PMC5089884.PMID27138440.
- ^Pope CA (15 December 2003)."Cardiovascular Mortality and Long-Term Exposure to Particulate Air Pollution: Epidemiological Evidence of General Pathophysiological Pathways of Disease".Circulation.109(1): 71–77.doi:10.1161/01.CIR.0000108927.80044.7F.PMID14676145.
- ^Harris G (25 January 2014)."Beijing's Bad Air Would Be Step Up for Smoggy Delhi".The New York Times.ISSN0362-4331.Retrieved28 April2023.
- ^Owusu PA, Sarkodie SA (10 November 2020)."Global estimation of mortality, disability-adjusted life years and welfare cost from exposure to ambient air pollution".Science of the Total Environment.742:140636.Bibcode:2020ScTEn.74240636O.doi:10.1016/j.scitotenv.2020.140636.ISSN0048-9697.PMID32721745.S2CID220848545.
- ^"Lancet study: Pollution killed 2.3 million Indians in 2019".BBC News.18 May 2022.Retrieved28 April2023.
- ^Mr Chen's claim was made inThe Lancet(December 2013 issue) and reported in The Daily Telegraph 8 January 2014 p. 15 'Air pollution killing up to 500,000 Chinese each year, admits former health minister.
- ^Feng T, Chen H, Liu J (15 December 2022)."Air pollution-induced health impacts and health economic losses in China driven by US demand exports".Journal of Environmental Management.324:116355.Bibcode:2022JEnvM.32416355F.doi:10.1016/j.jenvman.2022.116355.ISSN0301-4797.PMID36179470.
- ^ab"Car emissions: taking tests out of the lab and onto the road – News".European Parliament.25 February 2016.Retrieved11 January2018.
- ^"Air pollution causes early deaths".BBC.21 February 2005.Retrieved14 August2012.
- ^"Complete Guide To The 'Toxin Tax' For Diesel Cars".Motorway.Retrieved25 May2017.
- ^"Study links traffic pollution to thousands of deaths".The Guardian.London, UK. 15 April 2008.Archivedfrom the original on 20 April 2008.Retrieved15 April2008.
- ^Mailloux NA, Abel DW, Holloway T, Patz JA (16 May 2022)."Nationwide and Regional PM2.5-Related Air Quality Health Benefits From the Removal of Energy-Related Emissions in the United States".GeoHealth.6(5): e2022GH000603.Bibcode:2022GHeal...6..603M.doi:10.1029/2022GH000603.PMC9109601.PMID35599962.
- ^abHenneman L, Choirat C, Dedoussi I, Dominici F, Roberts J, Zigler C (24 November 2023)."Mortality risk from United States coal electricity generation".Science.382(6673): 941–946.Bibcode:2023Sci...382..941H.doi:10.1126/science.adf4915.PMC10870829.PMID37995235.
- ^abNansai K, Tohno S, Chatani S, Kanemoto K, Kagawa S, Kondo Y, et al. (2 November 2021)."Consumption in the G20 nations causes particulate air pollution resulting in two million premature deaths annually".Nature Communications.12(1): 6286.Bibcode:2021NatCo..12.6286N.doi:10.1038/s41467-021-26348-y.ISSN2041-1723.PMC8563796.PMID34728619.
- ^Vohra K, Vodonos A, Schwartz J, Marais EA, Sulprizio MP, Mickley LJ (1 April 2021)."Global mortality from outdoor fine particle pollution generated by fossil fuel combustion: Results from GEOS-Chem".Environmental Research.195:110754.Bibcode:2021ER....19510754V.doi:10.1016/j.envres.2021.110754.ISSN0013-9351.PMID33577774.S2CID231909881.Retrieved5 March2021.
- ^Mackenzie J, Turrentine J (22 June 2021)."Air Pollution: Everything You Need to Know".NRDC.Retrieved18 June2022.
- ^Farrow A, Miller KA, Myllyvirta L (February 2020).Toxic air: The price of fossil fuels(PDF).Seoul: Greenpeace Southeast Asia.
{{cite book}}:CS1 maint: date and year (link) - ^Lucking AJ, Lundback M, Mills NL, Faratian D, Barath SL, Pourazar J, et al. (2008)."Diesel exhaust inhalation increases thrombus formation in man".European Heart Journal.29(24): 3043–51.doi:10.1093/eurheartj/ehn464.PMID18952612.
- ^Törnqvist HK, Mills NL, Gonzalez M, Miller MR, Robinson SD, Megson IL, et al. (2007). "Persistent Endothelial Dysfunction in Humans after Diesel Exhaust Inhalation".American Journal of Respiratory and Critical Care Medicine.176(4): 395–400.doi:10.1164/rccm.200606-872OC.PMID17446340.
- ^"Air pollution from G20 consumers caused two million deaths in 2010".New Scientist.Retrieved11 December2021.
- ^Tankersley J (8 January 2010)."EPA proposes nation's strictest smog limits ever".Los Angeles Times.Retrieved14 August2012.
- ^"EPA slideshow"(PDF).Retrieved11 December2012.
- ^"EPA Strengthens Ozone Standards to Protect Public Health/Science-based standards to reduce sick days, asthma attacks, emergency room visits, greatly outweigh costs (10/1/2015)".Yosemite.epa.gov.Retrieved11 January2018.
- ^Grossni M (13 November 2008)."Human cost of valley's dirty air: $6.3 billion".Sacramento Bee.Archived fromthe originalon 16 December 2008.Retrieved14 August2012.
- ^Sahagun L (13 November 2008)."Pollution saps state's economy, study says".Los Angeles Times.Retrieved14 August2012.
- ^Kay J (13 November 2008)."Bad air costing state's economy billions".San Francisco Chronicle.Retrieved14 August2012.
- ^"Human health may be at risk from long-term exposure to air pollution below current air quality standards and guidelines".British Medical Journal.Retrieved18 October2021.
- ^Strak M, Weinmayr G, Rodopoulou S, Chen J, Hoogh Kd, Andersen ZJ, et al. (2 September 2021)."Long term exposure to low level air pollution and mortality in eight European cohorts within the ELAPSE project: pooled analysis".BMJ.374:n1904.doi:10.1136/bmj.n1904.ISSN1756-1833.PMC8409282.PMID34470785.
- ^Cohen AJ, Brauer M, Burnett R, Anderson HR, Frostad J, Estep K, et al. (May 2017)."Estimates and 25-year trends of the global burden of disease attributable to ambient air pollution: an analysis of data from the Global Burden of Diseases Study 2015".The Lancet.389(10082): 1907–1918.Bibcode:2017Lanc..389.1907C.doi:10.1016/S0140-6736(17)30505-6.ISSN0140-6736.PMC5439030.PMID28408086.
- ^abde Bont J, Jaganathan S, Dahlquist M, Persson Å, Stafoggia M, Ljungman P (8 March 2022)."Ambient air pollution and cardiovascular diseases: An umbrella review of systematic reviews and meta-analyses".Journal of Internal Medicine.291(6): 779–800.doi:10.1111/joim.13467.eISSN1365-2796.ISSN0954-6820.PMC9310863.PMID35138681.
- ^abMayor S (12 June 2016). "Air pollution is a leading risk factor for stroke, global study shows".BMJ.353:i3272.doi:10.1136/bmj.i3272.eISSN1756-1833.PMID27298274.
- ^Feigin VL, Roth GA, Naghavi M, Parmar P, Krishnamurthi R, Chugh S, et al. (August 2016). "Global burden of stroke and risk factors in 188 countries, during 1990–2013: a systematic analysis for the Global Burden of Disease Study 2013".The Lancet Neurology.15(9): 913–924.doi:10.1016/S1474-4422(16)30073-4.hdl:10292/14061.ISSN1474-4422.PMID27291521.
- ^Miller KA, Siscovick DS, Sheppard L, Shepherd K, Sullivan JH, Anderson GL, et al. (2007). "Long-term exposure to air pollution and incidence of cardiovascular events in women".The New England Journal of Medicine.356(5): 447–58.doi:10.1056/NEJMoa054409.PMID17267905.
- ^Andersen ZJ, Kristiansen LC, Andersen KK, Olsen TS, Hvidberg M, Jensen SS, et al. (2011)."Stroke and Long-Term Exposure to Outdoor Air Pollution From Nitrogen Dioxide: A Cohort Study".Stroke.43(2): 320–25.doi:10.1161/STROKEAHA.111.629246.PMID22052517.
- ^Provost E, Madhloum N, Int Panis L, De Boever P, Nawrot T (May 2015)."Carotid intima-media thickness, a marker of subclinical atherosclerosis, and particulate air pollution exposure: the meta-analytical evidence".PLOS ONE.10(5): e0127014.Bibcode:2015PLoSO..1027014P.doi:10.1371/journal.pone.0127014.PMC4430520.PMID25970426.S2CID11741224.
- ^Brook R, Rajagopalan S, Pope CI, Brook J, Bhatnagar A (2010)."Particulate matter air pollution and cardiovascular disease: An update to the scientific statement from the American Heart Association".Circulation.121(21): 2331–78.doi:10.1161/cir.0b013e3181dbece1.hdl:2027.42/78373.PMID20458016.
- ^Louwies T, Int Panis L, Kicinski M, De Boever P, Nawrot TS (2013)."Retinal Microvascular Responses to Short-Term Changes in Particulate Air Pollution in Healthy Adults".Environmental Health Perspectives.121(9): 1011–16.doi:10.1289/ehp.1205721.PMC3764070.PMID23777785.S2CID6748539.
- ^Gehring U, Wijga AH, Brauer M, Fischer P, de Jongste JC, Kerkhof M, et al. (2010). "Traffic-related air pollution and the development of asthma and allergies during the first 8 years of life".American Journal of Respiratory and Critical Care Medicine.181(6): 596–603.doi:10.1164/rccm.200906-0858OC.PMID19965811.
- ^Andersen ZJ, Hvidberg M, Jensen SS, Ketzel M, Loft S, Sorensen M, et al. (2011). "Chronic obstructive pulmonary disease and long-term exposure to traffic-related air pollution: a cohort study. [Research Support, Non-U.S. Gov't]".American Journal of Respiratory and Critical Care Medicine.183(4): 455–461.doi:10.1164/rccm.201006-0937OC.PMID20870755.S2CID3945468.
- ^Committee of the Environmental and Occupational Health Assembly of the American Thoracic Society (1996). "Health effects of outdoor air pollution".American Journal of Respiratory and Critical Care Medicine.153(1): 3–50.doi:10.1164/ajrccm.153.1.8542133.PMID8542133.
- ^Andersen ZJ, Bonnelykke K, Hvidberg M, Jensen SS, Ketzel M, Loft S, et al. (2011)."Long-term exposure to air pollution and asthma hospitalisations in older adults: a cohort study".Thorax.67(1): 6–11.doi:10.1136/thoraxjnl-2011-200711.PMID21890573.
- ^Zoidis JD (1999)."The Impact of Air Pollution on COPD".RT: For Decision Makers in Respiratory Care.
- ^World Health Organisation."Ambient air pollution".www.who.int.Retrieved10 November2023.
- ^"Understanding Air Pollution".Respiratory Health Association.Retrieved15 August2022.
- ^Holland WW, Reid DD. "The urban factor in chronic bronchitis"Lancet1965;I:445–448.
- ^Gauderman W (2007). "Effect of exposure to traffic on lung development from 10 to 18 years of age: a cohort study".The Lancet.369(9561): 571–77.CiteSeerX10.1.1.541.1258.doi:10.1016/S0140-6736(07)60037-3.PMID17307103.S2CID852646.
- ^Int Panis L (2017)."Short-term air pollution exposure decreases lung function: a repeated measures study in healthy adults".Environmental Health.16(1): 60.Bibcode:2017EnvHe..16...60I.doi:10.1186/s12940-017-0271-z.PMC5471732.PMID28615020.S2CID20491472.
- ^Sunyer J (2001)."Urban air pollution and Chronic Obstructive Pulmonary disease: a review".European Respiratory Journal.17(5): 1024–33.doi:10.1183/09031936.01.17510240.PMID11488305.
- ^"Education Data, Visualizations & Graphics on Air Quality and PM2.5".www.cleanairresources.com.Retrieved19 September2019.
- ^Gallagher J (17 December 2015)."Cancer is not just 'bad luck' but down to environment, study suggests".BBC.Retrieved17 December2015.
- ^ab"Cancer breakthrough is a 'wake-up' call on danger of air pollution".The Guardian.10 September 2022.Retrieved11 September2022.
- ^Hill W, Lim EL, Weeden CE, Lee C, Augustine M, Chen K, et al. (5 April 2023)."Lung adenocarcinoma promotion by air pollutants".Nature.616(7955): 159–167.Bibcode:2023Natur.616..159H.doi:10.1038/s41586-023-05874-3.ISSN1476-4687.PMC7614604.PMID37020004.
- ^abChen H, Goldberg M, Villeneuve P (October–December 2008). "A systematic review of the relation between long-term exposure to ambient air pollution and chronic diseases".Reviews on Environmental Health.23(4): 243–97.doi:10.1515/reveh.2008.23.4.243.PMID19235364.S2CID24481623.
- ^Saber E, Heydari G (May 2012). "Flow patterns and deposition fraction of particles in the range of 0.1–10 μm at trachea and the first third generations under different breathing conditions".Computers in Biology and Medicine.42(5): 631–38.doi:10.1016/j.compbiomed.2012.03.002.PMID22445097.
- ^Raaschou-Nielsen O, Andersen ZJ, Hvidberg M, Jensen SS, Ketzel M, Sorensen M, et al. (2011)."Lung cancer incidence and long-term exposure to air pollution from traffic. [Research Support, Non-U.S. Gov't]".Environmental Health Perspectives.119(6): 860–65.doi:10.1289/ehp.1002353.PMC3114823.PMID21227886.S2CID1323189.
- ^Raaschou-Nielsen O, Andersen ZJ, Hvidberg M, Jensen SS, Ketzel M, Sorensen M, et al. (2011)."Air pollution from traffic and cancer incidence: a Danish cohort study".Environmental Health.10(1): 67.Bibcode:2011EnvHe..10...67R.doi:10.1186/1476-069X-10-67.PMC3157417.PMID21771295.S2CID376897.
- ^Yacong Bo (2021). "Reduced Ambient PM2.5 Was Associated with a Decreased Risk of Chronic Kidney Disease: A Longitudinal Cohort Study".Environmental Science & Technology.55(10): 6876–6883.Bibcode:2021EnST...55.6876B.doi:10.1021/acs.est.1c00552.PMID33904723.S2CID233408693.
- ^Blum MF, Surapaneni A, Stewart JD, Liao D, Yanosky JD, Whitsel EA, et al. (6 March 2020)."Particulate Matter and Albuminuria, Glomerular Filtration Rate, and Incident CKD".Clinical Journal of the American Society of Nephrology.15(3): 311–319.doi:10.2215/CJN.08350719.ISSN1555-9041.PMC7057299.PMID32108020.
- ^abcdefConforti A, Mascia M, Cioffi G, De Angelis C, Coppola G, De Rosa P, et al. (30 December 2018)."Air pollution and female fertility: a systematic review of literature".Reproductive Biology and Endocrinology.16(1): 117.doi:10.1186/s12958-018-0433-z.ISSN1477-7827.PMC6311303.PMID30594197.
- ^Canipari R, De Santis L, Cecconi S (January 2020)."Female Fertility and Environmental Pollution".International Journal of Environmental Research and Public Health.17(23): 8802.doi:10.3390/ijerph17238802.ISSN1660-4601.PMC7730072.PMID33256215.
- ^da Silva Junior FC, Felipe MB, Castro DE, Araújo SC, Sisenando HC, Batistuzzo de Medeiros SR (1 June 2021)."A look beyond the priority: A systematic review of the genotoxic, mutagenic, and carcinogenic endpoints of non-priority PAHs".Environmental Pollution.278:116838.Bibcode:2021EPoll.27816838D.doi:10.1016/j.envpol.2021.116838.ISSN0269-7491.PMID33714059.S2CID232222865.
- ^Plunk EC, Richards SM (January 2020)."Endocrine-Disrupting Air Pollutants and Their Effects on the Hypothalamus-Pituitary-Gonadal Axis".International Journal of Molecular Sciences.21(23): 9191.doi:10.3390/ijms21239191.ISSN1422-0067.PMC7731392.PMID33276521.
- ^Perono GA, Petrik JJ, Thomas PJ, Holloway AC (1 January 2022)."The effects of polycyclic aromatic compounds (PACs) on mammalian ovarian function".Current Research in Toxicology.3:100070.Bibcode:2022CRTox...300070P.doi:10.1016/j.crtox.2022.100070.ISSN2666-027X.PMC9043394.PMID35492299.
- ^abJurewicz J, Dziewirska E, Radwan M, Hanke W (23 December 2018)."Air pollution from natural and anthropic sources and male fertility".Reproductive Biology and Endocrinology.16(1): 109.doi:10.1186/s12958-018-0430-2.ISSN1477-7827.PMC6304234.PMID30579357.
- ^Frutos V, González-Comadrán M, Solà I, Jacquemin B, Carreras R, Checa Vizcaíno MA (2 January 2015). "Impact of air pollution on fertility: a systematic review".Gynecological Endocrinology.31(1): 7–13.doi:10.3109/09513590.2014.958992.ISSN0951-3590.PMID25212280.S2CID41594539.
- ^Checa Vizcaíno MA, González-Comadran M, Jacquemin B (September 2016). "Outdoor air pollution and human infertility: a systematic review".Fertility and Sterility.106(4): 897–904.e1.doi:10.1016/j.fertnstert.2016.07.1110.ISSN0015-0282.PMID27513553.
- ^abcCarré J, Gatimel N, Moreau J, Parinaud J, Léandri R (28 July 2017)."Does air pollution play a role in infertility?: a systematic review".Environmental Health.16(1): 82.Bibcode:2017EnvHe..16...82C.doi:10.1186/s12940-017-0291-8.ISSN1476-069X.PMC5534122.PMID28754128.
- ^Jurewicz J, Dziewirska E, Radwan M, Hanke W (2018)."Air pollution from natural and anthropic sources and male fertility".Reproductive Biology and Endocrinology.16(1): 109.doi:10.1186/s12958-018-0430-2.PMC6304234.PMID30579357.S2CID57376088.Retrieved5 October2022.
- ^abAir pollution and child health: prescribing clean air. Summary.Geneva: World Health Organisation. 2018. pp. 2–6.
- ^abGordon B, Mackay R, Rehfuess E (2004). "Polluted Cities: The Air Children Breathe".Inheriting the World: The Atlas of Children's Health and the Environment.World Health Organisation.
- ^Pieters N, Koppen G, Van Poppel M, De Prins S, Cox B, Dons E, et al. (March 2015)."Blood Pressure and Same-Day Exposure to Air Pollution at School: Associations with Nano-Sized to Coarse PM in Children".Environmental Health Perspectives.123(7): 737–42.doi:10.1289/ehp.1408121.PMC4492263.PMID25756964.
- ^Perera FP, Tang D, Wang S, Vishnevetsky J, Zhang B, Diaz D, et al. (1 June 2012)."Prenatal Polycyclic Aromatic Hydrocarbon (PAH) Exposure and Child Behavior at Age 6–7 Years".Environmental Health Perspectives.120(6): 921–926.doi:10.1289/ehp.1104315.PMC3385432.PMID22440811.
- ^Perera FP, Chang Hw, Tang D, Roen EL, Herbstman J, Margolis A, et al. (5 November 2014)."Early-Life Exposure to Polycyclic Aromatic Hydrocarbons and ADHD Behavior Problems".PLOS ONE.9(11): e111670.Bibcode:2014PLoSO...9k1670P.doi:10.1371/journal.pone.0111670.ISSN1932-6203.PMC4221082.PMID25372862.
- ^Becerra TA, Wilhelm M, Olsen J, Cockburn M, Ritz B (1 March 2013)."Ambient Air Pollution and Autism in Los Angeles County, California".Environmental Health Perspectives.121(3): 380–386.doi:10.1289/ehp.1205827.PMC3621187.PMID23249813.
- ^Carter SA, Rahman MM, Lin JC, Shu YH, Chow T, Yu X, et al. (1 January 2022)."In utero exposure to near-roadway air pollution and autism spectrum disorder in children".Environment International.158:106898.Bibcode:2022EnInt.15806898C.doi:10.1016/j.envint.2021.106898.ISSN0160-4120.PMC8688235.PMID34627014.
- ^Flanagan E, Malmqvist E, Rittner R, Gustafsson P, Källén K, Oudin A (8 March 2023)."Exposure to local, source-specific ambient air pollution during pregnancy and autism in children: a cohort study from southern Sweden".Scientific Reports.13(1): 3848.Bibcode:2023NatSR..13.3848F.doi:10.1038/s41598-023-30877-5.ISSN2045-2322.PMC9995328.PMID36890287.
- ^Ritz B, Liew Z, Yan Q, Cuia X, Virk J, Ketzel M, et al. (December 2018)."Air pollution and autism in Denmark".Environmental Epidemiology.2(4): e028.doi:10.1097/EE9.0000000000000028.PMC6474375.PMID31008439.
- ^Perera F, Herbstman J (1 April 2011)."Prenatal environmental exposures, epigenetics, and disease".Reproductive Toxicology.Prenatal Programming and Toxicity II (PPTOX II): Role of Environmental Stressors in the Developmental Origins of Disease.31(3): 363–373.Bibcode:2011RepTx..31..363P.doi:10.1016/j.reprotox.2010.12.055.ISSN0890-6238.PMC3171169.PMID21256208.
- ^Papamitsou T, Sirak S, Kavvadas D (January–March 2020)."Air pollution and preterm birth: a recommendation for further study in Greece".Hippokratia.24(1): 44.PMC7733367.PMID33364740.
- ^Fleischer NL, Merialdi M, van Donkelaar A, Vadillo-Ortega F, Martin RV, Betran AP, et al. (1 April 2014)."Outdoor air pollution, preterm birth, and low birth weight: analysis of the World Health Organization global survey on maternal and perinatal health".Environmental Health Perspectives.122(4): 425–30.doi:10.1289/ehp.1306837.ISSN1552-9924.PMC3984219.PMID24508912.S2CID3947454.
- ^abcMalley CS, Kuylenstierna JC, Vallack HW, Henze DK, Blencowe H, Ashmore MR (1 April 2017)."Preterm birth associated with maternal fine particulate matter exposure: A global, regional and national assessment"(PDF).Environment International.101:173–82.Bibcode:2017EnInt.101..173M.doi:10.1016/j.envint.2017.01.023.ISSN1873-6750.PMID28196630.
- ^Bank EI (19 October 2022).Finance in Africa - Navigating the financial landscape in turbulent times.European Investment Bank.ISBN978-92-861-5382-2.
- ^"Silent Suffocation in Africa - Air Pollution is a Growing Menace, Affecting the Poorest Children the Most"(PDF).UNICEF.
- ^"The cost of air pollution in Africa".Africa Renewal.Retrieved31 October2022.
- ^Wang X, Ding H, Ryan L, Xu X (1 May 1997)."Association between air pollution and low birth weight: a community-based study".Environmental Health Perspectives.105(5): 514–20.doi:10.1289/ehp.97105514.ISSN0091-6765.PMC1469882.PMID9222137.S2CID2707126.
- ^Brauer M, Lencar C, Tamburic L, Koehoorn M, Demers P, Karr C (1 May 2008)."A Cohort Study of Traffic-Related Air Pollution Impacts on Birth Outcomes".Environmental Health Perspectives.116(5): 680–6.doi:10.1289/ehp.10952.PMC2367679.PMID18470315.S2CID7721551.
- ^Bos I, De Boever P, Int Panis L, Meeusen R (2014)."Physical Activity, Air Pollution and the Brain".Sports Medicine.44(11): 1505–18.doi:10.1007/s40279-014-0222-6.PMID25119155.S2CID207493297.
- ^Air pollution linked to much greater risk of dementiaThe Guardian
- ^Julvez J, López-Vicente M, Warembourg C, Maitre L, Philippat C, Gützkow KB, et al. (1 September 2021)."Early life multiple exposures and child cognitive function: A multi-centric birth cohort study in six European countries".Environmental Pollution.284:117404.Bibcode:2021EPoll.28417404J.doi:10.1016/j.envpol.2021.117404.ISSN0269-7491.PMC8287594.PMID34077897.
- ^abCosta LG, Cole TB, Dao K, Chang YC, Coburn J, Garrick JM (June 2020)."Effects of air pollution on the nervous system and its possible role in neurodevelopmental and neurodegenerative disorders".Pharmacology & Therapeutics.210:107523.doi:10.1016/j.pharmthera.2020.107523.ISSN1879-016X.PMC7245732.PMID32165138.
- ^Volk HE, Perera F, Braun JM, Kingsley SL, Gray K, Buckley J, et al. (1 May 2021)."Prenatal air pollution exposure and neurodevelopment: A review and blueprint for a harmonized approach within ECHO".Environmental Research.196:110320.Bibcode:2021ER....19610320V.doi:10.1016/j.envres.2020.110320.ISSN0013-9351.PMC8060371.PMID33098817.
- ^Shang L, Yang L, Yang W, Huang L, Qi C, Yang Z, et al. (1 July 2020)."Effects of prenatal exposure to NO2on children's neurodevelopment: a systematic review and meta-analysis ".Environmental Science and Pollution Research.27(20): 24786–24798.Bibcode:2020ESPR...2724786S.doi:10.1007/s11356-020-08832-y.ISSN1614-7499.PMC7329770.PMID32356052.S2CID216650267.
- ^Allen JL, Liu X, Pelkowski S, Palmer B, Conrad K, Oberdörster G, et al. (5 June 2014)."Early Postnatal Exposure to Ultrafine Particulate Matter Air Pollution: Persistent Ventriculomegaly, Neurochemical Disruption, and Glial Activation Preferentially in Male Mice".Environmental Health Perspectives.122(9): 939–945.doi:10.1289/ehp.1307984.ISSN0091-6765.PMC4154219.PMID24901756.
- ^McEnaney M (7 June 2014)."Air pollution link discovered to autism, schizophrenia risks".Tech Times.Retrieved8 June2014.
- ^"New evidence links air pollution to autism, schizophrenia".ScienceDaily.5 June 2014.Retrieved28 August2024.
- ^Persico C, Marcotte DE (November 2022).Air Quality and Suicide.Working Paper Series. National Bureau of Economic Research.doi:10.3386/w30626.
{{cite book}}:CS1 maint: date and year (link) - ^Symons A (15 December 2022)."Suicide rates rise as air quality worsens, study finds".euronews.Retrieved19 December2022.
- ^"New Study Demonstrates Indoor Building Environment Has Significant, Positive Impact on Cognitive Function".The New York Times.26 October 2015. Archived fromthe originalon 9 November 2020.Retrieved10 November2015.
- ^Allen JG, MacNaughton P, Satish U, Santanam S, Vallarino J, Spengler JD (2015)."Associations of Cognitive Function Scores with Carbon Dioxide, Ventilation, and Volatile Organic Compound Exposures in Office Workers: A Controlled Exposure Study of Green and Conventional Office Environments".Environmental Health Perspectives.124(6): 805–12.doi:10.1289/ehp.1510037.PMC4892924.PMID26502459.S2CID12756582.
- ^Cedeño Laurent JG, MacNaughton P, Jones E, Young AS, Bliss M, Flanigan S, et al. (1 September 2021)."Associations between acute exposures to PM2.5 and carbon dioxide indoors and cognitive function in office workers: a multicountry longitudinal prospective observational study".Environmental Research Letters.16(9): 094047.Bibcode:2021ERL....16i4047C.doi:10.1088/1748-9326/ac1bd8.ISSN1748-9326.PMC8942432.PMID35330988.S2CID237462480.
- ^Qian D (29 June 2017)."Air Pollution and Mortality in the Medicare Population".New England Journal of Medicine.376(26): 2513–2522.doi:10.1056/NEJMoa1702747.PMC5766848.PMID28657878.S2CID12038778.
- ^Pathak M, Kuttippurath J (2022)."Air quality trends in rural India: analysis of NO2 pollution using satellite measurements".Environmental Science: Processes & Impacts.24(12): 2437–2449.doi:10.1039/D2EM00293K.ISSN2050-7887.PMID36413251.S2CID253261324.
- ^Woodyatt A (3 June 2020)."Scientists say they have found the cleanest air on Earth".CNN.Retrieved3 June2020.
- ^Hong C, Mueller ND, Burney JA, Zhang Y, AghaKouchak A, Moore FC, et al. (2020)."Impacts of ozone and climate change on yields of perennial crops in California".Nature Food.1(3): 166–172.doi:10.1038/s43016-020-0043-8.S2CID216425480.
- ^Li H, Tang M, Cao A, Guo L (2022)."Assessing the relationship between air pollution, agricultural insurance, and agricultural green total factor productivity: evidence from China".Environmental Science and Pollution Research.29(52): 78381–78395.Bibcode:2022ESPR...2978381L.doi:10.1007/s11356-022-21287-7.ISSN0944-1344.PMID35689771.S2CID249551277.
- ^Kashyap R, Kuttippurath J, Patel VK (2023)."Improved air quality leads to enhanced vegetation growth during the COVID–19 lockdown in India".Applied Geography.151:102869.Bibcode:2023AppGe.15102869K.doi:10.1016/j.apgeog.2022.102869.ISSN0143-6228.PMC9805897.PMID36619606.S2CID255439854.
- ^Kuttippurath J, Singh A, Dash SP, Mallic N, Clerbaux C, Van Damme M, et al. (2020)."Record high levels of atmospheric ammonia over India: Spatial and temporal analyses".Science of the Total Environment.740:139986.Bibcode:2020ScTEn.74039986K.doi:10.1016/j.scitotenv.2020.139986.ISSN0048-9697.PMID32927535.S2CID221722300.
- ^RWDI Consulting (2005)."Health and air quality 2005 – Phase 2: Valuation of health impacts from air quality in the lower Fraser Valley airshed"(PDF).Archived fromthe original(PDF)on 15 May 2011.Retrieved29 August2010.
- ^UN Environment (11 October 2018)."Air pollution linked to" huge "reduction in intelligence".UN Environment.Retrieved1 July2019.
- ^Lavy V, Rachkovski G, Yoresh O (2022).Heads Up: Does Air Pollution Cause Workplace Accidents?(Report). Cambridge, MA: National Bureau of Economic Research.doi:10.3386/w30715.
- ^Smith A (12 February 2021)."Pollution on other planets could help us find aliens, Nasa says".The Independent.Archivedfrom the original on 12 February 2021.Retrieved6 March2021.
- ^"Can Alien Smog Lead Us to Extraterrestrial Civilizations?".Wired.Retrieved6 March2021.
- ^Kopparapu R, Arney G, Haqq-Misra J, Lustig-Yaeger J, Villanueva G (22 February 2021)."Nitrogen Dioxide Pollution as a Signature of Extraterrestrial Technology".The Astrophysical Journal.908(2): 164.arXiv:2102.05027.Bibcode:2021ApJ...908..164K.doi:10.3847/1538-4357/abd7f7.ISSN1538-4357.S2CID231855390.
- ^Chakrabarti S."20th anniversary of world's worst industrial disaster".Australian Broadcasting Corporation.
- ^Bell ML, Davis DL, Fletcher T (January 2004)."A Retrospective Assessment of Mortality from the London Smog Episode of 1952: The Role of Influenza and Pollution".Environ Health Perspect.112(1): 6–8.doi:10.1289/ehp.6539.PMC1241789.PMID14698923.S2CID13045119.
- ^Meselson M, Guillemin J, Hugh-Jones M (November 1994)."The Sverdlovsk anthrax outbreak of 1979"(PDF).Science.266(5188): 1202–08.Bibcode:1994Sci...266.1202M.doi:10.1126/science.7973702.PMID7973702.Archived fromthe original(PDF)on 21 September 2006.
- ^Davis D (2002).When Smoke Ran Like Water: Tales of Environmental Deception and the Battle Against Pollution.Basic Books.ISBN978-0-465-01521-4.
- ^Landrigan P (25 November 2016). "Air pollution and health".Lancet.2(1): E4–E5.doi:10.1016/S2468-2667(16)30023-8.PMID29249479.
- ^Camahan JV,Thurston DL(1998). "Trade-off Modeling for Product and Manufacturing Process Design for the Environment".Journal of Industrial Ecology.2(1): 79–92.Bibcode:1998JInEc...2...79C.doi:10.1162/jiec.1998.2.1.79.ISSN1530-9290.S2CID154730593.
- ^Jacobson MZ, von Krauland AK, Coughlin SJ, Palmer FC, Smith MM (1 January 2022)."Zero air pollution and zero carbon from all energy at low cost and without blackouts in variable weather throughout the U.S. with 100% wind-water-solar and storage".Renewable Energy.184:430–442.Bibcode:2022REne..184..430J.doi:10.1016/j.renene.2021.11.067.ISSN0960-1481.S2CID244820608.
- ^Gielen D, Boshell F, Saygin D, Bazilian MD, Wagner N, Gorini R (1 April 2019). "The role of renewable energy in the global energy transformation".Energy Strategy Reviews.24:38–50.Bibcode:2019EneSR..24...38G.doi:10.1016/j.esr.2019.01.006.ISSN2211-467X.S2CID135283552.
- ^Burns J, Boogaard H, Polus S, Pfadenhauer LM, Rohwer AC, van-Erp AM, et al. (20 May 2019)."Interventions to Reduce Ambient Particulate Matter Air Pollution and Their Effect on Health".Cochrane Database of Systematic Reviews.2019(5): CD010919.doi:10.1002/14651858.CD010919.pub2.PMC6526394.PMID31106396.
- ^Connolly K (30 August 2022)."Germany's €9 train tickets scheme 'saved 1.8m tons of CO2emissions'".The Guardian.Retrieved6 December2022.
- ^Fensterstock JC, Kurtzweg JA, Ozolins G (1971). "Reduction of Air Pollution Potential through Environmental Planning".Journal of the Air Pollution Control Association.21(7): 395–399.doi:10.1080/00022470.1971.10469547.PMID5148260.
- ^Fensterstock, Ketcham and Walsh, The Relationship of Land Use and Transportation Planning to Air Quality Management, Ed. George Hagevik, May 1972.
- ^"The Importance of Development Plans/Land Use Policy for Development Control".www.oas.org.Retrieved17 June2022.
- ^Kuttippurath J, Patel VK, Pathak M, Singh A (2022)."Improvements in SO2 pollution in India: role of technology and environmental regulations".Environmental Science and Pollution Research.29(52): 78637–78649.Bibcode:2022ESPR...2978637K.doi:10.1007/s11356-022-21319-2.ISSN1614-7499.PMC9189448.PMID35696063.S2CID249613744.
- ^Palmer J (12 November 2011)."'Smog-Eating' Material Breaking into the Big Time ".BBC News.
- ^"Nanotechnology to gobble up pollution".BBC News.15 May 2014.Retrieved29 October2014.
- ^abJacobson MZ(2015). "100% clean and renewable wind, water, and sunlight (WWS) all-sector energy road maps for the 50 United States".Energy and Environmental Science.8(7): 2093–2117.doi:10.1039/C5EE01283J.
- ^Krelling C, Badami MG (1 January 2022)."Cost-effectiveness analysis of compressed natural gas implementation in the public bus transit fleet in Delhi, India".Transport Policy.115:49–61.doi:10.1016/j.tranpol.2021.10.019.ISSN0967-070X.
- ^Landrigan PJ (1 January 2017). "Air pollution and health".The Lancet Public Health.2(1): e4–e5.doi:10.1016/S2468-2667(16)30023-8.ISSN2468-2667.PMID29249479.
- ^Lyons TJ, Kenworthy JR, Newman PW (1 January 1990). "Urban structure and air pollution".Atmospheric Environment. Part B. Urban Atmosphere.24(1): 43–48.Bibcode:1990AtmEB..24...43L.doi:10.1016/0957-1272(90)90008-I.ISSN0957-1272.
- ^McVeigh K (28 September 2021)."'False choice': is deep-sea mining required for an electric vehicle revolution? ".The Guardian.Retrieved24 October2021.
- ^Opray M (24 August 2017)."Nickel mining: the hidden environmental cost of electric cars".The Guardian.Retrieved24 October2021.
- ^"Los Angeles Airport Pollutes City Air For Miles Downwind".Chemical and Engineering news. 30 May 2014.Retrieved13 December2019.
- ^"NASA Confirms Biofuels Reduce Jet Emissions".Flyingmag.com.23 March 2017.Retrieved11 January2018.
- ^"Interseasonal Heat Transfer – Seasonal Heat Storage – GSHC – Renewable Heat & Renewable Cooling from ThermalBanks – Efficient Renewable Energy – Hybrid Renewable Energy Systems".Icax.co.uk.Retrieved11 January2018.
- ^Ahuja D, Tatsutani M (7 April 2009)."Sustainable energy for developing countries".S.A.P.I.EN.S(in French).2(1).ISSN1993-3800.
- ^Oyedepo SO (23 July 2012)."Energy and sustainable development in Nigeria: the way forward".Energy, Sustainability and Society.2(1): 15.Bibcode:2012ESusS...2...15O.doi:10.1186/2192-0567-2-15.ISSN2192-0567.S2CID40436190.
- ^"Road Rubber".Sciencenetlinks.com Science Updates – Science NetLinks.Retrieved11 January2018.
- ^Simeonova E (March 2018)."Congestion Pricing, Air Pollution and Children's Health".National Bureau of Environmental Research.Working Paper Series.doi:10.3386/w24410.
- ^Academy S (16 April 2022)."Impact Of Air Pollution On The Environment".Samphina.Retrieved18 June2022.
- ^"Subway air pollution damages passenger health".Chemistryworld.com.Retrieved11 January2018.
- ^Singla S, Bansal D, Misra A, Raheja G (31 August 2018). "Towards an integrated framework for air quality monitoring and exposure estimation-a review".Environmental Monitoring and Assessment.190(9): 562.Bibcode:2018EMnAs.190..562S.doi:10.1007/s10661-018-6940-8.ISSN1573-2959.PMID30167891.S2CID52135179.
- ^Zarrar H, Dyo V (1 October 2023)."Drive-by Air Pollution Sensing Systems: Challenges and Future Directions".IEEE Sensors Journal.23(19): 23692–23703.Bibcode:2023ISenJ..2323692Z.doi:10.1109/JSEN.2023.3305779.hdl:10547/625961.S2CID261152934.
- ^Kaivonen S, Ngai EC (1 February 2020). "Real-time air pollution monitoring with sensors on city bus".Digital Communications and Networks.6(1): 23–30.doi:10.1016/j.dcan.2019.03.003.ISSN2352-8648.S2CID88485659.
- ^Zhang R, Zhang Y, Lin H, Feng X, Fu TM, Wang Y (April 2020)."NOx Emission Reduction and Recovery during COVID-19 in East China".Atmosphere.11(4): 433.Bibcode:2020Atmos..11..433Z.doi:10.3390/atmos11040433.S2CID219002558.
- ^"Airborne Nitrogen Dioxide Plummets Over China".earthobservatory.nasa.gov.28 February 2020.Archivedfrom the original on 2 April 2020.Retrieved6 April2020.
- ^"Analysis: Coronavirus temporarily reduced China's CO2emissions by a quarter ".Carbon Brief.19 February 2020.Archivedfrom the original on 4 March 2020.Retrieved6 April2020.
- ^"New monitoring technologies can help cities combat air pollution".World Economic Forum.15 April 2021.Retrieved24 October2021.
- ^Yu T, Wang W, Ciren P, Sun R (18 October 2018). "An assessment of air-quality monitoring station locations based on satellite observations".International Journal of Remote Sensing.39(20): 6463–6478.Bibcode:2018IJRS...39.6463Y.doi:10.1080/01431161.2018.1460505.ISSN0143-1161.S2CID135457028.
- ^"Pollution is Personal".The Atlantic.Retrieved20 December2021.
- ^"World Air Map: Live air quality everywhere in the world".Plume Labs Air Report.Retrieved20 December2021.
- ^"Live Animated Air Quality Map (AQI, PM2.5...) | AirVisual".IQAir.Retrieved27 January2022.
- ^European Commission(11 May 2011)."European Commission - Environment - Air - Air quality".Archived fromthe originalon 11 May 2011.
- ^Canada Ea (10 September 2007)."About the Air Quality Health Index".Canada.ca.Retrieved27 February2022.
- ^"Environment Canada – Air Quality".Ec.gc.ca.10 September 2007.Retrieved11 November2011.
- ^"Environment Canada – AQHI categories and explanations".Ec.gc.ca.16 April 2008.Retrieved11 November2011.
- ^"German TA-Luft is guaranteed by us".centrotherm clean solutions.Archived fromthe originalon 29 June 2022.Retrieved27 February2022.
- ^abEuropa (1996)."Summaries of EU legislation – Management and quality of ambient air".Retrieved24 January2015.
- ^"PRESS RELEASE No 58/08 Judgment of the Court of Justice in Case C-237/07"(PDF).European Court of Justice.2008.Retrieved24 January2015.
- ^Overview of relevant case law and critical state of air pollution protection in the EU: Winfried Huck, Jennifer Maaß, Saparya Sood, Tahar Benmaghnia, Alexander Schulte, Sarah Heß and Marc-Anthony Walter, The Right to Breathe Clean Air and Access to Justice - Legal State of Play in International, European and National Law (2021) in 8(22) International Institutions: Transnational Networks eJournal, available at:http://dx.doi.org/10.2139/ssrn.3808572
- ^European Commission."Air quality: Commission sends final warning to UK over levels of fine particle pollution".Archived fromthe originalon 11 May 2011.Retrieved7 April2011.
- ^House of Commons Environmental Audit Committee (2010)."Environmental Audit Committee – Fifth Report Air Quality".Retrieved24 January2015.
- ^abMulholland H (11 March 2011)."Britain fends off threat of £300m fine over London air pollution".The Guardian.Retrieved24 January2015.
- ^"Every Breath You Take"(PDF).London Assembly Environment Committee.May 2009. Archived fromthe original(PDF)on 22 February 2015.Retrieved22 February2015.
- ^BBC (6 December 2010)."Threat to sue over London congestion charge scrapping".BBC News.Retrieved24 January2015.
- ^Risse-Kappen T (1995).Bringing transnational relations back in: non-state actors, domestic structures, and international institutions.Cambridge:Cambridge University Press.pp. 3–34.
- ^abPattberg P, Stripple J (2008)."Beyond the public and private divide: remapping transnational climate governance in the 21st century".International Environmental Agreements: Politics, Law and Economics.8(4): 367–388.Bibcode:2008IEAPL...8..367P.doi:10.1007/s10784-008-9085-3.S2CID62890754.
- ^Roman M (2010). "Governing from the middle: the C40 Cities Leadership Group".Corporate Governance.10(1): 73–84.doi:10.1108/14720701011021120.
- ^"Tribes do their part to keep air clean. Now, they want to make sure pollution from afar doesn't put that at risk".USA TODAY.Retrieved16 April2024.
- ^"Air pollution hot spot".Retrieved24 April2014.
- ^Pettit D (14 December 2014)."Global Toll of Air Pollution: Over 3 Million Deaths Each Year".Switchboard NRDC. Archived fromthe originalon 8 May 2014.
- ^"Watch air pollution flow across the planet in real time".Science Magazine News.28 November 2016.
- ^abDrury R, Belliveau M, Kuhn JS, Shipra B (Spring 1999). "Pollution Trading and Environmental Justice: Los Angeles' Failed Experiment in Air Pollution Policy".Duke Environmental Law & Policy Forum.9(231).
- ^abMorello-Frosch R, Zuk M, Jerrett M, Shamasunder B, Kyle AD (2011)."Understanding the Cumulative Impacts of Inequalities in Environmental Health: Implications for Policy".Health Affairs.30(5): 879–87.doi:10.1377/hlthaff.2011.0153.PMID21555471.
- ^Mohai P, Lantz P, Morenoff J, House J, Mero R (2009)."Racial and Socioeocnomic Disparities in Residential Proximity".American Journal of Public Health.99(3): S649–56.doi:10.2105/ajph.2007.131383.PMC2774179.PMID19890171.
- ^Lerner S (2010). "Sacrifice Zones: The Front Lines of Toxic Chemical Exposure in the United States".Port Arthur, Texas: Public Housing Residents Breathe Contaminated Air from Nearby Refineries and Chemical Plants.MIT Press.
- ^Vohra K, Marais EA, Bloss WJ, Schwartz J, Mickley LJ, Van Damme M, et al. (8 April 2022)."Rapid rise in premature mortality due to anthropogenic air pollution in fast-growing tropical cities from 2005 to 2018".Science Advances.8(14): eabm4435.Bibcode:2022SciA....8M4435V.doi:10.1126/sciadv.abm4435.ISSN2375-2548.PMC8993110.PMID35394832.
- ^Michelozzi P, Forastiere F, Fusco D, Perucci CA, Ostro B, Ancona C, et al. (1998)."Air Pollution and Daily Mortality in Rome, Italy".Occupational and Environmental Medicine.55(9): 605–10.doi:10.1136/oem.55.9.605.JSTOR27730990.PMC1757645.PMID9861182.
- ^The Daily Telegraph 8 January 2014 'Air pollution killing up to 500,000 Chinese each year, admits former health minister'.
- ^"World's Most Polluted Cities in 2020 - PM2.5 Ranking | AirVisual".www.iqair.com.Retrieved1 February2022.
- ^"World Air Quality Index (AQI) Ranking | IQAir".www.iqair.com.Retrieved24 May2022.
- ^Darame M (29 November 2019)."En Afrique de l'Ouest, une pollution mortelle mais d'ampleur inconnue"[In West Africa, deadly pollution but of unknown magnitude].Le Monde(in French).
- ^Organisation for Economic Co-operation and Development(1 March 2012)."Environmental Outlook to 2050 - OECD"(PDF).OECD.
Further reading
[edit]- Brimblecombe P(1987).The Big Smoke: A History of Air Pollution in London Since Medieval Times.Routledge.ISBN978-1-136-70329-4.
- Brimblecombe P(1995). "1: History of air pollution". In Singh H (ed.).Composition, chemistry, and climate of the atmosphere.New York: John Wiley & Sons. pp. 1–18.ISBN978-0-471-28514-4.OCLC43084000.
- Brimblecombe P,Makra L(2005). "Selections from the history of environmental pollution, with special attention to air pollution. Part 2*: From medieval times to the 19th century".International Journal of Environment and Pollution.23(4): 351–67.doi:10.1504/ijep.2005.007599.
- Cherni, Judith A.Economic Growth versus the Environment: The Politics of Wealth, Health and Air Pollution(2002)online
- Corton, Christine L.London Fog: The Biography(2015)
- Currie, Donya. "WHO: Air Pollution a Continuing Health Threat in World's Cities",The Nation's Health(February 2012) 42#1online
- Dewey, Scott Hamilton.Don't Breathe the Air: Air Pollution and US Environmental Politics, 1945–1970(Texas A & M University Press, 2000)
- Gonzalez, George A.The politics of air pollution: Urban growth, ecological modernization, and symbolic inclusion(SUNY Press, 2012)
- Grinder RD (1978). "From Insurgency to Efficiency: The Smoke Abatement Campaign in Pittsburgh before World War I.".Western Pennsylvania Historical Magazine.61(3): 187–202.
- Grinder, Robert Dale. "The Battle for Clean Air: The Smoke Problem in Post-Civil War America" in Martin V. Melosi, ed.,Pollution & Reform in American Cities, 1870–1930(1980), pp. 83–103.
- Kumar P, Pirjola L, Ketzel M, Harrison RM (2013)."Nanoparticle emissions from 11 non-vehicle exhaust sources – A review".Atmospheric Environment.67.Elsevier BV: 252–277.Bibcode:2013AtmEn..67..252K.doi:10.1016/j.atmosenv.2012.11.011.ISSN1352-2310.
- Lundqvist LJ (1980).The Hare and the Tortoise: Clean Air Policy in the US and Sweden.Ann Arbor, MI: University of Michigan Press.ISBN978-0-472-09310-6.
- Mingle, Jonathan, "Our Lethal Air" [review of Gary Fuller,The Invisible Killer...;Beth Gardiner,Choked...;Tim Smedley,Clearing the Air...;U.S. Environmental Protection Agency,Integrated Science Assessment forParticulate Matter(External Review Draft, 2018);and Chartered Clean Air Scientific Advisory Committee,Letter to EPA Administrator on the EPA's Integrated Science Assessment for Particulate Matter, 11 April 2019],The New York Review of Books,vol. LXVI, no. 14 (26 September 2019), pp. 64–66, 68. "Today, 91 percent of people worldwide live in areas where air pollution levels exceed the World Health Organization's recommended limits.... [T]here is no safe level of exposure to fineparticulate matter.... Most of these fine particles are a by-product of... burning...coal,gasoline,diesel,wood,trash... These particles can get past the defenses of ourupper airwaysto penetrate deep into ourlungsand reach thealveoli... From there, they cross into thebloodstreamand spread throughout the body. They can travel through thenose,up theolfactory nerve,and lodge... in thebrain.They can form deposits on the lining ofarteries,constrictingblood vesselsand raising the likelihood of...strokesandheart attacks.[T]hey exacerbate respiratory illnesses likeasthmaandchronic obstructive pulmonary disease... There's... evidence linking air pollution exposure to an increased risk ofAlzheimer'sand other forms ofdementia."(p. 64.)
- Mosley, Stephen. The chimney of the world: a history of smoke pollution in Victorian and Edwardian Manchester. Routledge, 2013.
- Schreurs, Miranda A.Environmental Politics in Japan, Germany, and the United States(Cambridge University Press, 2002)online
- Thorsheim, Peter.Inventing Pollution: Coal, Smoke, and Culture in Britain since 1800(2009)
External links
[edit]- WHO fact sheet on outdoor air pollution
- Air Pollution: Everything You Need to KnowGuide by the Natural Resources Defense Council (NRDC)
- Global real-time air quality index map
- Air Quality Index (AQI) Basics
- AQI CalculatorAQI to Concentration and Concentration to AQI for five pollutants
- UNEP Urban environmental planning
- European Commission > Environment > Air > Air Quality
- Database: outdoor air pollution in citiesfrom the World Health Organization
- The Mortality Effects of Long-Term Exposure to Particulate Air Pollution in the United Kingdom,UK Committee on the Medical Effects of Air Pollution, 2010.
- Hazardous air pollutants|What are hazardous pollutantsat EPA.gov
