
Standard illuminant
This articleis missing informationabout ISO 7589 standard illuminants; CIE indoor ID50 and ID65 illuminants; CIE FL3.1 through FL3.15 "new fluorescent" illuminants; CIE HP "high-pressure discharge" illuminants, all found with references insds.py.(January 2024) |

Astandard illuminantis a theoretical source ofvisible lightwith aspectral power distributionthat is published. Standard illuminants provide a basis for comparing images or colors recorded under different lighting.
CIE illuminants
[edit]TheInternational Commission on Illumination(usually abbreviatedCIEfor its French name) is the body responsible for publishing all of the well-known standard illuminants. Each of these is known by a letter or by a letter-number combination.
Illuminants A, B, and C were introduced in 1931, with the intention of respectively representing average incandescent light, direct sunlight, and average daylight. Illuminants D (1967) represent variations of daylight, illuminant E is the equal-energy illuminant, while illuminants F (2004) represent fluorescent lamps of various composition.
There are instructions on how to experimentally produce light sources ( "standard sources" ) corresponding to the older illuminants. For the relatively newer ones (such as series D), experimenters are left to measure to profiles of their sources and compare them to the published spectra:[1]
At present no artificial source is recommended to realize CIE standard illuminant D65 or any other illuminant D of different CCT. It is hoped that new developments in light sources and filters will eventually offer sufficient basis for a CIE recommendation.
— CIE, Technical Report (2004) Colorimetry, 3rd ed., Publication 15:2004, CIE Central Bureau, Vienna
Nevertheless, they do provide a measure, called themetamerism index,to assess the quality of daylight simulators.[2][3]TheMetamerismIndex tests how well five sets of metameric samples match under the test and reference illuminant. In a manner similar to thecolor rendering index,the average difference between the metamers is calculated.[4]
Illuminant A
[edit]The CIE defines illuminant A in these terms:
CIE standard illuminant A is intended to represent typical, domestic, tungsten-filament lighting. Its relative spectral power distribution is that of a Planckian radiator at a temperature of approximately 2856 K. CIE standard illuminant A should be used in all applications of colorimetry involving the use of incandescent lighting, unless there are specific reasons for using a different illuminant.
Thespectral radiant exitanceof ablack bodyfollowsPlanck's law:

At the time of standardizing illuminant A, both(which does not affect the relative SPD) andwere different. In 1968, the estimate of c2was revised from 0.01438 m·K to 0.014388 m·K (and before that, it was 0.01435 m·K when illuminant A was standardized). This difference shifted thePlanckian locus,changing the color temperature of the illuminant from its nominal 2848 K to 2856 K:


In order to avoid further possible changes in the color temperature, the CIE now specifies the SPD directly, based on the original (1931) value of c2:[1]

The coefficients have been selected to achieve a normalized SPD of100at560 nm.The tristimulus values are(X,Y,Z) = (109.85, 100.00, 35.58),and the chromaticity coordinates using the standard observer are(x,y) = (0.44758, 0.40745).
Illuminants B and C
[edit]Illuminants B and C are easily achieved daylight simulations. They modify illuminant A by using liquid filters. B served as a representative of noon sunlight, with acorrelated color temperature(CCT) of 4874 K, while C represented average day light with a CCT of 6774 K. Unfortunately, they are poor approximations of any phase of natural daylight, particularly in the short-wave visible and in the ultraviolet spectral ranges. Once more realistic simulations were achievable, illuminants B and C were deprecated in favor of the D series.[1]
Illuminant C does not have the status of CIE standard illuminants but its relative spectral power distribution, tristimulus values and chromaticity coordinates are given in Table T.1 and Table T.3, as many practical measurement instruments and calculations still use this illuminant.
— CIE, Publication 15:2004[5]
Illuminant B was not so honored in 2004.
The liquid filters, designed byRaymond Davis, Jr.and Kasson S. Gibson in 1931,[6]have a relatively high absorbance at the red end of the spectrum, effectively increasing the CCT of theincandescent lampto daylight levels. This is similar in function to a CTBcolor gelthat photographers and cinematographers use today, albeit much less convenient.
Each filter uses a pair of solutions, comprising specific amounts of distilled water,copper sulfate,mannite,pyridine,sulfuric acid,cobalt,andammonium sulfate.The solutions are separated by a sheet of uncolored glass. The amounts of the ingredients are carefully chosen so that their combination yields a color temperature conversion filter; that is, the filtered light is still white.
Illuminant series D
[edit]
TheDseries of illuminants are designed to represent natural daylight and lie along thedaylight locus.They are difficult to produce artificially, but are easy to characterize mathematically.
By 1964, several spectral power distributions (SPDs) of daylight had been measured independently by H. W. Budde of theNational Research Council of CanadainOttawa,H. R. Condit and F. Grum of theEastman Kodak CompanyinRochester, New York,[7]and S. T. Henderson and D. Hodgkiss ofThorn Electrical IndustriesinEnfield (north London),[8]totaling among them 622 samples.Deane B. Judd,David MacAdam,andGünter Wyszeckianalyzed these samples and found that the(x,y) chromaticity coordinatesfollowed a simple,quadraticrelation, later known as the daylight locus:[9]

Characteristic vector analysisrevealed that the SPDs could be satisfactorily approximated by using the mean (S0) and first two characteristic vectors (S1and S2):[10][11]


In simpler terms, the SPD of the studied daylight samples can be expressed as thelinear combinationof three, fixed SPDs. The first vector (S0) is the mean of all the SPD samples, which is the best reconstituted SPD that can be formed with only a fixed vector. The second vector (S1) corresponds to yellow–blue variation (along the locus), accounting for changes in thecorrelated color temperaturedue to proportion of indirect to direct sunlight.[9]The third vector (S2) corresponds to pink–green variation (across the locus) caused by the presence of water in the form of vapor and haze.[9]

By the time the D-series was formalized by the CIE,[12]a computation of the chromaticityfor a particular isotherm was included.[13]Juddet al.then extended the reconstituted SPDs to300 nm–330 nmand700 nm–830 nmby using Moon's spectral absorbance data of the Earth's atmosphere.[14]The tabulated SPDs presented by the CIE today are derived bylinear interpolationof the10 nmdata set down to5 nm.[15]However, there is a proposal to usespline interpolationinstead.[16]

Similar studies have been undertaken in other parts of the world, or repeating Juddet al.'s analysis with modern computational methods. In several of these studies, the daylight locus is notably closer to the Planckian locus than in Juddet al.[17] [18]
The CIE positions D65 as the standard daylight illuminant:
[D65] is intended to represent average daylight and has a correlated colour temperature of approximately 6500 K. CIE standard illuminant D65 should be used in all colorimetric calculations requiring representative daylight, unless there are specific reasons for using a different illuminant. Variations in the relative spectral power distribution of daylight are known to occur, particularly in the ultraviolet spectral region, as a function of season, time of day, and geographic location.
— ISO 10526:1999/CIE S005/E-1998, CIE Standard Illuminants for Colorimetry[19]


Computation
[edit]The relativespectral power distribution(SPD)of a D series illuminant can be derived from itschromaticity coordinatesin theCIE 1931 color space,.[20]First, the chromaticity coordinates must be determined:


whereTis the illuminant's CCT. Note that the CCTs of the canonical illuminants, D50,D55,D65,and D75,differ slightly from what their names suggest. For example, D50 has a CCT of 5003 K ( "horizon" light), whileD65has a CCT of 6504 K (noon light). This is because the value of the constants in Planck's law have been slightly changed since the definition of these canonical illuminants, whose SPDs are based on the original values in Planck's law.[1]The same discrepancy applies to all illuminants in the D series—D50,D55,D65,D75—and can be "rectified" by multiplying the nominal color temperature by;for examplefor D65.


To determine the D-series SPD (SD) that corresponds to those coordinates, the coefficients M1and M2of the characteristic vectors S1and S2are determined:


whereare the mean and first twoeigenvectorSPDs, depicted in figure.[20]The characteristic vectors both have a zero at560 nm,since all the relative SPDs have been normalized about this point. In order to match all significant digits of the published data of the canonical illuminants the values of M1and M2have to be rounded to three decimal places before calculation ofSD.[1]

D65 values
[edit]Using thestandard 2° observer,theCIE 1931 color spacechromaticity coordinatesof D65 are[21]

and theXYZ tristimulus values(normalized toY= 100), are

For thesupplementary 10° observer,[citation needed]
and the corresponding XYZ tristimulus values are


Since D65 representswhitelight, its coordinates are also awhite point,corresponding to acorrelated color temperatureof 6504 K.Rec. 709,used inHDTVsystems, truncates the CIE 1931 coordinates to x=0.3127, y=0.329.
Daylight simulator
[edit]There are no actual daylight light sources, only simulators. Constructing a practical light source that emulates a D-series illuminant is a difficult problem. The chromaticity can be replicated simply by taking a well known light source and applying filters, such as the Spectralight III, that used filtered incandescent lamps.[22]However, the SPDs of these sources deviate from the D-series SPD, leading to bad performance on the CIEmetamerism index.[23][24]Better sources were achieved in the 2010s withphosphor-coated white LEDsthat can easily emulate the A, D, and E illuminants with high CRI.[25]
Illuminant E
[edit]
Illuminant E is an equal-energy radiator; it has a constant SPD inside thevisible spectrum.It is useful as a theoretical reference; an illuminant that gives equal weight to all wavelengths. It also has equalCIE XYZtristimulus values, thus its chromaticity coordinates are (x,y)=(1/3,1/3). This is by design; the XYZ color matching functions are normalized such that their integrals over the visible spectrum are the same.[1]
Illuminant E is not a black body, so it does not have a color temperature, but it can be approximated by a D series illuminant with a CCT of 5455 K. (Of the canonical illuminants, D55is the closest.) Manufacturers sometimes compare light sources against illuminant E to calculate theexcitation purity.[26]
Illuminant series F
[edit]TheFseries of illuminants represent various types offluorescent lighting.
F1–F6 "standard" fluorescent lamps consist of two semi-broadband emissions ofantimonyandmanganeseactivations in calcium halophosphatephosphor.[27]F4 is of particular interest since it was used for calibrating the CIEcolor rendering index(the CRI formula was chosen such that F4 would have a CRI of 51). F7–F9 are "broadband" (full-spectrum light) fluorescent lamps with multiple phosphors, and higher CRIs. Finally, F10–F12 are narrow triband illuminants consisting of three "narrowband" emissions (caused by ternary compositions of rare-earth phosphors) in the R,G,B regions of the visible spectrum. The phosphor weights can be tuned to achieve the desired CCT.
The spectra of these illuminants are published in Publication 15:2004.[5][28]
-
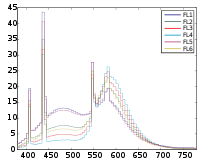 FL 1–6:Standard
 -
 FL 7–9:Broadband
 -
 FL 10–12:Narrowband


Illuminant series LED
[edit]Publication 15:2018 introduces new illuminants for differentwhite LEDtypes with CCTs ranging from approx. 2700 K to 6600 K.
LED-B1 through B5 defines LEDs with phosphor-converted blue light. LED-BH1 defines a blend of phosphor-converted blue and a red LED. LED-RGB1 defines the white light produced by a tricolor LED mix. LED-V1 and V2 define LEDs with phosphor-converted violet light.
White point
[edit]The spectrum of a standard illuminant, like any other profile of light, can be converted intotristimulus values.The set of three tristimulus coordinates of an illuminant is called awhite point.If the profile isnormalized,then the white point can equivalently be expressed as a pair ofchromaticity coordinates.
If an image is recorded in tristimulus coordinates (or in values which can be converted to and from them), then the white point of the illuminant used gives the maximum value of the tristimulus coordinates that will be recorded at any point in the image, in the absence offluorescence.It is called the white point of the image.
The process of calculating the white point discards a great deal of information about the profile of the illuminant, and so although it is true that for every illuminant the exact white point can be calculated, it is not the case that knowing the white point of an image alone tells you a great deal about the illuminant that was used to record it.
White points of standard illuminants
[edit]A list of standardized illuminants, their CIE chromaticity coordinates (x,y) of a perfectly reflecting (or transmitting) diffuser, and theircorrelated color temperatures(CCTs) are given below. The CIE chromaticity coordinates are given for both the 2 degree field of view (1931) and the 10 degree field of view (1964).[29]The color swatches represent the color of each white point, automatically calculated by Wikipedia using theColor temperature template.
| Name | CIE 1931 2° | CIE 196410° | CCT(K) | Color | Note | ||
|---|---|---|---|---|---|---|---|
| x2° | y2° | x10° | y10° | ||||
| A | 0.44758 | 0.40745 | 0.45117 | 0.40594 | 2856 | incandescent / tungsten | |
| B | 0.34842 | 0.35161 | 0.34980 | 0.35270 | 4874 | obsolete, direct sunlight at noon | |
| C | 0.31006 | 0.31616 | 0.31039 | 0.31905 | 6774 | obsolete, average / North sky daylight NTSC 1953[34],PAL-M[35][a] | |
| D50 | 0.34567 | 0.35850 | 0.34773 | 0.35952 | 5003 | horizon light,ICC profilePCS[a] | |
| D55 | 0.33242 | 0.34743 | 0.33411 | 0.34877 | 5503 | mid-morning / mid-afternoon daylight | |
| D65 | 0.31272 | 0.32903 | 0.31382 | 0.33100 | 6504 | noon daylight:television,sRGB color space[a] | |
| D75 | 0.29902 | 0.31485 | 0.29968 | 0.31740 | 7504 | North sky daylight | |
| D93 | 0.28315 | 0.29711 | 0.28327 | 0.30043 | 9305 | high-efficiency blue phosphor monitors,BT.2035[a] | |
| E | 0.33333 | 0.33333 | 0.33333 | 0.33333 | 5454 | equal energy | |
| F1 | 0.31310 | 0.33727 | 0.31811 | 0.33559 | 6430 | daylight fluorescent | |
| F2 | 0.37208 | 0.37529 | 0.37925 | 0.36733 | 4230 | cool white fluorescent | |
| F3 | 0.40910 | 0.39430 | 0.41761 | 0.38324 | 3450 | white fluorescent | |
| F4 | 0.44018 | 0.40329 | 0.44920 | 0.39074 | 2940 | warm white fluorescent | |
| F5 | 0.31379 | 0.34531 | 0.31975 | 0.34246 | 6350 | daylight fluorescent | |
| F6 | 0.37790 | 0.38835 | 0.38660 | 0.37847 | 4150 | light white fluorescent | |
| F7 | 0.31292 | 0.32933 | 0.31569 | 0.32960 | 6500 | D65simulator, daylight simulator | |
| F8 | 0.34588 | 0.35875 | 0.34902 | 0.35939 | 5000 | D50 simulator, Sylvania F40 Design 50 | |
| F9 | 0.37417 | 0.37281 | 0.37829 | 0.37045 | 4150 | cool white deluxe fluorescent | |
| F10 | 0.34609 | 0.35986 | 0.35090 | 0.35444 | 5000 | Philips TL85, Ultralume 50 | |
| F11 | 0.38052 | 0.37713 | 0.38541 | 0.37123 | 4000 | Philips TL84, Ultralume 40 | |
| F12 | 0.43695 | 0.40441 | 0.44256 | 0.39717 | 3000 | Philips TL83, Ultralume 30 | |
| LED-B1 | 0.4560 | 0.4078 | 2733 | phosphor-converted blue | |||
| LED-B2 | 0.4357 | 0.4012 | 2998 | phosphor-converted blue | |||
| LED-B3 | 0.3756 | 0.3723 | 4103 | phosphor-converted blue | |||
| LED-B4 | 0.3422 | 0.3502 | 5109 | phosphor-converted blue | |||
| LED-B5 | 0.3118 | 0.3236 | 6598 | phosphor-converted blue | |||
| LED-BH1 | 0.4474 | 0.4066 | 2851 | mixing of phosphor-converted blue LED and red LED (blue-hybrid) | |||
| LED-RGB1 | 0.4557 | 0.4211 | 2840 | mixing of red, green, and blue LEDs | |||
| LED-V1 | 0.4560 | 0.4548 | 2724 | phosphor-converted violet | |||
| LED-V2 | 0.3781 | 0.3775 | 4070 | phosphor-converted violet | |||
References
[edit]- ^abcdefSchanda, János (2007). "3: CIE Colorimetry".Colorimetry: Understanding the CIE System.Wiley Interscience.pp. 37–46.ISBN978-0-470-04904-4.
- ^CIE Technical Report (1999).A Method for Assessing the Quality of Daylight Simulators for Colorimetry.51.2-1999 (including Supplement 1-1999). Paris: Bureau central de la CIE.ISBN978-92-9034-051-5.Archived fromthe originalon 2008-04-16.
A method is provided for evaluating the suitability of a test source as a simulator of CIE Standard Illuminants D55, D65, or D75. The Supplement, prepared in 1999, adds the CIE Illuminant D50 to the line of illuminants where the method can be applied to. For each of these standard illuminants, spectral radiance factor data are supplied for five pairs of nonfluorescent samples that are metameric matches. The colorimetric differences of the five pairs are computed for the test illuminant; the average of these differences is taken as the visible range metamerism index and is used as a measure of the quality of the test illuminant as a simulator for nonfluorescent samples. For fluorescent samples, the quality is further assessed in terms of an ultraviolet range metamerism index, defined as the average of the colorimetric differences computed with the test illuminant for three further pairs of samples, each pair consisting of a fluorescent and a nonfluorescent sample which are metameric under the standard illuminant.
- ^CIE Standard (2004).Standard Method of Assessing the Spectral Quality of Daylight Simulators for Visual Appraisal and Measurement of Colour.S012/E:2004.Prepared by TC 1-53 "A Standard Method for Assessing the Quality of Daylight Simulators".ISO Standard 23603:2005(E).
- ^Lam, Yuk-Ming; Xin, John H. (August 2002). "Evaluation of the quality of different D65 simulators for visual assessment".Color Research & Application.27(4): 243–251.doi:10.1002/col.10061.hdl:10397/26550.
- ^abCIE Technical Report (2004).Colorimetry.Publication 15:2004 (3rd ed.). CIE Central Bureau, Vienna.ISBN978-3-901906-33-6.Archived fromthe originalon 2008-02-13.
- ^Davis, Raymond; Gibson, Kasson S. (January 21, 1931). "Filters for the reproduction of sunlight and daylight and the determination of color temperature".Precision Measurement and Calibration.10.National Bureau of Standards:641–805.
- ^Condit, Harold R.; Grum, Frank (July 1964). "Spectral energy distribution of daylight".JOSA.54(7): 937–944.doi:10.1364/JOSA.54.000937.
- ^Henderson, Stanley Thomas; Hodgkiss, D. (1963). "The spectral energy distribution of daylight".British Journal of Applied Physics.14(3): 125–131.Bibcode:1963BJAP...14..125H.doi:10.1088/0508-3443/14/3/307.
Henderson, Stanley Thomas; Hodgkiss, D. (1964). "The spectral energy distribution of daylight".British Journal of Applied Physics.15(8): 947–952.Bibcode:1964BJAP...15..947H.doi:10.1088/0508-3443/15/8/310. - ^abcJudd, Deane B.; MacAdam, David L.; Wyszecki, Günter (August 1964). "Spectral Distribution of Typical Daylight as a Function of Correlated Color Temperature".JOSA.54(8): 1031–1040.doi:10.1364/JOSA.54.001031.
- ^Simonds, John L. (August 1963). "Application of Characteristic Vector Analysis to Photographic and Optical Response Data".JOSA.53(8): 968–974.doi:10.1364/JOSA.53.000968.
- ^Tzeng, Di-Yuan; Berns, Roy S. (April 2005). "A review of principal component analysis and its applications to color technology".Color Research & Application.30(2): 84–98.doi:10.1002/col.20086.
- ^Commission Internationale de l'Eclairage (1964).Proceedings of the 15th Session, Vienna.
- ^Kelly, Kenneth L. (August 1963). "Lines of Constant Correlated Color Temperature Based on MacAdam's (u,v) Uniform Chromaticity Transformation of the CIE Diagram".JOSA.53(8): 999–1002.doi:10.1364/JOSA.53.000999.
- ^Moon, Parry (November 1940). "Proposed standard solar-radiation curves for engineering use".Journal of the Franklin Institute.230(5): 583–617.doi:10.1016/S0016-0032(40)90364-7.
- ^CIE 1931 and 1964 Standard Colorimetric Observersfrom380 nmto780 nmin increments of5 nm.
- ^Kránicz, Balázs; Schanda, János (August 2000)."Re-evaluation of daylight spectral distributions".Color Research & Application.25(4): 250–259.CiteSeerX10.1.1.42.521.doi:10.1002/1520-6378(200008)25:4<250::AID-COL5>3.0.CO;2-D.
Later theS0(λ),S1(λ) andS2(λ) functions have been linearly interpolated at 5 nm steps and for even finer step-size also a linear interpolation has been recommended
- ^Studies from the 1960s and 1970s include:
- G. T. Winch; M. C. Boshoff; C. J. Kok & A. G. du Toit (April 1966). "Spectroradiometric and Colorimetric Characteristics of Daylight in the Southern Hemisphere: Pretoria, South Africa".JOSA.56(4): 456–464.doi:10.1364/JOSA.56.000456.
The derived chromaticities were found to be much closer to the full radiator locus than those previously published, which had been obtained in the northern hemisphere.
- Das, S.R.; Sastri, V.D.P. (March 1965). "Spectral Distribution and Color of Tropical Daylight".JOSA.55(3): 319–323.doi:10.1364/JOSA.55.000319.
- Sastri, V.D.P.; Das, S.R. (March 1968). "Typical Spectral Distributions and Color for Tropical Daylight".JOSA.58(3): 391–398.doi:10.1364/JOSA.58.000391.
- Sastri, V.D.P. (January 11, 1976). "Locus of daylight chromaticities in relation to atmospheric conditions".Journal of Physics D: Applied Physics.9(1): L1–L3.Bibcode:1976JPhD....9L...1S.doi:10.1088/0022-3727/9/1/001.S2CID250832186.
- Dixon, E.R. (April 1978). "Spectral distribution of Australian daylight".JOSA.68(4): 437–450.doi:10.1364/JOSA.68.000437.
- G. T. Winch; M. C. Boshoff; C. J. Kok & A. G. du Toit (April 1966). "Spectroradiometric and Colorimetric Characteristics of Daylight in the Southern Hemisphere: Pretoria, South Africa".JOSA.56(4): 456–464.doi:10.1364/JOSA.56.000456.
- ^Analyses using the faster computation of the 1990s and 2000s include:
- Hernández-Andrés, Javier; Javier Romero; Antonio García-Beltrán; Juan L. Nieves (February 20, 1998). "Testing Linear Models on Spectral Daylight Measurements".Applied Optics.37(6): 971–977.Bibcode:1998ApOpt..37..971H.doi:10.1364/AO.37.000971.PMID18268673.
- Hernández-Andrés, Javier; Javier Romero; Juan L. Nieves; Raymond L. Lee Jr (June 2001). "Color and spectral analysis of daylight in southern Europe".JOSA A.18(6): 1325–1335.Bibcode:2001JOSAA..18.1325H.CiteSeerX10.1.1.384.70.doi:10.1364/JOSAA.18.001325.PMID11393625.
- Thanh Hai Bui; Reiner Lenz; Tomas Landelius (2004).Group theoretical investigations of daylight spectra(PDF).CGIV (European Conference on Colour Graphics, Imaging and Vision). pp. 437–442.Retrieved2008-05-13.
- ^"CIE Standard Illuminants for Colorimetry".www.cie.co.at.CIE. 1999. Archived fromthe originalon 2017-12-04.Retrieved2018-12-17.
- ^abThe coefficients differ from those in the original paper due to the change in the constants inPlanck's law.SeeLindbloomfor the current version, andPlanckian locusfor details.
- ^Schanda, János (2007). "3. CIE Colorimetry". In Schanda, János (ed.).Colorimetry: understanding the CIE system.John Wiley & Sons. Appendix A, p. 74.
- ^Wyszecki, Gunter (1970). "Development of New CIE Sources for Colorimetry".Die Farbe.19:43–.
- ^CIE Technical Report (1999).A Method for Assessing the Quality of Daylight Simulators for Colorimetry.Paris: Bureau central de la CIE.ISBN978-92-9034-051-5.Archived fromthe originalon 2017-08-21.
A method is provided for evaluating the suitability of a test source as a simulator of CIE Standard Illuminants D55, D65, or D75. The Supplement, prepared in 1999, adds the CIE Illuminant D50 to the line of illuminants where the method can be applied to. For each of these standard illuminants, spectral radiance factor data are supplied for five pairs of nonfluorescent samples that are metameric matches. The colorimetric differences of the five pairs are computed for the test illuminant; the average of these differences is taken as the visible range metamerism index and is used as a measure of the quality of the test illuminant as a simulator for nonfluorescent samples. For fluorescent samples, the quality is further assessed in terms of an ultraviolet range metamerism index, defined as the average of the colorimetric differences computed with the test illuminant for three further pairs of samples, each pair consisting of a fluorescent and a nonfluorescent sample which are metameric under the standard illuminant.
- ^Lam, Yuk-Ming; Xin, John H. (August 2002). "Evaluation of the quality of different D65 simulators for visual assessment".Color Research & Application.27(4): 243–251.doi:10.1002/col.10061.
- ^"CIE Illuminant Technology - Yujileds".Yujileds - High CRI LED Leader.5 September 2023.
- ^Philips."Optical Testing for SuperFlux, SnapLED and LUXEON Emitters"(PDF).
CIE has defined the color coordinates of several different white Illuminants, but within Lumileds, CIE illuminant E is used for all color calculations
- ^For commercial examples of calcium halophosphate fluorescents, see for exampleUS 5447660Method for making a calcium halophosphate phosphor orUS 6666993Single component calcium halophosphate phosphor
- ^Spectral power distribution of Illuminants Series F(Excel), in5 nmincrements from380 nmto780 nm.
- ^Mitchell Charity."Blackbody color datafile".vendian.org.
- ^Danny Pascale."A Review of RGB color spaces"(PDF).Babel Color.
- ^Equivalent White Light Sources, and CIE Illuminants(PDF),archived fromthe originalon 2005-05-23,retrieved2017-12-11
- ^CIE F-series Spectral Data, CIE 15.2:1986,archived fromthe originalon 2011-07-25,retrieved2017-12-11
- ^Colorimetry, 4th Edition,vol. CIE 015:2018,doi:10.25039/TR.015.2018,ISBN978-3-902842-13-8
- ^47 CFR § 73.682 (20) (iv)
- ^"RECOMMENDATION ITU-R BT.470-6 - CONVENTIONAL TELEVISION SYSTEMS, p.16"(PDF).
External links
[edit]- Selected colorimetric tables in Excel,as published inCIE 15:2004
- Konica Minolta Sensing:Light sources & Illuminants
| CAM | |
|---|---|
| CIE | |
| RGB | |
| Y′UV | |
| Other | |
| Color systems and standards | |
For the vision capacities of organisms or machines, see | |
Colortopics | ||||||||||
|---|---|---|---|---|---|---|---|---|---|---|
| Color science |
|  | ||||||||
| Color philosophy |
| |||||||||
| Color terms |
| |||||||||
| Color organizations | ||||||||||
| Names |
| |||||||||
| Related | ||||||||||