
Contrast (vision)

Contrastis the difference inluminanceorcolorthat makes an object (or its representation in an image or display) visible against a background of different luminance or color. The humanvisual systemis more sensitive to contrast than to absolute luminance; thus, we can perceive the world similarly despite significant changes in illumination throughout the day or across different locations.[1]
The maximum contrast of an image is termed thecontrast ratioordynamic range.In images where the contrast ratio approaches the maximum possible for the medium, there is aconservation of contrast.In such cases, increasing contrast in certain parts of the image will necessarily result in a decrease in contrast elsewhere. Brightening an image increases contrast in darker areas but decreases it in brighter areas; conversely, darkening the image will have the opposite effect.Bleach bypassreduces contrast in the darkest and brightest parts of an image while enhancing luminance contrast in areas of intermediatebrightness.
Biological contrast sensitivity[edit]
Campbell and Robson (1968) showed that the humancontrast sensitivity functionshows a typicalband-pass filtershape peaking at around 4 cycles per degree (cpdorcyc/deg), with sensitivity dropping off either side of the peak.[2]This can be observed by changing one's viewing distance from a "sweepgrating"(shown below) showing many bars of asinusoidalgrating that go from high to low contrast along the bars, and go from narrow (high spatial frequency) to wide (low spatial frequency) bars across the width of the grating.

The high-frequency cut-off represents theopticallimitations of the visual system's ability toresolvedetail and is typically about 60 cpd. The high-frequency cut-off is also related to the packing density of theretinalphotoreceptor cells:a finer matrix can resolve finer gratings.
The low frequency drop-off is due tolateral inhibitionwithin theretinal ganglion cells.[3]A typical retinal ganglion cell'sreceptive fieldcomprises a central region in which light either excites or inhibits the cell, and a surround region in which light has the opposite effects.
One experimental phenomenon is the inhibition of blue in the periphery if blue light is displayed against white, leading to a yellow surrounding. The yellow is derived from the inhibition of blue on the surroundings by the center. Since white minus blue is red and green, this mixes to become yellow.[4]
For example,in the case of graphical computer displays,contrast depends on the properties of the picture source or file and the properties of the computer display, including its variable settings. For some screens the angle between the screen surface and the observer's line of sight is also important.
Quantifications[edit]


There are many possible definitions of contrast. Some include color; others do not. Russian scientistN. P. Travnikovalaments, "Such a multiplicity of notions of contrast is extremely inconvenient. It complicates the solution of many applied problems and makes it difficult to compare the results published by different authors."[5][6]
Various definitions of contrast are used in different situations. Here,luminancecontrast is used as an example, but the formulas can also be applied to other physical quantities. In many cases, the definitions of contrast represent a ratio of the type

The rationale behind this is that a small difference is negligible if the average luminance is high, while the same small difference matters if the average luminance is low (seeWeber–Fechner law). Below, some common definitions are given.
Weber contrast[edit]
Weber contrast is defined as[5]

withandrepresenting the luminance of the features and the background, respectively. The measure is also referred to asWeber fraction,since it is the term that is constant inWeber's Law.Weber contrast is commonly used in cases where small features are present on a large uniform background, i.e., where the average luminance is approximately equal to the background luminance.


Michelson contrast[edit]
Michelson contrast[7](also known as thevisibility) is commonly used for patterns where both bright and dark features are equivalent and take up similar fractions of the area (e.g.sine-wave gratings). The Michelson contrast is defined as[5]

withandrepresenting the highest and lowest luminance. The denominator represents twice the average of the maximum and minimum luminances.[8]


This form of contrast is an effective way to quantify contrast for periodic functionsf(x) and is also known as the modulationmfof a periodic signalf.Modulation quantifies the relative amount by which the amplitude (or difference) (fmax−fmin)/2 offstands out from the average value (or background) (fmax+fmin)/2. In general,mfrefers to the contrast of the periodic signalfrelative to its average value. Ifmf= 0, thenfhas no contrast. If two periodic functionsfandghave the same average value, thenfhas more contrast thangifmf>mg.[9]
RMS contrast[edit]
Root mean square(RMS) contrast does not depend on the spatial frequency content or the spatial distribution of contrast in the image. RMS contrast is defined as the standard deviation of thepixelintensities:[5]

where intensitiesare the-th-th element of the two-dimensional image of sizeby.is the average intensity of all pixel values in the image. The imageis assumed to have its pixel intensities normalized in the range.


![{\displaystyle [0,1]}](https://wikimedia.org/api/rest_v1/media/math/render/svg/738f7d23bb2d9642bab520020873cccbef49768d)
Contrast sensitivity[edit]
Contrast sensitivityis a measure of the ability to discern differentluminancesin a staticimage.It varies with age, increasing to a maximum around 20 years atspatial frequenciesof about 2–5 cpd; aging then progressively attenuates contrast sensitivity beyond this peak. Factors such as cataracts anddiabetic retinopathyalso reduce contrast sensitivity.[10]In the sweep grating figure below, at an ordinary viewing distance, the bars in the middle appear to be the longest due to their optimal spatial frequency. However, at a far viewing distance, the longest visible bars shift to what were originally the wide bars, now matching the spatial frequency of the middle bars at reading distance.

Contrast sensitivity and visual acuity[edit]
Visual acuityis a parameter that is frequently used to assess overall vision. However, diminished contrast sensitivity may cause decreased visual function in spite of normal visual acuity.[11]For example, some individuals withglaucomamay achieve 20/20 vision on acuity exams, yet struggle withactivities of daily living,such as driving at night.
As mentioned above, contrast sensitivity describes the ability of the visual system to distinguish bright and dim components of a static image. Visual acuity can be defined as the angle with which one can resolve two points as being separate since the image is shown with 100% contrast and is projected onto the fovea of the retina.[12]Thus, when anoptometristorophthalmologistassesses a patient's visual acuity using aSnellen chartor some otheracuity chart,the target image is displayed at high contrast, e.g., black letters of decreasing size on a white background. A subsequent contrast sensitivity exam may demonstrate difficulty with decreased contrast (using, e.g., the Pelli–Robson chart, which consists of uniform-sized but increasingly pale grey letters on a white background).
To assess a patient's contrast sensitivity, one of several diagnostic exams may be used. Most charts in an ophthalmologist's or optometrist's office will show images of varying contrast andspatial frequency.Parallel bars of varying width and contrast, known as sine-wave gratings, are sequentially viewed by the patient. The width of the bars and their distance apart represent spatial frequency, measured in cycles per degree.

Studies have demonstrated that contrast sensitivity is maximum for spatial frequencies of 2-5 cpd, falling off for lower spatial frequencies, and rapidly falling of for higher spatial frequencies. The upper limit for the human vision system is about 60 cpd. The correct identification of small letters requires the letter size be about 18-30 cpd.[13]Contrast thresholdcan be defined as the minimum contrast that can be resolved by the patient. Contrast sensitivity is typically expressed as thereciprocalof the threshold contrast for detection of a given pattern (i.e., 1 ÷ contrast threshold).[14]
Using the results of a contrast sensitivity exam, a contrast sensitivity curve can be plotted, with spatial frequency on the horizontal, and contrast threshold on the vertical axis. Also known as contrast sensitivity function (CSF), the plot demonstrates the normal range of contrast sensitivity, and will indicate diminished contrast sensitivity in patients who fall below the normal curve. Some graphs contain "contrast sensitivity acuity equivalents", with lower acuity values falling in the area under the curve. In patients with normal visual acuity and concomitant reduced contrast sensitivity, the area under the curve serves as a graphical representation of the visual deficit. It can be because of this impairment in contrast sensitivity that patients have difficulty driving at night, climbing stairs and other activities of daily living in which contrast is reduced.[15]
Recent studies have demonstrated that intermediate-frequency sinusoidal patterns are optimally-detected by the retina due to the center-surround arrangement of neuronal receptive fields.[16]In an intermediate spatial frequency, the peak (brighter bars) of the pattern is detected by the center of the receptive field, while the troughs (darker bars) are detected by the inhibitory periphery of the receptive field. For this reason, low- and high-spatial frequencies elicit excitatory and inhibitory impulses by overlapping frequency peaks and troughs in the center and periphery of the neuronalreceptive field.[17]Other environmental,[18]physiological, and anatomical factors influence the neuronal transmission of sinusoidal patterns, includingadaptation.[19]

Decreased contrast sensitivity arises from multiple etiologies, including retinal disorders such asage-related macular degeneration(ARMD),amblyopia,lens abnormalities, such ascataract,and by higher-order neural dysfunction, includingstrokeandAlzheimer's disease.[20]In light of the multitude of etiologies leading to decreased contrast sensitivity, contrast sensitivity tests are useful in the characterization and monitoring of dysfunction, and less helpful in detection of disease.
Contrast threshold[edit]
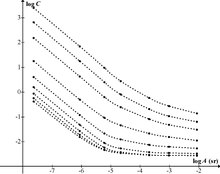
A large-scale study of luminance contrast thresholds was done in the 1940s by Blackwell,[21]using a forced-choice procedure. Discs of various sizes and luminances were presented in different positions against backgrounds at a wide range of adaptation luminances, and subjects had to indicate where they thought the disc was being shown. After statistical pooling of results (90,000 observations by seven observers), the threshold for a given target size and luminance was defined as the Weber contrast level at which there was a 50% detection level. The experiment employed a discrete set of contrast levels, resulting in discrete values of threshold contrast. Smooth curves were drawn through these, and values tabulated. The resulting data have been used extensively in areas such as lighting engineering and road safety.[23]
A separate study by Knoll et al[24]investigated thresholds for point sources by requiring subjects to vary the brightness of the source to find the level at which it was just visible. A mathematical formula for the resulting threshold curve was proposed byHecht,[25]with separate branches for scotopic and photopic vision. Hecht's formula was used by Weaver[26]to model the naked-eye visibility of stars. The same formula was used later bySchaefer[27]to model stellar visibility through a telescope.
Crumey[22]showed that Hecht's formula fitted the data very poorly at low light levels, so was not really suitable for modelling stellar visibility. Crumey instead constructed a more accurate and general model applicable to both the Blackwell and Knoll et al data. Crumey's model covers all light levels, from zero background luminance to daylight levels, and instead of parameter-tuning is based on an underlying linearity related toRicco's law.Crumey used it to model astronomical visibility for targets of arbitrary size, and to study the effects of light pollution.
Test images[edit]
Test images types[28]
- Pelli-Robson Contrast Sensitivity Chart
- Regan chart
- Arden grating chart
- Campbell-Robson Contrast Sensitivity Chart[29]
See also[edit]
References[edit]
- ^Rahimi-Nasrabadi, Hamed; Jin, Jianzhong; Mazade, Reece; Pons, Carmen; Najafian, Sohrab; Alonso, Jose-Manuel (2021-02-02)."Image luminance changes contrast sensitivity in visual cortex".Cell Reports.34(5): 108692.doi:10.1016/j.celrep.2021.108692.PMC7886026.PMID33535047.
- ^Campbell, F. W.; Robson, J. G. (1968)."Application of Fourier analysis to the visibility of gratings".Journal of Physiology.197(3): 551–566.doi:10.1113/jphysiol.1968.sp008574.PMC1351748.PMID5666169.
- ^Nelson, Ralph (1995), Kolb, Helga; Fernandez, Eduardo; Nelson, Ralph (eds.),"Visual Responses of Ganglion Cells",Webvision: The Organization of the Retina and Visual System,Salt Lake City (UT): University of Utah Health Sciences Center,PMID21413404,retrieved2024-04-17
- ^"eye, human." Encyclopædia Britannica. 2008.Encyclopædia Britannica 2006 Ultimate Reference Suite DVD
- ^abcdE. Peli (Oct 1990)."Contrast in Complex Images"(PDF).Journal of the Optical Society of America A.7(10): 2032–2040.Bibcode:1990JOSAA...7.2032P.doi:10.1364/JOSAA.7.002032.PMID2231113.S2CID1434077.Archived fromthe original(PDF)on 2016-05-21.Retrieved2009-02-16.
- ^N. P. Travnikova (1984).Efficiency of Visual Search.p.4. Mashinostroyeniye. Moscow, USSR, DTIC Report AD-B157 308
- ^Michelson, A. (1927).Studies in Optics.U. of Chicago Press.
- ^Ph.D., Lawrence Arend."Luminance Contrast".colorusage.arc.nasa.gov.Retrieved5 April2018.
- ^Prince, Jerry L., Links, Jonathan M.Medical Imaging Signals and Systems,(2006). pg 65 Ch 3 Image Quality, 3.2 Contrast, 3.2.1 Modulation.
- ^Peter Wenderoth."The Contrast Sensitivity Function".Archived fromthe originalon 2008-07-20.Retrieved2008-10-06.
- ^Hashemi, H; Khabazkhoob, M; Jafarzadehpur, E; Emamian, MH; Shariati, M; Fotouhi, A (Mar 2012). "Contrast sensitivity evaluation in a population-based study in Shahroud, Iran".Ophthalmology.119(3): 541–6.doi:10.1016/j.ophtha.2011.08.030.PMID22153705.
- ^Sadun, A. A. Optics lecture on 03/06/2013. University of Southern California.
- ^National Research Council (US) Committee on Vision. Emergent Techniques for Assessment of Visual Performance. Washington (DC): National Academies Press (US); 1985. CONTRAST SENSITIVITY FUNCTION. Available from:https://www.ncbi.nlm.nih.gov/books/NBK219042/
- ^O'Carroll, David C.; Wiederman, Steven D. (2014-02-19)."Contrast sensitivity and the detection of moving patterns and features".Philosophical Transactions of the Royal Society B: Biological Sciences.369(1636): 20130043.doi:10.1098/rstb.2013.0043.ISSN0962-8436.PMC3886331.PMID24395970.
- ^Sia DI, Martin S, Wittert G, Casson RJ. "Age-related change in contrast sensitivity among Australian male adults: Florey Adult Male Ageing Study". Acta Ophthalmol. 2012 Mar 16.
- ^Wandell, B.A. Foundations of Vision. Chapter 5: The Retinal Representation. 1995. Sinauer Associates, Inc. Accessed athttps://foundationsofvision.stanford.edu/chapter-5-the-retinal-representation/#centersurroundon 03/05/2019.
- ^Tsui JM, Pack CC. "Contrast sensitivity of MT receptive field centers and surrounds." J Neurophysiol. 2011 Oct;106(4):1888-900.
- ^Jarvis, JR; Wathes, CM (May 2012)."Mechanistic modeling of vertebrate spatial contrast sensitivity and acuity at low luminance".Vis Neurosci.29(3): 169–81.doi:10.1017/s0952523812000120.PMID22569345.S2CID11602776.
- ^Cravo AM, Rohenkohl G, Wyart V, Nobre AC. "Temporal expectation enhances contrast sensitivity by phase entrainment of low-frequency oscillations in visual cortex." J Neurosci. 2013 Feb 27;33(9):4002-10.
- ^Risacher SL, Wudunn D, Pepin SM, MaGee TR, McDonald BC, Flashman LA, Wishart HA, Pixley HS, Rabin LA, Paré N, Englert JJ, Schwartz E, Curtain JR, West JD, O'Neill DP, Santulli RB, Newman RW, Saykin AJ. "Visual contrast sensitivity in Alzheimer's disease, mild cognitive impairment, and older adults with cognitive complaints." Neurobiol Aging. 2013 Apr;34(4):1133-44.
- ^abBLACKWELL HR (1946)."Blackwell, H.R., JOSA 36, p624 (1946)".Journal of the Optical Society of America.36(11): 624–643.doi:10.1364/JOSA.36.000624.PMID20274431.
- ^abCrumey, A., MNRAS 442, 2600–2619 (2014)
- ^Narisada, K., Schreuder, D. Light Pollution Handbook. Springer 2004.
- ^Knoll, H.A., Tousey, R., Hulburt, E.O., JOSA, 36, p480 (1946)
- ^Hecht, S., JOSA, 37, p59 (1947)
- ^Weaver, H.F., PASP, 59, p232 (1947)
- ^Schaefer, B.E., PASP, 102, p212
- ^Contrast Sensitivity by Kirandeep Kaur; Bharat Gurnani on National Library of Medicine. Last Update: June 11, 2023.
- ^Tardif, Jessica; Watson, Marcus R.; Giaschi, Deborah; Gosselin, Frédéric (2021-03-09)."The Curve Visible on the Campbell-Robson Chart Is Not the Contrast Sensitivity Function".Frontiers in Neuroscience.15.Frontiers Media SA.doi:10.3389/fnins.2021.626466.ISSN1662-453X.PMC7985182.PMID33767608.