
Del Rio, California
Del Rio | |
|---|---|
 Location inStanislaus Countyand the state ofCalifornia | |
 Del Rio  Del Rio | |
| Coordinates:37°44′47″N121°0′42″W/ 37.74639°N 121.01167°W | |
| Country | |
| State | |
| County | Stanislaus |
| Area | |
| • Total | 2.05 sq mi (5.31 km2) |
| • Land | 2.00 sq mi (5.17 km2) |
| • Water | 0.05 sq mi (0.14 km2) 12.17% |
| Elevation | 128 ft (39 m) |
| Population (2020) | |
| • Total | 1,399 |
| • Density | 700.55/sq mi (270.42/km2) |
| Time zone | UTC-8(Pacific (PST)) |
| • Summer (DST) | UTC-7(PDT) |
| ZIP code | 95367 |
| Area code | 209 |
| FIPS code | 06-18695 |
| GNISfeature ID | 1853384 |
Del Rio(Spanish:Del Río,meaning "Of The River" ) is acensus-designated place(CDP) inStanislaus County,California,United States that is located around theDel Rio Country Club.The population was 1,270 at the 2010 census, up from 1,168 at the 2000 census. It is part of theModestoMetropolitan Statistical Area.
Geography[edit]
Del Rio is located at37°44′47″N121°0′42″W/ 37.74639°N 121.01167°W(37.746449, -121.011604).[2]
According to theUnited States Census Bureau,the CDP has a total area of 2.1 square miles (5.4 km2), of which, 1.8 square miles (4.7 km2) of it is land and 0.3 square miles (0.78 km2) of it (12.17%) is water.
Demographics[edit]
| Census | Pop. | Note | %± |
|---|---|---|---|
| 2020 | 1,399 | — | |
| U.S. Decennial Census[3] | |||
2010[edit]
The2010 United States Census[4]reported that Del Rio had a population of 1,270. The population density was 611.8 inhabitants per square mile (236.2/km2). The racial makeup of Del Rio was 1,027 (80.9%)White,25 (2.0%)African American,5 (0.4%)Native American,143 (11.3%)Asian,1 (0.1%)Pacific Islander,27 (2.1%) fromother races,and 42 (3.3%) from two or more races.HispanicorLatinoof any race were 107 persons (8.4%).
The Census reported that 1,270 people (100% of the population) lived in households, 0 (0%) lived in non-institutionalized group quarters, and 0 (0%) were institutionalized.
There were 485 households, out of which 144 (29.7%) had children under the age of 18 living in them, 359 (74.0%) wereopposite-sex married couplesliving together, 27 (5.6%) had a female householder with no husband present, 12 (2.5%) had a male householder with no wife present. There were 14 (2.9%)unmarried opposite-sex partnerships,and 1 (0.2%)same-sex married couples or partnerships.72 households (14.8%) were made up of individuals, and 40 (8.2%) had someone living alone who was 65 years of age or older. The average household size was 2.62. There were 398families(82.1% of all households); the average family size was 2.89.
The population was spread out, with 254 people (20.0%) under the age of 18, 72 people (5.7%) aged 18 to 24, 175 people (13.8%) aged 25 to 44, 523 people (41.2%) aged 45 to 64, and 246 people (19.4%) who were 65 years of age or older. The median age was 50.6 years. For every 100 females, there were 96.3 males. For every 100 females age 18 and over, there were 94.3 males.
There were 515 housing units at an average density of 248.1 per square mile (95.8/km2), of which 454 (93.6%) were owner-occupied, and 31 (6.4%) were occupied by renters. The homeowner vacancy rate was 3.0%; the rental vacancy rate was 5.9%. 1,187 people (93.5% of the population) lived in owner-occupied housing units and 83 people (6.5%) lived in rental housing units.
2000[edit]
As of thecensus[5]of 2000, there were 1,168 people, 407 households, and 361 families residing in the CDP. The population density was 800.5 inhabitants per square mile (309.1/km2). There were 419 housing units at an average density of 287.2 per square mile (110.9/km2). The racial makeup of the CDP was 85.27%White,1.63%African American,0.51%Native American,8.13%Asian,2.14% fromother races,and 2.31% from two or more races.HispanicorLatinoof any race were 6.25% of the population.
There were 407 households, out of which 35.9% had children under the age of 18 living with them, 80.8% weremarried couplesliving together, 5.2% had a female householder with no husband present, and 11.3% were non-families. 9.6% of all households were made up of individuals, and 6.4% had someone living alone who was 65 years of age or older. The average household size was 2.87 and the average family size was 3.04.
In the CDP, the population was spread out, with 26.1% under the age of 18, 4.9% from 18 to 24, 19.2% from 25 to 44, 33.8% from 45 to 64, and 16.0% who were 65 years of age or older. The median age was 45 years. For every 100 females, there were 95.3 males. For every 100 females age 18 and over, there were 92.6 males.
The median income for a household in the CDP was $108,285, and the median income for a family was $134,354. Males had a median income of $0 versus $31,100 for females. Theper capita incomefor the CDP was $60,837. About 2.7% of families and 3.0% of the population were below thepoverty line,including 5.8% of those under age 18 and none of those age 65 or over.
Planning functions[edit]
Del Rio has been subject to a number of planning activities, beginning with the 1992 analysis byStanislaus Countyregarding the projected growth impacts of this area.[6]This plan, an integral part of the countyGeneral Plan,emphasized a continuation of the low density development of the Del Rio area, with balanced uses based upon the historic residential,agriculturalandopen spaceprecedent land uses. The plan included prioritization of high quality residential development and theundergroundingof all utility infrastructure.
In regard to environmental factors the 1992 plan called for extensive protection ofriparian zonesalong theStanislaus River.The plan also analyzedair qualityimpacts of future land development and transportation change; these studies were carried out in a companion document prepared by Earthmetrics, and these analyses were used to size the future roadway system and intersection controls.[7]
Government[edit]
In theCalifornia State Legislature,Del Rio is inthe 5th Senate District,represented byDemocratSusan Eggman,andthe 12th Assembly District,represented byDemocratDamon Connolly.[8]
In theUnited States House of Representatives,Del Rio is inCalifornia's 10th congressional district,represented byDemocratMark DeSaulnier.[9]
Notable people[edit]
- None
References[edit]
- ^"2020 U.S. Gazetteer Files".United States Census Bureau.RetrievedOctober 30,2021.
- ^"US Gazetteer files: 2010, 2000, and 1990".United States Census Bureau.February 12, 2011.RetrievedApril 23,2011.
- ^"Census of Population and Housing".Census.gov.RetrievedJune 4,2016.
- ^"2010 Census Interactive Population Search: CA - Del Rio CDP".U.S. Census Bureau. Archived fromthe originalon July 15, 2014.RetrievedJuly 12,2014.
- ^"U.S. Census website".United States Census Bureau.RetrievedJanuary 31,2008.
- ^"Stanislaus County Del Rio Community Plan, prepared by Stanislaus County Planning and Community Development Department (August, 1992)"(PDF).Archived fromthe original(PDF)on September 29, 2007.RetrievedJune 29,2007.
- ^Environmental Impact Report for the Stanislaus County Del Rio Community Plan,Published by the County of Stanislaus and prepared by Earthmetrics Inc., San Mateo, Calif. (1989)
- ^"Statewide Database".Regents of the University of California.RetrievedMarch 27,2015.
- ^"California's 10th Congressional District - Representatives & District Map".Civic Impulse, LLC.RetrievedSeptember 28,2014.
Municipalities and communities ofStanislaus County, California,United States | ||
|---|---|---|
| Cities | 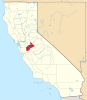 | |
| CDPs | ||
| Unincorporated communities | ||
| Ghost towns | ||