Gaizhou
Appearance
Gaizhou
Cái châu thị | |
|---|---|
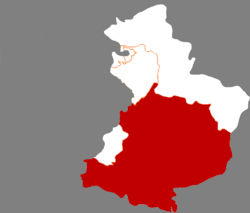
 Location in Yingkou | |
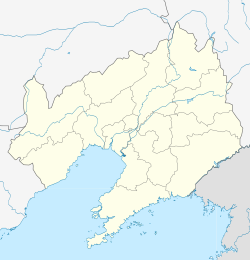
| Coordinates:40°24′N122°21′E/ 40.400°N 122.350°E | |
| Country | People's Republic of China |
| Province | Liaoning |
| Prefecture-level city | Yingkou |
| Area | |
| •County-level city | 2,930.0 km2(1,131.3 sq mi) |
| • Urban | 150.00 km2(57.92 sq mi) |
| Elevation | 9.1 m (30 ft) |
| Population (2017)[1] | |
| •County-level city | 704,000 |
| • Density | 240/km2(620/sq mi) |
| •Urban | 231,100 |
| Time zone | UTC+8(China Standard) |
| Gaizhou | |||||||||
|---|---|---|---|---|---|---|---|---|---|
| Traditional Chinese | Cái châu | ||||||||
| Simplified Chinese | Cái châu | ||||||||
| Postal | Kaichow Kaihsien(1965–1992) Kaiping(until 1965) | ||||||||
| |||||||||
| Gaixian | |||||||||
|---|---|---|---|---|---|---|---|---|---|
| Traditional Chinese | Cái huyện | ||||||||
| Simplified Chinese | Cái huyện | ||||||||
| Postal | Kaihsien | ||||||||
| |||||||||
| Gaiping | |||||||||
|---|---|---|---|---|---|---|---|---|---|
| Traditional Chinese | Cái bình | ||||||||
| Simplified Chinese | Cái bình | ||||||||
| Postal | Kaiping | ||||||||
| |||||||||
Gaizhou(simplified Chinese:Cái châu;traditional Chinese:Cái châu;pinyin:Gàizhōu), formerlyGaixian,Gaiping,andKaiping,is acounty-level cityinLiaoningprovince, China. It is under the administration ofYingkouCity, which lies 31 km (19 mi) to the north-northwest, and is located at the northwest end of theLiaodong Peninsulanear the northeast coast of theBohai Sea.
Administrative divisions
[edit]There are sixsubdistricts,18towns,and threetownshipsunder the city's administration.[2]
Subdistricts:
- Gulou Subdistrict(Cổ lâu nhai đạo),Xicheng Subdistrict(Tây thành nhai đạo),Dongcheng Subdistrict(Đông thành nhai đạo),Taiyangsheng Subdistrict(Thái dương thăng nhai đạo),Tuanshan Subdistrict(Đoàn sơn nhai đạo),Xihai Subdistrict(Tây hải nhai đạo)
Towns:
- Gaotun(Cao truân trấn),Shagang(Sa cương trấn),Jiulongdi(Cửu lũng địa trấn),Jiuzhai(Cửu trại trấn),Wanfu(Vạn phúc trấn),Wolongquan(Ngọa long tuyền trấn),Qingshiling(Thanh thạch lĩnh trấn),Nuanquan(Noãn tuyền trấn),Guizhou(Quy châu trấn),Bangshibu(Bảng thức bảo trấn),Tuandian(Đoàn điện trấn),Shuangtai(Song đài trấn),Yangyun(Dương vận trấn),Xutun(Từ truân trấn),Shizijie(Thập tự nhai trấn),Kuangdonggou(Quáng động câu trấn),Chentun(Trần truân trấn),Liangtun(Lương truân trấn),
Townships:
- Xiaoshipeng Township(Tiểu thạch bằng hương),Guoyuan Township(Quả viên hương),Ertai Township(Nhị đài hương)
Climate
[edit]| Climate data for Gaizhou (1991–2020 normals, extremes 1981–2010) | |||||||||||||
|---|---|---|---|---|---|---|---|---|---|---|---|---|---|
| Month | Jan | Feb | Mar | Apr | May | Jun | Jul | Aug | Sep | Oct | Nov | Dec | Year |
| Record high °C (°F) | 9.9 (49.8) |
19.0 (66.2) |
22.7 (72.9) |
29.8 (85.6) |
34.7 (94.5) |
36.6 (97.9) |
36.8 (98.2) |
36.1 (97.0) |
33.3 (91.9) |
27.7 (81.9) |
21.5 (70.7) |
16.2 (61.2) |
36.8 (98.2) |
| Mean daily maximum °C (°F) | −2.5 (27.5) |
1.6 (34.9) |
8.5 (47.3) |
17.0 (62.6) |
23.5 (74.3) |
27.3 (81.1) |
29.6 (85.3) |
29.1 (84.4) |
24.9 (76.8) |
17.4 (63.3) |
7.9 (46.2) |
0.3 (32.5) |
15.4 (59.7) |
| Daily mean °C (°F) | −7.8 (18.0) |
−3.6 (25.5) |
3.3 (37.9) |
11.7 (53.1) |
18.3 (64.9) |
22.7 (72.9) |
25.5 (77.9) |
24.8 (76.6) |
19.5 (67.1) |
11.7 (53.1) |
2.7 (36.9) |
−4.9 (23.2) |
10.3 (50.6) |
| Mean daily minimum °C (°F) | −12.2 (10.0) |
−8.2 (17.2) |
−1.4 (29.5) |
6.5 (43.7) |
13.0 (55.4) |
18.1 (64.6) |
21.8 (71.2) |
20.8 (69.4) |
14.5 (58.1) |
6.7 (44.1) |
−1.9 (28.6) |
−9.2 (15.4) |
5.7 (42.3) |
| Record low °C (°F) | −28.2 (−18.8) |
−22.0 (−7.6) |
−13.3 (8.1) |
−7.1 (19.2) |
2.5 (36.5) |
8.1 (46.6) |
14.9 (58.8) |
9.5 (49.1) |
2.9 (37.2) |
−6.4 (20.5) |
−16.5 (2.3) |
−23.2 (−9.8) |
−28.2 (−18.8) |
| Averageprecipitationmm (inches) | 3.8 (0.15) |
7.3 (0.29) |
11.4 (0.45) |
33.3 (1.31) |
54.9 (2.16) |
72.3 (2.85) |
141.2 (5.56) |
165.2 (6.50) |
50.4 (1.98) |
35.5 (1.40) |
20.6 (0.81) |
8.9 (0.35) |
604.8 (23.81) |
| Average precipitation days(≥ 0.1 mm) | 2.6 | 2.8 | 3.7 | 6.0 | 7.5 | 9.0 | 11.1 | 10.0 | 6.4 | 6.3 | 4.9 | 3.5 | 73.8 |
| Average snowy days | 4.0 | 3.5 | 2.8 | 0.6 | 0 | 0 | 0 | 0 | 0 | 0.2 | 3.1 | 4.2 | 18.4 |
| Averagerelative humidity(%) | 57 | 53 | 50 | 49 | 54 | 65 | 75 | 77 | 69 | 63 | 60 | 59 | 61 |
| Mean monthlysunshine hours | 189.0 | 190.6 | 229.9 | 236.1 | 266.4 | 230.2 | 202.8 | 212.6 | 228.1 | 212.6 | 171.4 | 170.8 | 2,540.5 |
| Percentpossible sunshine | 63 | 63 | 62 | 59 | 60 | 51 | 45 | 51 | 62 | 62 | 58 | 59 | 58 |
| Source:China Meteorological Administration[3][4] | |||||||||||||
References
[edit]- ^abMinistry of Housing and Urban-Rural Development,ed. (2019).China Urban Construction Statistical Yearbook 2017.Beijing: China Statistics Press. p. 50. Archived fromthe originalon 18 June 2019.Retrieved11 January2020.
- ^Doanh khẩu thị - hành chính khu hoa võng
- ^Trung quốc khí tượng sổ cư võng – WeatherBk Data(in Simplified Chinese).China Meteorological Administration.Retrieved29 July2023.
- ^ Trung quốc khí tượng sổ cư võng(in Simplified Chinese).China Meteorological Administration.Retrieved29 July2023.
External links
[edit]40°24′N122°21′E/ 40.400°N 122.350°E

