
Groveland, California
Groveland | |
|---|---|
 Groveland California in 2012 | |
 Location of Groveland in Tuolumne County, California. | |
 Groveland Position in California. | |
| Coordinates:37°49′54″N120°14′23″W/ 37.83167°N 120.23972°W | |
| Country | |
| State | |
| County | Tuolumne |
| Area | |
| • Total | 9.567 sq mi (24.779 km2) |
| • Land | 9.561 sq mi (24.764 km2) |
| • Water | 0.006 sq mi (0.015 km2) 0.06% |
| Elevation | 3,136 ft (956 m) |
| Population (2020) | |
| • Total | 540 |
| • Density | 56/sq mi (22/km2) |
| Time zone | UTC-8(Pacific (PST)) |
| • Summer (DST) | UTC-7(PDT) |
| ZIP Code | 95321 |
| Area code | 209 |
| GNISfeature ID | 2628856 |
| U.S. Geological Survey Geographic Names Information System: Groveland, California | |
| Reference no. | 446 |
Grovelandis acensus-designated place(CDP) inTuolumne County,California.[2]Groveland sits at an elevation of 3,136 feet (956 m).[2]The 2020 United States census reported Groveland's population was 540.[3]
Groveland was created as a CDP prior to the 2010 census; previously it was part ofGroveland-Big Oak FlatCDP.
History[edit]
Groveland has always been an important stop on the highway toYosemitebut really grew in the early 1900s with the development of theTuolumne RiverHetch-Hetchy water project for the city ofSan Francisco.Groveland is adjacent to theStanislaus National Forestand is known for the historicIron Door Saloon.
Groveland was originally a gold rush town and then became a sleepy farming community until the San Francisco Hetch Hetchy water project made it their headquarters and built a railroad yard and hospital for the work crews (both now gone). From 1915 till 1935, Groveland was a boom town supporting seven hotels, 10,000 residents and much activity. When the work crews left, the town again became a minor stop on the way to Yosemite until theBoise Cascadecompany built thePine Mountain Lakecommunity with a first class golf course, an airport and lake and staked out 5,000 lots. This development has since grown from a summer home area to a retirement community to a thriving neighborhood with year-round families, boosting the once sleepy Groveland to a travel and vacation destination in its own right.
Groveland is the main town on theHighway 120route to Yosemite National Park, and boasts numerous lodging and restaurant businesses.
Tioga High School and Tenaya Elementary School are located in Groveland.
Geography[edit]
According to theUnited States Census Bureau,the CDP covers an area of 9.6 square miles (24.8 km2), 99.94% of it land and 0.06% of it water.
Climate[edit]
This region experiences warm to very hot and dry summers, with the hottest month having an average temperature of 73.7 °F. According to theKöppen Climate Classificationsystem, Groveland has ahot-summer Mediterranean climate,abbreviated "Csa."
| Climate data for Groveland, California, 1991–2020 normals, extremes 2000–present | |||||||||||||
|---|---|---|---|---|---|---|---|---|---|---|---|---|---|
| Month | Jan | Feb | Mar | Apr | May | Jun | Jul | Aug | Sep | Oct | Nov | Dec | Year |
| Record high °F (°C) | 72 (22) |
76 (24) |
83 (28) |
87 (31) |
97 (36) |
104 (40) |
107 (42) |
105 (41) |
108 (42) |
95 (35) |
87 (31) |
75 (24) |
108 (42) |
| Mean maximum °F (°C) | 66.6 (19.2) |
69.8 (21.0) |
74.5 (23.6) |
81.7 (27.6) |
88.5 (31.4) |
98.6 (37.0) |
101.1 (38.4) |
99.7 (37.6) |
96.9 (36.1) |
86.5 (30.3) |
77.0 (25.0) |
64.9 (18.3) |
102.1 (38.9) |
| Mean daily maximum °F (°C) | 53.4 (11.9) |
55.3 (12.9) |
60.1 (15.6) |
64.8 (18.2) |
73.2 (22.9) |
83.2 (28.4) |
91.2 (32.9) |
90.7 (32.6) |
84.7 (29.3) |
73.5 (23.1) |
60.1 (15.6) |
52.0 (11.1) |
70.2 (21.2) |
| Daily mean °F (°C) | 42.2 (5.7) |
43.5 (6.4) |
47.5 (8.6) |
51.4 (10.8) |
58.6 (14.8) |
67.0 (19.4) |
73.7 (23.2) |
72.8 (22.7) |
67.3 (19.6) |
57.7 (14.3) |
47.6 (8.7) |
41.4 (5.2) |
55.9 (13.3) |
| Mean daily minimum °F (°C) | 31.0 (−0.6) |
31.7 (−0.2) |
34.8 (1.6) |
38.1 (3.4) |
44.0 (6.7) |
50.9 (10.5) |
56.3 (13.5) |
54.9 (12.7) |
49.9 (9.9) |
41.8 (5.4) |
35.1 (1.7) |
30.7 (−0.7) |
41.6 (5.3) |
| Mean minimum °F (°C) | 20.9 (−6.2) |
21.9 (−5.6) |
24.7 (−4.1) |
28.4 (−2.0) |
33.7 (0.9) |
39.0 (3.9) |
47.9 (8.8) |
47.1 (8.4) |
38.3 (3.5) |
31.4 (−0.3) |
25.5 (−3.6) |
19.1 (−7.2) |
17.3 (−8.2) |
| Record low °F (°C) | −2 (−19) |
8 (−13) |
12 (−11) |
23 (−5) |
23 (−5) |
33 (1) |
37 (3) |
40 (4) |
32 (0) |
26 (−3) |
19 (−7) |
7 (−14) |
−2 (−19) |
| Averageprecipitationinches (mm) | 7.20 (183) |
6.93 (176) |
6.29 (160) |
2.98 (76) |
2.24 (57) |
0.39 (9.9) |
0.00 (0.00) |
0.09 (2.3) |
0.30 (7.6) |
2.13 (54) |
3.50 (89) |
6.61 (168) |
38.66 (982.8) |
| Average snowfall inches (cm) | 1.3 (3.3) |
2.3 (5.8) |
2.6 (6.6) |
0.8 (2.0) |
0.0 (0.0) |
0.0 (0.0) |
0.0 (0.0) |
0.0 (0.0) |
0.0 (0.0) |
0.0 (0.0) |
0.7 (1.8) |
1.7 (4.3) |
9.4 (23.8) |
| Average precipitation days(≥ 0.01 in) | 9.9 | 8.5 | 10.5 | 7.2 | 4.1 | 0.9 | 0.3 | 0.6 | 1.6 | 3.9 | 8.0 | 10.1 | 65.6 |
| Average snowy days(≥ 0.1 in) | 0.3 | 0.5 | 0.5 | 0.3 | 0.0 | 0.0 | 0.0 | 0.0 | 0.0 | 0.0 | 0.4 | 0.2 | 2.2 |
| Source 1: NOAA[4] | |||||||||||||
| Source 2: National Weather Service (mean maxima/minima 2006–2020)[5] | |||||||||||||
Demographics[edit]
| Census | Pop. | Note | %± |
|---|---|---|---|
| U.S. Decennial Census[6] | |||
The2010 United States Census[7]reported that Groveland had a population of 601. The population density was 62.8 inhabitants per square mile (24.2/km2). The racial makeup of Groveland was 542 (90.2%)White,2 (0.3%)African American,9 (1.5%)Native American,9 (1.5%)Asian,2 (0.3%)Pacific Islander,17 (2.8%) fromother races,and 20 (3.3%) from two or more races.HispanicorLatinoof any race were 49 persons (8.2%).
The Census reported that 601 people (100% of the population) lived in households, 0 (0%) lived in non-institutionalized group quarters, and 0 (0%) were institutionalized.
There were 277 households, out of which 57 (20.6%) had children under the age of 18 living in them, 119 (43.0%) wereopposite-sex married couplesliving together, 32 (11.6%) had a female householder with no husband present, 15 (5.4%) had a male householder with no wife present. There were 21 (7.6%)unmarried opposite-sex partnerships,and 2 (0.7%)same-sex married couples or partnerships.90 households (32.5%) were made up of individuals, and 41 (14.8%) had someone living alone who was 65 years of age or older. The average household size was 2.17. There were 166families(59.9% of all households); the average family size was 2.64.
The population was spread out, with 92 people (15.3%) under the age of 18, 42 people (7.0%) aged 18 to 24, 114 people (19.0%) aged 25 to 44, 239 people (39.8%) aged 45 to 64, and 114 people (19.0%) who were 65 years of age or older. The median age was 49.6 years. For every 100 females, there were 104.4 males. For every 100 females age 18 and over, there were 106.1 males.
There were 353 housing units at an average density of 36.9 per square mile (14.2/km2), of which 182 (65.7%) were owner-occupied, and 95 (34.3%) were occupied by renters. The homeowner vacancy rate was 2.2%; the rental vacancy rate was 10.4%. 373 people (62.1% of the population) lived in owner-occupied housing units and 228 people (37.9%) lived in rental housing units.
Features[edit]
Camp Mather of the City of San Francisco, San Jose Family Camp of the City of San Jose, Berkeley Tuolumne Family Camp of the City of Berkeley, andCamp Tawonga,aJewish summer camp,are all located east of Groveland off Hwy 120 within theStanislaus National Forest.[8]
References[edit]
- ^U.S. CensusArchived2012-01-25 at theWayback Machine
- ^abcU.S. Geological Survey Geographic Names Information System: Groveland, California
- ^Bureau, US Census."Search Results".The United States Census Bureau.RetrievedNovember 11,2021.
- ^ "U.S. Climate Normals Quick Access – Station: Groveland 2, CA".National Oceanic and Atmospheric Administration.RetrievedApril 13,2023.
- ^ "NOAA Online Weather Data – NWS Sacramento".National Weather Service.RetrievedApril 13,2023.
- ^"Census of Population and Housing".Census.gov.RetrievedJune 4,2016.
- ^"2010 Census Interactive Population Search: CA - Groveland CDP".U.S. Census Bureau. Archived fromthe originalon July 15, 2014.RetrievedJuly 12,2014.
- ^Thanawala, Sudhin (July 5, 2013)."Teen injured at Calif. camp heard crack, screaming".Associated Press.RetrievedNovember 8,2013.
External links[edit]
Municipalities and communities ofTuolumne County, California,United States | ||
|---|---|---|
| City | 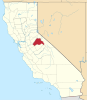 | |
| CDPs | ||
| Unincorporated communities | ||
| Ghost towns | ||
| International | |
|---|---|
| National | |
| Other | |