Mach bands


Mach bandsis anoptical illusionnamed after the physicistErnst Mach.It exaggerates thecontrastbetween edges of the slightly differing shades of gray, as soon as they contact one another, by triggering edge-detection in the human visual system.
Explanation[edit]
The Mach bands effect is due to thespatial high-boost filteringperformed by the human visual system on theluminancechannel of the image captured by theretina.Mach reported the effect in 1865, conjecturing that filtering is performed in the retina itself, bylateral inhibitionamong its neurons.[1]This conjecture is supported by observations on other (non-visual) senses, as pointed out by von Békésy.[2]The visual pattern is often found on curved surfaces subject to a particular, naturally-occurring illumination, so the occurrence of filtering can be explained as the result of learnt image statistics. The effect of filtering can be modeled as aconvolutionbetween a trapezoidal function that describes the illumination and one or morebandpass filters.A tight approximation is obtained by a model employing 9even-symmetricfilters scaled at octave intervals.[3]
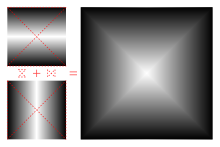
The effect is independent of the orientation of the boundary.
In radiology[edit]

This visual phenomenon is important to keep in mind when evaluatingdental radiographsfor evidence of decay, in whichgrayscaleimages of teeth and bone are analyzed for abnormal variances of density. Afalse-positiveradiological diagnosis ofdental cariescan easily arise if the practitioner does not take into account the likelihood of this illusion. Mach bands manifest adjacent to metal restorations or appliances[citation needed]and the boundary betweenenamelanddentin.[5]Mach bands may also result in the misdiagnosis of horizontal root fractures because of the differing radiographic intensities of tooth and bone.[6]
Mach effect can also lead to an erroneous diagnosis ofpneumothoraxby creating a dark line at the lung periphery (whereas a true pneumothorax will have a white pleural line).[7]
In computer graphics[edit]

- Actual luminance profile
- Perceived luminance profile
- Smooth luminance profile for comparison
Mach bands can also appear when there is a discontinuity in the derivative of a gradient, a visual effect common when intensities are linearly interpolated such as inGouraud shading.
Computer image processing systems use edge-detection in a way analogous to the brain, usingunsharp maskingto clarify edges in photos for example.
See also[edit]
- Acutance
- Cornsweet illusion
- Hermann grid illusion
- Lateral inhibition
- Optical illusions
- Watercolour illusion
- Gibbs phenomenon
References[edit]
- ^Ratliff, Floyd (1965).Mach bands: quantitative studies on neural networks in the retina.Holden-Day.ISBN9780816270453.
- ^von Békésy, Georg (1967-01-01)."Mach Band Type Lateral Inhibition in Different Sense Organs".The Journal of General Physiology.50(3): 519–532.doi:10.1085/jgp.50.3.519.ISSN1540-7748.PMC2225686.PMID11526844.
- ^Frederick A. A. Kingdom (4 November 2014)."Mach bands explained by response normalization".Frontiers in Human Neuroscience.8:843.doi:10.3389/fnhum.2014.00843.ISSN1662-5161.PMC4219435.PMID25408643.
- ^Ambalathankandy, Prasoon; Ou, Yafei; Kochiyil, Jyotsna; Takamaeda, Shinya; Motomura, Masato; Asai, Tetsuya; Ikebe, Masayuki (December 2019)."Radiography Contrast Enhancement: Smoothed LHE Filter a Practical Solution for Digital X-Rays with Mach Band".2019 Digital Image Computing: Techniques and Applications (DICTA) (Report). IEEE. pp. 1–8.doi:10.1109/DICTA47822.2019.8946114.ISBN978-1-7281-3857-2.
- ^Devlin, Hugh (2006).Operative dentistry: a practical guide to recent innovations; with... 5 tables.Berlin Heidelberg: Springer. p. 11.ISBN978-3-540-29616-4.
- ^Nielsen, C (November 2001)."Effect of Scenario and Experience on Interpretation of Mach Bands".Journal of Endodontics.27(11): 687–691.doi:10.1097/00004770-200111000-00009.PMID11716082.
- ^Parker, M. S.; Chasen, M. H.; Paul, N. (2009). "Radiologic Signs in Thoracic Imaging: Case-Based Review and Self-Assessment Module".American Journal of Roentgenology.192(3_Supplement): S34-48.doi:10.2214/AJR.07.7081.PMID19234288.S2CID34785665.
Further reading[edit]
- Lotto RB, Williams SM, Purves D (1999)."Mach bands as empirically derived associations".Proceedings of the National Academy of Sciences.96(9): 5245–50.Bibcode:1999PNAS...96.5245L.doi:10.1073/pnas.96.9.5245.PMC21849.PMID10220451.
- Eagleman, DM (2001) "Visual Illusions and Neurobiology."Nature Reviews Neuroscience.2(12): 920–6.
