
Solar phenomena
This article has multiple issues.Please helpimprove itor discuss these issues on thetalk page.(Learn how and when to remove these messages)
|

Solar phenomenaarenatural phenomenawhich occur within theatmosphereof theSun.They take many forms, includingsolar wind,radio wave flux,solar flares,coronal mass ejections,[1]coronal heatingandsunspots.
These phenomena are believed to be generated by a helicaldynamo,located near the center of the Sun's mass, which generates strong magnetic fields, as well as a chaotic dynamo, located near the surface, which generates smaller magnetic field fluctuations.[2]All solar fluctuations together are referred to as solar variation, producingspace weatherwithin the Sun's graviational field.
Solar activity and related events have been recorded since the eighth century BCE. Throughout history, observation technology and methodology advanced, and in the 20th century, interest inastrophysicssurged and many solar telescopes were constructed. The 1931 invention of thecoronagraphallowed the corona to be studied in full daylight.
Sun
[edit]
The Sun is astarlocated at the center of theSolar System.It is almost perfectly spherical and consists of hotplasmaandmagnetic fields.[3][4]It has a diameter of about 1,392,684 kilometres (865,374 mi),[5]around 109 times that ofEarth,and its mass (1.989×1030kilograms, approximately 330,000 times that of Earth) accounts for some 99.86% of the total mass of the Solar System.[6]Chemically, about three quarters of the Sun's mass consists ofhydrogen,while the rest is mostlyhelium.The remaining 1.69% (equal to 5,600 times the mass of Earth) consists of heavier elements, includingoxygen,carbon,neonandiron.[7]
The Sun formed about 4.567 billion[a][8]years ago from the gravitational collapse of a region within a largemolecular cloud.Most of the matter gathered in the center, while the rest flattened into an orbiting disk that becamethe balance of the Solar System.The central mass became increasingly hot and dense, eventually initiatingthermonuclear fusionin its core.
The Sun is aG-type main-sequence star(G2V) based onspectral classand it is informally designated as ayellow dwarfbecause its visibleradiationis most intense in the yellow-green portion of thespectrum.It is actually white, but from the Earth's surface it appears yellow because ofatmospheric scatteringof blue light.[9]In the spectral class label,G2indicates itssurface temperature,of approximately 5770K[3]( the UAI will accept in 2014 5772K) andVindicates that the Sun, like most stars, is amain-sequencestar, and thus generates its energy via fusing hydrogen into helium. In its core, the Sun fuses about 620 million metric tons of hydrogen each second.[10][11]
The Earth's mean distance from the Sun is approximately 1astronomical unit(about 150,000,000 km; 93,000,000 mi), though the distance varies as the Earth moves fromperihelionin January toaphelionin July.[12]At this average distance,lighttravels from the Sun to Earth in about 8 minutes, 19 seconds. Theenergyof thissunlightsupports almost all life[b]on Earth byphotosynthesis,[13]and drives Earth's climate and weather.[14]As recently as the 19th century scientists had little knowledge of the Sun's physical composition and source of energy. This understanding is still developing; a number ofpresent-day anomaliesin the Sun's behavior remain unexplained.
Solar cycle
[edit]
Many solar phenomena change periodically over an average interval of about 11 years. This solar cycle affectssolar irradiationand influences space weather, terrestrialweatherandclimate.
The solar cycle also modulates the flux of short-wavelength solar radiation, fromultraviolettoX-rayand influences the frequency ofsolar flares,coronal mass ejectionsand other solar eruptive phenomena.
Types
[edit]| Part of a series of articles about |
| Heliophysics |
|---|
 |
Coronal mass ejections
[edit]A coronal mass ejection (CME) is a massive burst ofsolar windand magnetic fields rising above thesolar corona.[15]Nearsolar maxima,the Sun produces about three CMEs every day, whereassolar minimafeature about one every five days.[16]CMEs, along with solar flares of other origin, can disruptradio transmissionsand damagesatellitesandelectrical transmission linefacilities, resulting in potentially massive and long-lastingpower outages.[17][18]
Coronal mass ejections often appear with other forms of solar activity, most notablysolar flares,but no causal relationship has been established. Most weak flares do not have CMEs; most powerful ones do. Most ejections originate fromactive regionson the Sun's surface, such as sunspot groupings associated with frequent flares. Other forms of solar activity frequently associated with coronal mass ejections are eruptive prominences, coronal dimming, coronal waves andMoreton waves,also called solar tsunami.
Magnetic reconnectionis responsible for CME andsolar flares.Magnetic reconnection is the name given to the rearrangement of magnetic field lines when two oppositely directed magnetic fields are brought together. This rearrangement is accompanied with a sudden release of energy stored in the original oppositely directed fields.[19][20]
When a CME impacts the Earth's magnetosphere, it temporarily deforms the Earth'smagnetic field,changing the direction of compass needles and inducing large electrical ground currents in Earth itself; this is called ageomagnetic stormand it is a global phenomenon. CME impacts can inducemagnetic reconnectionin Earth'smagnetotail(the midnight side of the magnetosphere); this launches protons and electrons downward toward Earth's atmosphere, where they form theaurora.
Flares
[edit]A solar flare is a sudden flash of brightness observed over the Sun's surface or thesolar limb,which is interpreted as anenergyrelease of up to 6 × 1025joules(about a sixth of thetotal Sun's energy output each secondor 160 billion megatons ofTNTequivalent, over 25,000 times more energy than released from the impact ofComet Shoemaker–Levy 9with Jupiter). It may be followed by acoronal mass ejection.[21]The flare ejects clouds of electrons, ions and atoms through the corona into space. These clouds typically reachEartha day or two after the event.[22]Similar phenomena in other stars are known as stellar flares.
Solar flares strongly influence space weather near the Earth. They can produce streams of highly energetic particles in the solar wind, known as asolar proton event.These particles can impact the Earth's magnetosphere in the form of ageomagnetic stormand presentradiationhazards to spacecraft and astronauts.
- A solar flare
-
 On August 31, 2012, a long prominence/filament of solar material that had been hovering in the Sun's atmosphere, the corona, erupted out into space at 4:36 p.m. EDT.
 -
 Diagram of the magnetic-field structure of a solar flare and its origin, inferred to result from the deformation of such a magnetic structure linking the solar interior with the solar atmosphere up through thecorona.
 -
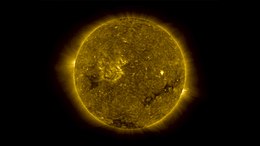 A complete 2D-Image taken bySTEREO(High Resolution)


Solar proton events
[edit]
A solar proton event (SPE), or "proton storm", occurs when particles (mostly protons) emitted by the Sun become accelerated either close to the Sun during a flare or in interplanetary space by CME shocks. The events can include other nuclei such as helium ions andHZE ions.These particles cause multiple effects. They can penetrate the Earth's magnetic field and causeionizationin theionosphere.The effect is similar to auroral events, except that protons rather than electrons are involved. Energetic protons are a significant radiation hazard to spacecraft and astronauts.[23]Energeticprotonscan reach Earth within 30 minutes of a major flare's peak.
Prominences
[edit]A prominence is a large, bright, gaseous feature extending outward from theSun's surface, often in the shape of aloop.Prominences are anchored to the Sun's surface in the photosphere and extend outwards into the corona. While the corona consists of high temperatureplasma,which does not emit muchvisible light,prominences contain much cooler plasma, similar in composition to that of thechromosphere.
Prominence plasma is typically a hundred times cooler and denser than coronal plasma. A prominence forms over timescales of about an earthly day and may persist for weeks or months. Some prominences break apart and form CMEs.
A typical prominence extends over many thousands of kilometers; the largest on record was estimated at over 800,000 kilometres (500,000 mi) long [24]– roughly the solar radius.
When a prominence is viewed against the Sun instead of space, it appears darker than the background. This formation is called a solar filament.[24]It is possible for a projection to be both a filament and a prominence. Some prominences are so powerful that they eject matter at speeds ranging from 600 km/s to more than 1000 km/s. Other prominences form huge loops or arching columns of glowing gases over sunspots that can reach heights of hundreds of thousands of kilometers.[25]
Sunspots
[edit]Sunspots are relatively dark areas on the Sun's radiating 'surface' (photosphere) where intense magnetic activity inhibits convection and cools thePhotosphere.Faculaeare slightly brighter areas that form around sunspot groups as the flow of energy to the photosphere is re-established and both the normal flow and the sunspot-blocked energy elevate the radiating 'surface' temperature. Scientists began speculating on possible relationships between sunspots and solar luminosity in the 17th century.[26][27]Luminosity decreases caused by sunspots (generally < - 0.3%) are correlated with increases (generally < + 0.05%) caused both by faculae that are associated with active regions as well as the magnetically active 'bright network'.[28]
The net effect during periods of enhanced solar magnetic activity is increased radiant solar output because faculae are larger and persist longer than sunspots. Conversely, periods of lower solar magnetic activity and fewer sunspots (such as theMaunder Minimum) may correlate with times of lower irradiance.[29]
Sunspot activity has been measured using theWolf numberfor about 300 years. This index (also known as the Zürich number) uses both the number of sunspots and the number of sunspot groups to compensate for measurement variations. A 2003 study found that sunspots had been more frequent since the 1940s than in the previous 1150 years.[30]
Sunspots usually appear as pairs with opposite magnetic polarity.[31]Detailed observations reveal patterns, in yearly minima and maxima and in relative location. As each cycle proceeds, the latitude of spots declines, from 30 to 45° to around 7° after thesolar maximum.This latitudinal change followsSpörer's law.
For a sunspot to be visible to the human eye it must be about 50,000 km in diameter, covering 2,000,000,000 square kilometres (770,000,000 sq mi) or 700 millionths of the visible area. Over recent cycles, approximately 100 sunspots or compact sunspot groups are visible from Earth.[c][32]
Sunspots expand and contract as they move about and can travel at a few hundred meters per second when they first appear.
-
 Spörer's lawnoted that at the start of an 11-year sunspot cycle, the spots appeared first at higher latitudes and later in progressively lower latitudes.
 -
 A report in theDaily Mailcharacterized sunspot 1302 as a "behemoth" unleashing huge solar flares.
 -
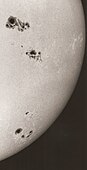 Detail of the Sun's surface, analog photography with a 4 "Refractor, yellow glass filter and foil filter ND 4, ObservatoryGroßhadern,Munich
 -
 Detailed view of sunspot, 13 December 2006


Wind
[edit]

The solar wind is a stream of plasma released from the Sun'supper atmosphere.It consists of mostlyelectronsand protons with energies usually between 1.5 and 10keV.The stream of particles varies in density, temperature and speed over time and over solar longitude. These particles can escape the Sun's gravity because of their high energy.
The solar wind is divided into the slow solar wind and the fast solar wind. The slow solar wind has a velocity of about 400 kilometres per second (250 mi/s), a temperature of 2×10⁵K and a composition that is a close match to the corona. The fast solar wind has a typical velocity of 750 km/s, a temperature of 8×10⁵K and nearly matches the photosphere's.[33][34]The slow solar wind is twice as dense and more variable in intensity than the fast solar wind. The slow wind has a more complex structure, with turbulent regions and large-scale organization.[35][36]
Both the fast and slow solar wind can be interrupted by large, fast-moving bursts of plasma called interplanetary CMEs, or ICMEs. They cause shock waves in the thin plasma of theheliosphere,generating electromagnetic waves and accelerating particles (mostly protons and electrons) to form showers ofionizing radiationthat precede the CME.
Effects
[edit]Space weather
[edit]
Space weather is the environmental condition within the Solar System, including thesolar wind.It is studied especially surrounding the Earth, including conditions from the magnetosphere to the ionosphere andthermosphere.Space weather is distinct from terrestrialweatherof thetroposphereandstratosphere.The term was not used until the 1990s. Prior to that time, such phenomena were considered to be part of physics oraeronomy.
Solar storms
[edit]Solar storms are caused by disturbances on the Sun, most oftencoronal cloudsassociated withsolar flareCMEs emanating from active sunspot regions, or less often fromcoronal holes.The Sun can produce intensegeomagneticand proton storms capable of causingpower outages,disruption orcommunications blackouts(includingGPSsystems) and temporary/permanent disabling of satellites and other spaceborne technology. Solar storms may be hazardous to high-latitude, high-altitude aviation and tohuman spaceflight.[37]Geomagnetic storms cause aurorae.[38]
The most significant known solar storm occurred in September 1859 and is known as theCarrington event.[39][40]
Aurora
[edit]An aurora is a natural light display in the sky, especially in the high latitude (ArcticandAntarctic) regions, in the form of a large circle around the pole. It is caused by the collision ofsolar windand charged magnetospheric particles with the high altitude atmosphere (thermosphere).
Most auroras occur in a band known as theauroral zone,[41][42]which is typically 3° to 6° wide in latitude and observed at 10° to 20° from thegeomagnetic polesat all longitudes, but often most vividly around the spring and autumnequinoxes.The charged particles and solar wind are directed into the atmosphere by the Earth's magnetosphere. A geomagnetic storm expands the auroral zone to lower latitudes.
Auroras are associated with the solar wind. The Earth's magnetic field traps its particles, many of which travel toward the poles where they are accelerated toward Earth. Collisions between these ions and the atmosphere release energy in the form of auroras appearing in large circles around the poles. Auroras are more frequent and brighter during the solar cycle's intense phase when CMEs increase the intensity of the solar wind.[43]
Geomagnetic storm
[edit]A geomagnetic storm is a temporary disturbance of the Earth'smagnetospherecaused by asolar windshock wave and/or cloud of magnetic field that interacts with theEarth's magnetic field.The increase in solar wind pressure compresses the magnetosphere and the solar wind's magnetic field interacts with the Earth's magnetic field to transfer increased energy into the magnetosphere. Both interactions increase plasma movement through the magnetosphere (driven by increased electric fields) and increase the electric current in the magnetosphere and ionosphere.[44]
The disturbance in the interplanetary medium that drives a storm may be due to a CME or a high speed stream (co-rotating interaction region or CIR)[45]of the solar wind originating from a region of weak magnetic field on the solar surface. The frequency of geomagnetic storms increases and decreases with thesunspotcycle. CME driven storms are more common during the solar maximum of the solar cycle, while CIR-driven storms are more common during the solar minimum.
Several space weather phenomena are associated with geomagnetic storms. These include Solar Energetic Particle (SEP) events,geomagnetically induced currents(GIC), ionospheric disturbances that cause radio and radarscintillation,disruption of compass navigation and auroral displays at much lower latitudes than normal. A1989 geomagnetic stormenergizedground induced currentsthat disrupted electric power distribution throughout most of the province ofQuebec[46]and caused aurorae as far south asTexas.[47]
Sudden ionospheric disturbance
[edit]A sudden ionospheric disturbance (SID) is an abnormally high ionization/plasma density in theD regionof the ionosphere caused by a solar flare. The SID results in a sudden increase in radio-wave absorption that is most severe in the uppermedium frequency(MF) and lowerhigh frequency(HF) ranges, and as a result often interrupts or interferes withtelecommunicationssystems.[48]
Geomagnetically induced currents
[edit]Geomagnetically induced currents are a manifestation at ground level of space weather, which affect the normal operation of long electrical conductor systems. During space weather events, electric currents in the magnetosphere and ionosphere experience large variations, which manifest also in the Earth's magnetic field. These variationsinducecurrents (GIC) in earthly conductors.Electric transmission gridsand buriedpipelinesare common examples of such conductor systems. GIC can cause problems such as increasedcorrosionof pipeline steel and damaged high-voltage power transformers.
Carbon-14
[edit]
The production ofcarbon-14(radiocarbon:14C) is related to solar activity. Carbon-14 is produced in the upper atmosphere when cosmic ray bombardment of atmospheric nitrogen (14N) induces the nitrogen to undergoβ+ decay,thus transforming into an unusual isotope of carbon with an atomic weight of 14 rather than the more common 12. Because galactic cosmic rays are partially excluded from the Solar System by the outward sweep of magnetic fields in the solar wind, increased solar activity reduces14C production.[49]
Atmospheric14C concentration is lower during solar maxima and higher during solar minima. By measuring the captured14C in wood and counting tree rings, production of radiocarbon relative to recent wood can be measured and dated. A reconstruction of the past 10,000 years shows that the14C production was much higher during the mid-Holocene7,000 years ago and decreased until 1,000 years ago. In addition to variations in solar activity, long-term trends in carbon-14 production are influenced by changes in the Earth'sgeomagnetic fieldand by changes in carbon cycling within thebiosphere(particularly those associated with changes in the extent of vegetation betweenice ages).[citation needed]
Climate
[edit]While solar activity has been a main driver of climate change over geologic time, its role in the warming that began in the twentieth century does not appear to have been significant.[50]
Observation history
[edit]Solar activity and related events have been regularly recorded since the time of theBabylonians.Early records described solar eclipses, the corona and sunspots.

Soon after the invention of telescopes, in the early 1600s, astronomers began observing the Sun.Thomas Harriotwas the first to observe sunspots, in 1610. Observers confirmed the less-frequent sunspots and aurorae during the Maunder minimum.[51]
Solar spectrometry began in 1817.[52]Rudolf Wolfgathered sunspot observations as far back as the 1755–1766 cycle. He established a relative sunspot number formulation (theWolf or Zürich sunspot number) that became the standard measure. Around 1852, Sabine, Wolf, Gautier and von Lamont independently found a link between the solar cycle and geomagnetic activity.[52]
On 2 April 1845,FizeauandFoucaultfirst photographed the Sun. Photography assisted in the study of solar prominences,granulation,spectroscopy and solar eclipses.[52]
On 1 September 1859, Richard C. Carrington and separately R. Hodgson first observed a solar flare.[52]Carrington andGustav Spörerdiscovered that the Sun exhibitsdifferential rotation,and that the outer layer must be fluid.[52]
In 1907–08,George Ellery Haleuncovered the Sun's magnetic cycle and the magnetic nature of sunspots. Hale and his colleagues later deduced Hale's polarity laws that described its magnetic field.[52]
Bernard Lyot's 1931 invention of thecoronagraphallowed the corona to be studied in full daylight.[52]
The Sun was, until the 1990s, the only star whose surface had been resolved.[53]Other major achievements included understanding of:[54]
- X-ray-emitting loops (e.g.,byYohkoh)
- Corona and solar wind (e.g.,bySoHO)
- Variance of solar brightness with level of activity, and verification of this effect in other solar-type stars (e.g.,byACRIM)
- The intensefibrilstate of the magnetic fields at the visible surface of a star like the Sun (e.g.,byHinode)
- The presence of magnetic fields of 0.5×10⁵to 1×10⁵gauss at the base of the conductive zone, presumably in some fibril form, inferred from the dynamics of rising azimuthal flux bundles.
- Low-levelelectron neutrinoemission from the Sun's core.[54]
In the later twentieth century, satellites began observing the Sun, providing many insights. For example, modulation of solar luminosity by magnetically active regions was confirmed by satellite measurements of total solar irradiance (TSI) by the ACRIM1 experiment on theSolar Maximum Mission(launched in 1980).[28]
See also
[edit]- Attribution of recent climate change(sectionSolar activity)
- Climate change(sectionSolar output)
- List of articles related to the Sun
- Outline of astronomy
- Radiative levitation
- Solar cycle
Notes
[edit]- ^All numbers in this article are short scale. One billion is 109,or 1,000,000,000.
- ^Hydrothermal vent communitieslive so deep under the sea that they have no access to sunlight. Bacteria instead use sulfur compounds as an energy source, viachemosynthesis.
- ^This is based on the hypothesis that the average human eye may have a resolution of 3.3×10⁻⁴radians or 70 arc seconds, with a 1.5 millimetres (0.059 in) maximum pupil dilation in relatively bright light.[32]
References
[edit]- ^Siscoe, George L.;Schrijver, Carolus J., eds. (2010).Heliophysics: evolving solar activity and the climates of space and earth(1. publ. ed.). Cambridge: Cambridge University Press.ISBN9780521112949.Retrieved28 August2014.
- ^Giampapa, Mark S; Hill, Frank; Norton, Aimee A; Pevtsov, Alexei A."Causes of Solar Activity"(PDF).A Science White Paper for the Heliophysics 2010 Decadal Survey:1.Retrieved26 August2014.
- ^"How Round is the Sun?".NASA. 2 October 2008. Archived fromthe originalon 17 September 2018.Retrieved7 March2011.
- ^"First Ever STEREO Images of the Entire Sun".NASA. 6 February 2011. Archived fromthe originalon 8 March 2011.Retrieved7 March2011.
- ^Emilio, M.; Kuhn, J. R.; Bush, R. I.; Scholl, I. F. (2012). "Measuring the Solar Radius from Space during the 2003 and 2006 Mercury Transits".The Astrophysical Journal.750(2): 135.arXiv:1203.4898.Bibcode:2012ApJ...750..135E.doi:10.1088/0004-637X/750/2/135.S2CID119255559.
- ^Woolfson, M. (2000). "The origin and evolution of the solar system".Astronomy & Geophysics.41(1): 1.12–1.19.Bibcode:2000A&G....41a..12W.CiteSeerX10.1.1.475.5365.doi:10.1046/j.1468-4004.2000.00012.x.
- ^Basu, S.; Antia, H. M. (2008). "Helioseismology and Solar Abundances".Physics Reports.457(5–6): 217–283.arXiv:0711.4590.Bibcode:2008PhR...457..217B.doi:10.1016/j.physrep.2007.12.002.S2CID119302796.
- ^Connelly, James N.; Bizzarro, Martin; Krot, Alexander N.; Nordlund, Åke; Wielandt, Daniel; Ivanova, Marina A. (2 November 2012). "The Absolute Chronology and Thermal Processing of Solids in the Solar Protoplanetary Disk".Science.338(6107): 651–655.Bibcode:2012Sci...338..651C.doi:10.1126/science.1226919.PMID23118187.S2CID21965292.
- ^Wilk, S. R. (2009)."The Yellow Sun Paradox".Optics & Photonics News:12–13. Archived fromthe originalon 2012-06-18.
- ^Phillips, K. J. H. (1995).Guide to the Sun.Cambridge University Press.pp. 47–53.ISBN978-0-521-39788-9.
- ^Kruszelnicki, Karl S. (17 April 2012)."Dr Karl's Great Moments In Science: Lazy Sun is less energetic than compost".Australian Broadcasting Corporation.Retrieved25 February2014.
Every second, the Sun burns 620 million tonnes of hydrogen...
- ^"Equinoxes, Solstices, Perihelion, and Aphelion, 2000–2020".US Naval Observatory.31 January 2008. Archived fromthe originalon 13 October 2007.Retrieved17 July2009.
- ^Simon, A. (2001).The Real Science Behind the X-Files: Microbes, meteorites, and mutants.Simon & Schuster.pp. 25–27.ISBN978-0-684-85618-6.
- ^Portman, D. J. (1952-03-01). "Review of Cycles in Weather and Solar Activity. by Maxwell O. Johnson".The Quarterly Review of Biology.27(1): 136–137.doi:10.1086/398866.JSTOR2812845.
- ^Christian, Eric R. (5 March 2012)."Coronal Mass Ejections".NASA.gov.Archived fromthe originalon 10 April 2000.Retrieved9 July2013.
- ^Nicky Fox."Coronal Mass Ejections".Goddard Space Flight Center @ NASA.Retrieved2011-04-06.
- ^Baker, Daniel N.; et al. (2008).Severe Space Weather Events – Understanding Societal and Economic Impacts: A Workshop Report.National Academies Press.p. 77.ISBN978-0-309-12769-1.
- ^Wired world is increasingly vulnerable to coronal ejections from the Sun,Aviation Week & Space Technology,14 January 2013 issue, pp. 49–50: "But the most serious potential for damage rests with the transformers that maintain the proper voltage for efficient transmission of electricity through the grid."
- ^"Coronal Mass Ejections: Scientists Unlock the Secrets of Exploding Plasma Clouds On the Sun".Science Daily.
- ^[1]Archived2021-02-24 at theWayback MachineNASA Science
- ^Kopp, G.; Lawrence, G; Rottman, G. (2005). "The Total Irradiance Monitor (TIM): Science Results".Solar Physics.20(1–2): 129–139.Bibcode:2005SoPh..230..129K.doi:10.1007/s11207-005-7433-9.S2CID44013218.
- ^Menzel, Whipple, and de Vaucouleurs, "Survey of the Universe", 1970
- ^Contribution of High Charge and Energy (HZE) Ions During Solar-Particle Event of September 29, 1989Kim, Myung-Hee Y.; Wilson, John W.; Cucinotta, Francis A.; Simonsen, Lisa C.; Atwell, William; Badavi, Francis F.; Miller, Jack, NASA Johnson Space Center; Langley Research Center, May 1999.
- ^abAtkinson, Nancy (August 6, 2012)."Huge Solar Filament Stretches Across the Sun".Universe Today.RetrievedAugust 11,2012.
- ^"About Filaments and Prominences".Retrieved2010-01-02.
- ^Eddy, J.A. (1990)."Samuel P. Langley (1834–1906)".Journal for the History of Astronomy.21:111–20.Bibcode:1990JHA....21..111E.doi:10.1177/002182869002100113.S2CID118962423.Archived fromthe originalon May 10, 2009.
- ^Foukal, P. V.; Mack, P. E.; Vernazza, J. E. (1977). "The effect of sunspots and faculae on the solar constant".The Astrophysical Journal.215:952.Bibcode:1977ApJ...215..952F.doi:10.1086/155431.
- ^abWillson RC, Gulkis S, Janssen M, Hudson HS, Chapman GA (February 1981). "Observations of Solar Irradiance Variability".Science.211(4483): 700–2.Bibcode:1981Sci...211..700W.doi:10.1126/science.211.4483.700.PMID17776650.
- ^Rodney Viereck, NOAA Space Environment Center.The Sun-Climate Connection
- ^Usoskin, Ilya G.;Solanki, Sami K.;Schüssler, Manfred; Mursula, Kalevi; Alanko, Katja (2003)."A Millennium Scale Sunspot Number Reconstruction: Evidence For an Unusually Active Sun Since the 1940s".Physical Review Letters.91(21): 211101.arXiv:astro-ph/0310823.Bibcode:2003PhRvL..91u1101U.doi:10.1103/PhysRevLett.91.211101.PMID14683287.S2CID20754479.
- ^"Sunspots".NOAA.Retrieved22 February2013.
- ^abKennwell, John (2014)."Naked Eye Sunspots".Bureau of Meteorology.Commonwealth of Australia. Archived fromthe originalon 3 September 2014.Retrieved29 August2014.
- ^Bruno, Roberto; Carbone, Vincenzo (2016).Turbulence in the Solar Wind.Switzerland: Springer International Publishing. p. 4.ISBN978-3-319-43440-7.
- ^Feldman, U.; Landi, E.; Schwadron, N. A. (2005)."On the sources of fast and slow solar wind".Journal of Geophysical Research.110(A7): A07109.1–A07109.12.Bibcode:2005JGRA..110.7109F.doi:10.1029/2004JA010918.
- ^Kallenrode, May-Britt (2004).Space Physics: An Introduction to Plasmas and.Springer.ISBN978-3-540-20617-0.
- ^Suess, Steve (June 3, 1999)."Overview and Current Knowledge of the Solar Wind and the Corona".The Solar Probe.NASA/Marshall Space Flight Center. Archived fromthe originalon June 10, 2008.Retrieved2008-05-07.
- ^Phillips, Tony (21 Jan 2009)."Severe Space Weather—Social and Economic Impacts".NASA Science News.National Aeronautics and Space Administration. Archived fromthe originalon 2021-06-02.Retrieved2014-05-07.
- ^"NOAA Space Weather Scales".NOAA Space Weather Prediction Center. 1 Mar 2005. Archived fromthe originalon May 7, 2014.Retrieved2014-05-07.
- ^Bell, Trudy E.; T. Phillips (6 May 2008)."A Super Solar Flare".NASA Science News.National Aeronautics and Space Administration.Retrieved2014-05-07.
- ^Kappenman, John (2010).Geomagnetic Storms and Their Impacts on the U.S. Power Grid(PDF).META-R. Vol. 319. Goleta, CA: Metatech Corporation for Oak Ridge National Laboratory.OCLC811858155.Archived fromthe original(PDF)on 2013-03-10.
- ^Feldstein, Y. I. (1963). "Some problems concerning the morphology of auroras and magnetic disturbances at high latitudes".Geomagnetism and Aeronomy.3:183–192.Bibcode:1963Ge&Ae...3..183F.
- ^Feldstein, Y. I. (1986). "A Quarter Century with the Auroral Oval".EOS.67(40): 761.Bibcode:1986EOSTr..67..761F.doi:10.1029/EO067i040p00761-02.
- ^National Aeronautics and Space Administration,Science Mission Directorate(2009)."Space Weather 101".Mission:Science.Archived fromthe originalon 2010-02-07.Retrieved2014-08-30.
- ^Corotating Interaction Regions,Corotating Interaction Regions Proceedings of an ISSI Workshop, 6–13 June 1998, Bern, Switzerland, Springer (2000), Hardcover,ISBN978-0-7923-6080-3,Softcover,ISBN978-90-481-5367-1
- ^Corotating Interaction Regions,Corotating Interaction Regions Proceedings of an ISSI Workshop, 6–13 June 1998, Bern, Switzerland, Springer (2000), Hardcover,ISBN978-0-7923-6080-3,Softcover,ISBN978-90-481-5367-1
- ^"Scientists probe northern lights from all angles".CBC.22 October 2005.
- ^"Earth dodges magnetic storm".New Scientist.24 June 1989.
- ^Federal Standard 1037C[2]Glossary of Telecommunications Terms], retrieved 2011 Dec 15
- ^"Astronomy: On the Sunspot Cycle".Archived fromthe originalon February 13, 2008.Retrieved2008-02-27.
- ^Hegerl,et al.,Chapter 9: Understanding and Attributing Climate ChangeArchived2011-11-28 at theWayback Machine,Executive SummaryArchived2018-11-18 at theWayback Machine,in IPCC AR4 WG1 2007.
- ^"History of Solar Physics: A Time Line of Great Moments: 0–1599".High Altitude Observatory.University Corporation for Atmospheric Research. Archived fromthe originalon 18 August 2014.Retrieved15 August2014.
- ^abcdefg"History of Solar Physics: A Time Line of Great Moments: 1800–1999".High Altitude Observatory.University Corporation for Atmospheric Research. Archived fromthe originalon 18 August 2014.Retrieved15 August2014.
- ^Burns, D.; Baldwin, J. E.; Boysen, R. C.; Haniff, C. A.; et al. (September 1997)."The surface structure and limb-darkening profile of Betelgeuse".Monthly Notices of the Royal Astronomical Society.290(1): L11–L16.Bibcode:1997MNRAS.290L..11B.doi:10.1093/mnras/290.1.l11.
- ^abNational Research Council (U.S.). Task Group on Ground-based Solar Research (1998).Ground-based Solar Research: An Assessment and Strategy for the Future.Washington D.C.: National Academy Press. p. 10.
Further reading
[edit]- Karl, Thomas R.; Melillo, Jerry M.; Peterson, Thomas C. (2009)."Global Climate Change Impacts in the United States"(PDF).Cambridge University Press.Retrieved30 January2024.
- Willson, Richard C.; H.S. Hudson (1991). "The Sun's luminosity over a complete solar cycle".Nature.351(6321): 42–4.Bibcode:1991Natur.351...42W.doi:10.1038/351042a0.S2CID4273483.
- Foukal, Peter; et al. (1977). "The effects of sunspots and faculae on the solar constant".Astrophysical Journal.215:952.Bibcode:1977ApJ...215..952F.doi:10.1086/155431.
- Dziembowski, W.A.; P.R. Goode; J. Schou (2001). "Does the sun shrink with increasing magnetic activity?".Astrophysical Journal.553(2): 897–904.arXiv:astro-ph/0101473.Bibcode:2001ApJ...553..897D.doi:10.1086/320976.S2CID8177954.
- Stetson, H.T. (1937).Sunspots and Their Effects.New York: McGraw Hill.
- Yaskell, Steven Haywood (31 December 2012).Grand Phases On The Sun: The case for a mechanism responsible for extended solar minima and maxima.Trafford Publishing.ISBN978-1-4669-6300-9.
- Solar activityHugh HudsonScholarpedia,3(3):3967.doi:10.4249/scholarpedia.3967
External links
[edit]- NOAA / NESDIS / NGDC (2002)Solar Variability Affecting EarthNOAA CD-ROM NGDC-05/01. This CD-ROM contains over 100 solar-terrestrial and related global data bases covering the period through April 1990.
- Recent Total Solar Irradiance dataArchived2013-07-06 at theWayback Machineupdated every Monday
- Latest Space Weather Data– from the Solar Influences Data Analysis Center (Belgium)
- Latest images from Big Bear Solar Observatory(California)
- The Very Latest SOHO Images– from theESA/NASASolar & Heliospheric Observatory
- Map of Solar Active Regions– from theKislovodsk Mountain Astronomical Station