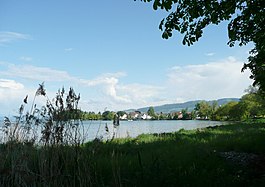
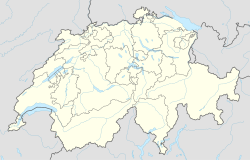
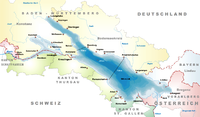
Steinach, St. Gallen
Steinach | |
|---|---|
 | |
| Coordinates:47°30′N9°26′E/ 47.500°N 9.433°E | |
| Country | Switzerland |
| Canton | St. Gallen |
| District | Rorschach |
| Government | |
| •Mayor | Michael Aebisegger |
| Area | |
| • Total | 4.52 km2(1.75 sq mi) |
| Elevation | 400 m (1,300 ft) |
| Population (31 December 2018)[2] | |
| • Total | 3,604 |
| • Density | 800/km2(2,100/sq mi) |
| Time zone | UTC+01:00(Central European Time) |
| • Summer (DST) | UTC+02:00(Central European Summer Time) |
| Postal code(s) | 9323 |
| SFOS number | 3217 |
| ISO 3166 code | CH-SG |
| Surrounded by | Arbon(TG),Berg,Horn(TG),Kressbronn am Bodensee(DE-BW),Langenargen(DE-BW),Mörschwil,Nonnenhorn(DE-BY),Tübach |
| Website | steinach SFSO statistics |
Steinachis amunicipalityin theWahlkreis(constituency) ofRorschachin thecantonofSt. GalleninSwitzerland.
Geography[edit]
Steinach has an area, as of 2006[update],of 4.5 km2(1.7 sq mi). Of this area, 63.4% is used for agricultural purposes, while 6.9% is forested. Of the rest of the land, 27.7% is settled (buildings or roads) and the remainder (2%) is non-productive (rivers or lakes).[3]

Coat of arms[edit]
Theblazonof the municipalcoat of armsisOr a Wolf rampant Azure langued and armed Gules.[4]
Demographics[edit]
Steinach has a population (as of 31 December 2020) of 3,549.[5]As of 2007[update],about 21.0% of the population was made up of foreign nationals. Of the foreign population, (as of 2000[update]), 69 are fromGermany,113 are fromItaly,210 are from ex-Yugoslavia,47 are fromAustria,63 are fromTurkey,and 74 are from another country.[6]Over the last 10 years the population has grown at a rate of 17.6%. Most of the population (as of 2000[update]) speaks German (89.9%), with Serbo-Croatian being second most common ( 3.0%) and Italian being third ( 2.2%).[3]Of the Swiss national languages (as of 2000[update]), 2,606 speakGerman,11 people speakFrench,63 people speakItalian,and 6 people speakRomansh.[7]
The age distribution, as of 2000[update],in Steinach is; 341 children or 11.8% of the population are between 0 and 9 years old and 313 teenagers or 10.8% are between 10 and 19. Of the adult population, 331 people or 11.4% of the population are between 20 and 29 years old. 531 people or 18.3% are between 30 and 39, 396 people or 13.7% are between 40 and 49, and 380 people or 13.1% are between 50 and 59. The senior population distribution is 298 people or 10.3% of the population are between 60 and 69 years old, 208 people or 7.2% are between 70 and 79, there are 92 people or 3.2% who are between 80 and 89, and there are 9 people or 0.3% who are between 90 and 99.[7]
In 2000[update]there were 409 persons (or 14.1% of the population) who were living alone in a private dwelling. There were 815 (or 28.1%) persons who were part of a couple (married or otherwise committed) without children, and 1,456 (or 50.2%) who were part of a couple with children. There were 144 (or 5.0%) people who lived in single parent home, while there are 25 persons who were adult children living with one or both parents, 9 persons who lived in a household made up of relatives, 22 who lived household made up of unrelated persons, and 19 who are either institutionalized or live in another type of collective housing.[7]
In the2007 federal electionthe most popular party was theSVPwhich received 36.1% of the vote. The next three most popular parties were theCVP(25%), theSP(16.1%) and theFDP(9.8%).[3]
In Steinach about 72.3% of the population (between age 25–64) have completed either non-mandatoryupper secondary educationor additional higher education (either university or aFachhochschule).[3]Out of the total population in Steinach, as of 2000[update],the highest education level completed by 663 people (22.9% of the population) wasPrimary,while 1,172 (40.4%) have completed their secondary education, 304 (10.5%) have attended aTertiaryschool, and 107 (3.7%) are not in school. The remainder did not answer this question.[7]
Economy[edit]
As of 2007[update],Steinach had an unemployment rate of 1.79%. As of 2005[update],there were 69 people employed in theprimary economic sectorand about 24 businesses involved in this sector. 1,273 people are employed in thesecondary sectorand there are 47 businesses in this sector. 309 people are employed in thetertiary sector,with 81 businesses in this sector.[3]As of October 2009[update]the average unemployment rate was 3.2%.[8]There were 140 businesses in the municipality of which 43 were involved in the secondary sector of the economy while 75 were involved in the third.[9]As of 2000[update]there were 459 residents who worked in the municipality, while 1,090 residents worked outside Steinach and 1,042 people commuted into the municipality for work.[10]
Religion[edit]
From the 2000 census[update],1,462 or 50.4% areRoman Catholic,while 760 or 26.2% belonged to theSwiss Reformed Church.Of the rest of the population, there are 2 individuals (or about 0.07% of the population) who belong to theChristian Catholicfaith, there are 87 individuals (or about 3.00% of the population) who belong to the Orthodox Church, and there are 86 individuals (or about 2.97% of the population) who belong to another Christian church. There are 136 (or about 4.69% of the population) who areIslamic.There are 6 individuals (or about 0.21% of the population) who belong to another church (not listed on the census), 274 (or about 9.45% of the population) belong to no church, areagnosticoratheist,and 86 individuals (or about 2.97% of the population) did not answer the question.[7]
Sights[edit]
TheSchlosslandschaft Rorschach / Alter Rhein,a number of castles in a region along the Rhine river, is designated as part of theInventory of Swiss Heritage Sites.TheSchlosslandschaftis shared betweenBerg,Goldach,Mörschwil,Rheineck,Rorschacherberg,St. Margrethen,Steinach,ThalandTübach.[11]
See also[edit]
References[edit]
- ^ab"Arealstatistik Standard - Gemeinden nach 4 Hauptbereichen".Federal Statistical Office.Retrieved13 January2019.
- ^"Ständige Wohnbevölkerung nach Staatsangehörigkeitskategorie Geschlecht und Gemeinde; Provisorische Jahresergebnisse; 2018".Federal Statistical Office. 9 April 2019.Retrieved11 April2019.
- ^abcdeSwiss Federal Statistical Officeaccessed 5 January 2010
- ^Flags of the World.comaccessed 5 January 2010
- ^"Ständige und nichtständige Wohnbevölkerung nach institutionellen Gliederungen, Geburtsort und Staatsangehörigkeit".bfs.admin.ch(in German). Swiss Federal Statistical Office - STAT-TAB. 31 December 2020.Retrieved21 September2021.
- ^Der Kanton St. Gallen und seine Menschen in Zahlen – Ausgabe 2009(in German)accessed 30 December 2009
- ^abcdeCanton St. Gallen Statistics-Hauptergebnisse der Volkszählung 2000: Regionen- und Gemeindevergleich-PersonenArchived3 October 2009 at theWayback Machine(in German)accessed 30 December 2009
- ^St Gallen Canton statistics-Unemployment(in German)accessed 30 December 2009
- ^St Gallen Canton statistics-BusinessesArchived7 July 2011 at theWayback Machine(in German)accessed 31 December 2009
- ^St Gallen Canton statistics-CommutersArchived22 July 2009 at theWayback Machine(in German)accessed 31 December 2009
- ^ISOS siteaccessed 8 December 2009
External links[edit]
- Official website(in German)


