
1976 United States presidential election
This articleneeds additional citations forverification.(September 2023) |
| |||||||||||||||||||||||||||||
538 members of theElectoral College 270 electoral votes needed to win | |||||||||||||||||||||||||||||
|---|---|---|---|---|---|---|---|---|---|---|---|---|---|---|---|---|---|---|---|---|---|---|---|---|---|---|---|---|---|
| Turnout | 54.8%[1] | ||||||||||||||||||||||||||||
| |||||||||||||||||||||||||||||
 Presidential election results map.Bluedenotes states won by Carter/Mondale andreddenotes those won by Ford/Dole.Pinkis the electoral vote forRonald Reaganby aWashingtonfaithless elector.Numbers indicateelectoral votescast by each state and the District of Columbia. | |||||||||||||||||||||||||||||
| |||||||||||||||||||||||||||||
The1976 United States presidential electionwas the 48th quadrennial presidential election, held on Tuesday, November 2, 1976. DemocratJimmy Carter,formerGovernor of Georgia,defeated incumbent Republican presidentGerald Fordin a narrow victory. This was the first presidential election since1932in which the incumbent was defeated, as well as the only Democratic victory of the six presidential elections between1968and1988.
Ford ascended to the presidency whenRichard Nixonresigned in 1974 in the wake of theWatergate scandal,which badly damaged the Republican Party and its electoral prospects. Ford promised to continue Nixon's political agenda and govern as a moderate Republican, causing considerable backlash from the conservative wing of his party. This spurred formerCalifornia governorRonald Reaganto mount a significant challenge against him inthe Republican primaries,in which Ford narrowly prevailed. Carter was unknown outside of his home state of Georgia at the start ofthe Democratic primaries,but he emerged as the front-runner after his victories in the first set of primaries. Campaigning as a political moderate within his own party and as a Washington outsider, Carter defeated numerous opponents to clinch the Democratic nomination.
Ford pursued a "Rose Garden strategy"in which he sought to portray himself as an experienced leader focused on fulfilling his role as chief executive.[2]On the other hand, Carter emphasized his status as a reformer who was "untainted" by Washington.[3]Saddled with a poor economy, thefallofSouth Vietnam,and the political fallout from the Watergate Scandal, including his unpopularpardon of Richard Nixon,Ford trailed by a wide margin in polls taken after Carter's formal nomination in July 1976. Ford's polling rebounded after a strong performance in the first presidential debate, and the race was close on election day.
Carter won a majority of the popular and electoral votes. He was able to carry several Midwestern and Northeastern swing states, as well as most states in the Democratic-dominated region of the South. Ford dominated the Western states. Carter's victory at the polls was due in part to the backlash against the Watergate scandal that still was deeply hurting Republican candidates. Ford became the only vice-president to become president and subsequently fail to win election for a term in his own right.
As of2020,this is also the last election in which the Democratic candidate won the majority of states in the South, carrying the states ofAlabama,Mississippi,South Carolina,andTexas(mainly due to Carter's southern roots), and the most recent election in which the losing candidate carried more states than the winning candidate. This is the only election in which California voted Republican while Ohio voted Democrat.
Since the death ofGeorge McGovernin 2012, this is the earliest election where at least one of the major party nominees for president (Carter) or vice president is still alive (Ford died in 2006 and both Mondale and Dole died in 2021).
This is the only election in which all 4 major presidential and vice presidential candidates would be their party's nominee for president and lose. In addition to Ford losing this election, Carter would lose reelection to Reagan in1980,Mondale would lose to President Reagan in1984,and Dole would lose to PresidentBill Clintonin1996.
Finally, beginning with this election and continuing all the way until2004inclusive, every Republican presidentialticketwould feature a candidate named either Bush or Dole.[4]
Nominations[edit]
Democratic Party[edit]
| ||
|---|---|---|
|
76th Governor of Georgia
39th President of the United States
Policies
Appointments
Tenure
Presidential campaigns Post-presidency
 |
||


 | |||||||||||||||||||||||||||||
| Jimmy Carter | Walter Mondale | ||||||||||||||||||||||||||||
|---|---|---|---|---|---|---|---|---|---|---|---|---|---|---|---|---|---|---|---|---|---|---|---|---|---|---|---|---|---|
| for President | for Vice President | ||||||||||||||||||||||||||||
 |
 | ||||||||||||||||||||||||||||
| 76th Governor of Georgia (1971–1975) |
U.S. Senator fromMinnesota (1964–1976) | ||||||||||||||||||||||||||||
| Campaign | |||||||||||||||||||||||||||||
| Candidates in this section are sorted by date of withdrawal from the nomination race | |||||||||||||||
| Jerry Brown | George Wallace | Mo Udall | Robert C. Byrd | Ellen McCormack | Walter Fauntroy | Walter Washington | Jesse Gray | Frank Church | Henry M. Jackson | Lloyd Bentsen | Milton Shapp | Fred Harris | Sargent Shriver | Birch Bayh | Terry Sanford |
|---|---|---|---|---|---|---|---|---|---|---|---|---|---|---|---|
 |
 |
 |
 |
 |
 |
 |
 |
 |
 |
 |
 |
 |
 |
 |
 |
| Governor ofCalifornia (1975–1983) |
Governor ofAlabama (1963–1967; 1971–1979) |
U.S. Representative forArizona's 2nd congressional district (1961–1991) |
U.S. Senator fromWest Virginia (1959–2010) |
Chair of theNew York Right to Life Party (1970–1976) |
Delegate to the U.S. House of Representatives forDistrict of Columbia's at-large congressional district (1971–1991) |
Mayor of the District of Columbia (1967–1979) |
New YorkState Assemblyman from the 70th district (1972–1975) |
U.S. Senator fromIdaho (1957–1981) |
U.S. Senator fromWashington (1953–1983) |
U.S. Senator fromTexas (1971–1993) |
Governor ofPennsylvania (1971–1979) |
U.S. Senator fromOklahoma (1964–1973) |
Democratic nominee forVice President of the United States in1972 |
U.S. Senator fromIndiana (1963–1981) |
Governor ofNorth Carolina (1961–1965) |
| Campaign | Campaign | Campaign | Campaign | Campaign | Campaign | Campaign | Campaign | Campaign | Campaign | Campaign | Campaign | Campaign | Campaign | Campaign | Campaign |
| LN:July 15, 1976 2,449,374votes |
LN:July 15, 1976 1,955,388votes |
LN:July 15, 1976 1,611,754votes |
LN:July 15, 1976 340,309votes |
LN:July 15, 1976 238,027votes |
LN:July 15, 1976 10,149votes |
LN:July 15, 1976 5,161votes |
LN:July 15, 1976 3,574votes |
W:June 14, 1976 830,818votes |
W:May 1, 1976 1,134,375votes |
W:May 1, 1976 4,046votes |
W:April 27, 1976 88,254votes |
W:April 2, 1976 234,568votes |
W:March 16, 1976 304,399votes |
W:March 4, 1976 86,438votes |
W:January 25, 1976 404votes |
The surprise winner of the 1976 Democratic presidential nomination was Jimmy Carter, a formerstate senatorand governor of Georgia. When the primaries began, Carter was little-known at the national level, and many political pundits regarded a number of better-known candidates, such as SenatorHenry M. Jacksonfrom Washington, RepresentativeMorris Udallfrom Arizona, GovernorGeorge Wallaceof Alabama, and California GovernorJerry Brown,as the favorites for the nomination. However, in the wake of theWatergate scandal,Carter realized that his status as a Washington outsider, political centrist, and moderate reformer could give him an advantage over his better-known establishment rivals. Carter also took advantage of the record number of state primaries and caucuses in 1976, to eliminate his better-known rivals one-by-one.
Henry M. Jackson made a fateful decision not to compete in the early Iowa caucus and New Hampshire primary, which Jimmy Carter won after liberals split their votes among four other candidates. Though Jackson went on to win the Massachusetts and New York primaries, he was forced to quit the race on May 1, after losing the critical Pennsylvania primary to Carter by twelve percentage points. Carter then defeated Governor Wallace, his main conservative challenger, by a wide margin in the North Carolina primary, thus forcing Wallace to end his campaign. Representative Udall, a liberal, then became Carter's main challenger. He finished second to Carter in the New Hampshire, Massachusetts, Wisconsin, New York, Michigan, South Dakota, and Ohio primaries, and won the caucuses in his home state of Arizona, while running even with Carter in the New Mexico caucuses. However, the fact that Udall finished second to Carter in most of these races meant that Carter steadily accumulated more delegates for the nomination than he did.
As Carter closed in on the nomination, an "ABC" ( "Anybody But Carter" ) movement started among Northern and Western liberal Democrats who worried that Carter's Southern upbringing would make him too conservative for the Democratic Party. The leaders of the "ABC" movement, Idaho SenatorFrank Churchand California Governor Jerry Brown, both announced their candidacies for the Democratic nomination, and defeated Carter in several late primaries. However, their campaigns started too late to prevent Carter from gathering the remaining delegates he needed to capture the nomination.
By June 1976, Carter had captured more than enough delegates to win the Democratic nomination. At the1976 Democratic National Convention,Carter easily won the nomination on the first ballot; Udall finished in second place. Carter then chose Minnesota Senator Walter Mondale, a liberal, as his running mate.
Republican Party[edit]
| ||
|---|---|---|
|
Pre-vice presidency
40th Vice President of the United States
38th President of the United States
Policies
Appointments
Tenure
Presidential campaign Post-presidency
|
||
 | |||||||||||||||||||||||||||||
| Gerald Ford | Bob Dole | ||||||||||||||||||||||||||||
|---|---|---|---|---|---|---|---|---|---|---|---|---|---|---|---|---|---|---|---|---|---|---|---|---|---|---|---|---|---|
| for President | for Vice President | ||||||||||||||||||||||||||||
 |
 | ||||||||||||||||||||||||||||
| 38th President of the United States (1974–1977) |
U.S. Senator fromKansas (1969–1996) | ||||||||||||||||||||||||||||
| Campaign | |||||||||||||||||||||||||||||
| Candidates in this section are sorted by date of withdrawal from the nomination race | |
| Ronald Reagan | |
|---|---|
 | |
| Governor ofCalifornia (1967–1975) | |
| Campaign | |
| LN:August 19, 1976 4,760,222votes | |
The contest for the Republican Party's presidential nomination in 1976 was between two serious candidates: incumbent president Gerald Ford, a member of the party's moderate wing, and former governor of CaliforniaRonald Reagan,a member of the party's conservative wing. The presidential primary campaign between the two men was hard-fought and relatively even; by the start of the Republican Convention in August 1976, the race for the nomination was still too close to call. Ford defeated Reagan by a narrow margin on the first ballot at the1976 Republican National ConventioninKansas City,and chose SenatorBob Dolefrom Kansas as his running mate in the place of incumbent vice presidentNelson Rockefeller,who had announced the previous year that he was not interested in being considered for the vice presidential nomination.[5]The 1976 Republican Convention was the last political convention to open with the presidential nomination still being undecided until the actual balloting at the convention.
Others[edit]
- Roger MacBride,who had gained fame in the1972 electionas afaithless elector,ran as the nominee of theLibertarian Party.
- Eugene McCarthy,a former Democratic Senator from Minnesota, ran as an independent candidate.
- Ben Bubar,Prohibition Partynominee.
- Frank Zeidler,former mayor of Milwaukee, Wisconsin, ran as the nominee ofSocialist Party USA,which was founded in 1973 in a split withSocialist Party of America.
- Gus Hall,four-time Communist Party candidate[6]
- Lester Maddox,the former Democratic Governor of Georgia (and Lieutenant Governor under Carter), ran as the nominee of theAmerican Independent Party
General election[edit]
Polling[edit]
| Poll source | Date(s) administered |
Jimmy Carter (D) |
Gerald Ford (R) |
Eugene McCarthy (I) |
Other | Undecided | Margin | ||
|---|---|---|---|---|---|---|---|---|---|
| Harris[7] | January 5–14, 1976 | 36% | 49% | - | — | 15% | 13 | ||
| Harris[8] | Late January, 1976 | 37% | 48% | - | — | 15% | 11 | ||
| Harris[9] | March, 1976 | 42% | 49% | - | — | 9% | 7 | ||
| Gallup[10] | March 10–13, 1976 | 47% | 42% | - | - | 11% | 5 | ||
| Gallup[11] | March 19–22, 1976 | 48% | 46% | - | - | 6% | 2 | ||
| Gallup[12] | March 26–29, 1976 | 47% | 46% | - | 2% | 5% | 1 | ||
| Gallup[13] | April 9–12, 1976 | 49% | 43% | - | 2% | 6% | 6 | ||
| Harris[9] | April 9–15, 1976 | 47% | 43% | - | — | 10% | 4 | ||
| Gallup[14] | April 30 – May 3, 1976 | 52% | 43% | - | - | 5% | 9 | ||
| Harris[15] | June, 1976 | 53% | 40% | - | - | 7% | 13 | ||
| Gallup[16] | June 11–14, 1976 | 55% | 37% | - | 3% | 5% | 18 | ||
| Gallup[17] | June 25–28, 1976 | 53% | 36% | - | - | 11% | 17 | ||
| July 12–15: Democratic National Convention | |||||||||
| Harris[18] | July 16–19, 1976 | 62% | 27% | 5% | - | 6% | 35 | ||
| Gallup[19] | July 16–19, 1976 | 62% | 29% | - | - | 9% | 33 | ||
| Harris[20] | July 31 – August 4, 1976 | 61% | 32% | - | - | 7% | 29 | ||
| Gallup[21] | August 6–9, 1976 | 57% | 32% | - | 3% | 8% | 25 | ||
| 54% | 32% | 6% | 1% | 7% | 22 | ||||
| August 16–19: Republican National Convention | |||||||||
| Harris[22] | August 18–20, 1976 | 53% | 39% | 6% | - | 2% | 14 | ||
| Gallup[23] | August 20–23, 1976 | 50% | 37% | - | - | 13% | 13 | ||
| Gallup[24] | August 27–30, 1976 | 54% | 36% | - | 2% | 8% | 18 | ||
| Harris[25] | September 24–25, 1976 | 50% | 41% | - | - | 9% | 9 | ||
| 46% | 39% | 5% | 1% | 9% | 7 | ||||
| Gallup[26] | September 24–27, 1976 | 51% | 40% | 4% | 1% | 4% | 11 | ||
| Gallup[27] | September 27 – October 4, 1976 | 47% | 45% | 1% | 1% | 6% | 2 | ||
| Harris[20] | October 7–11, 1976 | 47% | 42% | - | - | 11% | 5 | ||
| 44% | 40% | 6% | 1% | 9% | 4 | ||||
| Gallup[28] | October 8–11, 1976 | 48% | 42% | 2% | 2% | 6% | 6 | ||
| Gallup[29] | October 15–18, 1976 | 47% | 41% | 2% | 2% | 8% | 6 | ||
| Harris[30] | October 19–22, 1976 | 45% | 42% | 5% | 1% | 7% | 3 | ||
| Gallup[31] | October 22–25, 1976 | 49% | 44% | 2% | 1% | 4% | 5 | ||
| Harris[32] | October 23–26, 1976 | 45% | 44% | 4% | - | 7% | 1 | ||
| Gallup[33] | October 28–30, 1976 | 46% | 47% | 2% | 1% | 4% | 1 | ||
| Harris[34] | October 29–31, 1976 | 46% | 45% | 3% | 1% | 5% | 1 | ||
| Election Results | Nov. 2, 1976 | 50.08% | 48.02% | 0.91% | 0.99% | - | 2.06 | ||
Fall campaign[edit]

One of the advantages Ford held over Carter as the general election campaign began was his presidential privilege to preside over events celebrating theUnited States Bicentennial;this often resulted in favorable publicity for Ford. These included the Washington, D. C., fireworks display on theFourth of July,which was televised nationally.[35]On July 7, 1976, the President and First Lady served as hosts at a White House state dinner forQueen Elizabeth IIandPrince Philipof the United Kingdom, which was televised on thePublic Broadcasting Service(PBS) network. These events were part of Ford's "Rose Garden" strategy to win the election, meaning that instead of appearing as a typical politician, Ford presented himself as a "tested leader" who was busily fulfilling the role of national leader and chief executive. Not until October did Ford leave the White House to actively campaign across the nation.[citation needed]
Carter ran as a reformer who was "untainted" by Washington political scandals,[36]which many voters found attractive in the wake of theWatergate scandalthat had led to PresidentRichard Nixon's resignation. Ford, although personally unconnected with Watergate, was seen by many as too close to the discredited Nixon administration, especially after he granted Nixon a presidential pardon for any crimes he might have committed during his term of office. Ford's pardon of Nixon caused his popularity, as measured by public opinion polls, to plummet. Ford's refusal to explain his reasons for pardoning Nixon publicly (he would do so in his memoirs several years later), also hurt his image.[citation needed]
Ford unsuccessfully asked Congress to end the 1950s-era price controls on natural gas, which had caused a dwindling of American natural gas reserves after the1973 oil crisis.[37]Carter stated during his campaign that he opposed the ending of the price controls and thought such a move would be "disastrous".[38]
After the Democratic National Convention, Carter held a 33-point lead over Ford in the polls.[39]However, as the campaign continued, the race greatly tightened. During the campaignPlayboymagazine published a controversial interview with Carter; in the interview, Carter admitted to having "lusted in my heart" for women other than his wife and used the word "screw," which cut into his support among women and evangelical Christians.[40]On September 23, Ford performed well in what was the first televisedpresidential debatesince1960.Polls taken after the debate showed that most viewers felt that Ford was the winner. Carter was also hurt by Ford's charges that he lacked the necessary experience to be an effective national leader and that he was vague on many issues.[citation needed]

However, Ford also committed a costly blunder in the campaign that halted his momentum. During the second presidential debate on October 6, Ford stumbled when he asserted that "there is noSovietdomination of Eastern Europe, and there never will be under a Ford administration ". He added that he did not" believe that the Poles consider themselves dominated by the Soviet Union ", and made the same claim with regard to Yugoslavia and Romania (Yugoslavia was not aWarsaw Pactmember).[41]Ford refused to retract his statement for almost a week after the debate, causing his surge in the polls to stall and allowing Carter to maintain a slight lead in the polls.[citation needed]
A vice-presidential debate, the first formal one of its kind,[42]between Bob Dole and Walter Mondale also hurt the Republican ticket when Dole asserted that military unpreparedness on the part of Democratic presidents was responsible for all of the wars the U.S. had fought in the 20th century. Dole, a World War II veteran, noted that in every 20th-century war, from World War I to the Vietnam War, a Democrat had been president. Dole then pointed out that the number of U.S. casualties in "Democrat wars" was roughly equal to the population of Detroit. Many voters felt that Dole's criticism was unfairly harsh, and that his dispassionate delivery made him seem cold. Years later, Dole would remark that he regretted the comment, believing that it had hurt the Republican ticket.[43]One factor that did help Ford in the closing days of the campaign was a series of popular television appearances he did withJoe Garagiola,a retired baseball player for theSt. Louis Cardinalsand a well-known announcer forNBC Sports.Garagiola and Ford appeared in a number of shows in several large cities. During the show, Garagiola would ask Ford questions about his life and beliefs; the shows were so informal, relaxed, and laid-back that some television critics labelled them the "Joe and Jerry Show". Ford and Garagiola obviously enjoyed one another's company, and they remained friends after the election was over.[citation needed]
Presidential debates[edit]
There were three presidential debates and one vice presidential debate during the 1976 general election.[44][45]
| No. | Date | Host | City | Moderator | Panelists | Participants | Viewership (Millions) |
|---|---|---|---|---|---|---|---|
| P1 | Thursday, September 23, 1976 | Walnut Street Theatre | Philadelphia, Pennsylvania | Edwin Newman | Elizabeth Drew James P. Gannon Frank Reynolds |
Governor Jimmy Carter President Gerald Ford |
69.7[44] |
| P2 | Wednesday, October 6, 1976 | Palace of Fine Arts | San Francisco, California | Pauline Frederick | Max Frankel Henry Trewhitt Richard Valeriani |
Governor Jimmy Carter President Gerald Ford |
63.9[44] |
| VP | Friday, October 15, 1976 | Alley Theatre | Houston, Texas | James Hoge | Marilyn Berger Hal Bruno Walter Mears |
Senator Bob Dole Senator Walter Mondale |
43.2[44] |
| P3 | Friday, October 22, 1976 | Phi Beta Kappa Memorial Hall[46] | Williamsburg, Virginia | Barbara Walters | Joseph Kraft Robert Maynard Jack Nelson |
Governor Jimmy Carter President Gerald Ford |
62.7[44] |
Results[edit]
Despite his campaign's blunders, Ford managed to close the remaining gap in the polls, and by election day, the race was judged to be even. It took most of that night and the following morning to determine the winner. It was not until 3:30 am EST, that the NBC television network was able to declare that Carter had carried Mississippi and had thus accumulated more than the 270 electoral votes needed to win (seconds later, ABC News also declared Carter the winner, based on projections for Carter in Wisconsin and Hawaii, while CBS News announced Carter's victory at 3:45 am).[47]Carter defeated Ford by two percentage points in the national popular vote.
The electoral vote was the closest since1916;Carter carried 23 states, with 297 electoral votes, while Ford won 27 states, with 240 electoral votes (one elector, future state SenatorMike Paddenfrom Washington state, pledged to Ford, voted for Reagan[48]). Carter's victory came primarily from his near-sweep of the South (he lost only Virginia and Oklahoma), and his narrow victories in large Northern states such as New York, Ohio, and Pennsylvania. Ford did well in the West, carrying every state in that region, except for Hawaii. The most tightly contested state in the election was Oregon, which Ford won by under 2,000 votes.
By percentage of the vote, the states that secured Carter's victory were Wisconsin (1.68% margin) and Ohio (.27% margin). Had Ford won these states and all other states he carried, he would have won the presidency. The 27 states he won were, and still are, the most states ever carried by a losing candidate for president. Had Ford won the election, the provisions of the22nd amendmentwould have disqualified him from running in1980,as he served more than two years of Nixon's second term.
Records[edit]
Carter was the first Democratic presidential nominee sinceJohn F. Kennedyin1960to carry states in the Deep South (Bill Clintonwas the only Democrat since 1976 to carry more than one state from the Deep South, doing so in1992), and the only one sinceLyndon B. Johnsonin1964to carry a majority of allsouthern states.Carter performed very strongly in his home state of Georgia, carrying 66.7% of the vote and every county in the state. His winning of 23 states was only the second time in history that the winner of the election won fewer than half the states (after 1960). His 50.1% of the vote was the only time since 1964 that a Democrat managed to obtain an absolute majority of the popular vote in a presidential election, untilBarack Obamawon 52.9% of the vote in2008.Carter is one of six Democrats since theAmerican Civil Warto obtain anabsolute majorityof the popular vote, the others beingSamuel J. Tilden,Franklin D. Roosevelt,Lyndon B. Johnson, Barack Obama, andJoe Biden.
This election represents the last time to date thatTexas,Mississippi,Alabama,andSouth Carolinawould vote Democratic, and the last timeNorth Carolinawould vote Democratic until2008,as well as the last timeFloridavoted Democratic until1996,and the last timeArkansas,Delaware,Kentucky,Louisiana,Missouri,Ohio,Pennsylvania,andTennesseevoted Democratic until1992.[49]
This election was the last time that a Democrat won the presidency without winning a number of modern blue states and swing states, specifically California, Connecticut, Illinois, Maine, Michigan, Nevada, New Hampshire, New Jersey, New Mexico, Oregon, Vermont, and Washington. This is the only time a Democrat has won without New Mexico, as well as the only time it voted for a candidate who lost the popular vote. Similarly, it is one of only three instances in which a Democrat won without Nevada (the others being the two elections ofGrover Clevelandin1884and1892). And the Democrats did not win withoutIowaagain until2020.
It was the first time in exactly 100 years (since 1876) when Florida and Virginia supported different candidates, and the first time since Oklahoma statehood in 1907 when Oklahoma andTennesseedid so.
As Carter won about 319 more counties than Ford, this election would mark the last time a Democrat won a majority of counties.
Statistics[edit]
| Presidential candidate | Party | Home state | Popular vote | Electoral vote |
Running mate | |||
|---|---|---|---|---|---|---|---|---|
| Count | Percentage | Vice-presidential candidate | Home state | Electoral vote | ||||
| Jimmy Carter | Democratic | Georgia | 40,831,881 | 50.08% | 297 | Walter Mondale | Minnesota | 297 |
| Gerald Ford(incumbent) | Republican | Michigan | 39,148,634 | 48.02% | 240 | Bob Dole | Kansas | 241 |
| Ronald Reagan | Republican | California | —[b] | —[b] | 1 | |||
| Eugene McCarthy | None | Minnesota | 744,763 | 0.91% | 0 | [c] | [c] | 0 |
| Roger MacBride | Libertarian | Virginia | 172,557 | 0.21% | 0 | David Bergland | California | 0 |
| Lester Maddox | American Independent | Georgia | 170,373 | 0.21% | 0 | William Dyke | Wisconsin | 0 |
| Thomas J. Anderson | American | [d] | 158,724 | 0.19% | 0 | Rufus Shackelford | Florida | 0 |
| Peter Camejo | Socialist Workers | California | 90,986 | 0.11% | 0 | Willie Mae Reid | Illinois | 0 |
| Gus Hall | Communist | New York | 58,709 | 0.07% | 0 | Jarvis Tyner | New York | 0 |
| Margaret Wright | People's | California | 49,016 | 0.06% | 0 | Benjamin Spock | Connecticut | 0 |
| Lyndon LaRouche | U.S. Labor | New York | 40,018 | 0.05% | 0 | R. Wayne Evans | Michigan | 0 |
| Other | 75,119 | 0.09% | — | Other | — | |||
| Total | 81,540,780 | 100% | 538 | 538 | ||||
| Needed to win | 270 | 270 | ||||||
Source (Popular Vote):Leip, David."1976 Presidential Election Results".Dave Leip's Atlas of U.S. Presidential Elections.RetrievedAugust 7,2005.
Source (Electoral Vote):"Electoral College Box Scores 1789–1996".National Archives and Records Administration.RetrievedAugust 7,2005.
-
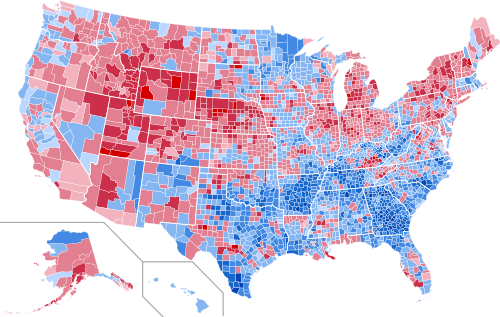 Results by county, shaded according to winning candidate's percentage of the vote
 -
 Results by congressional district, shaded according to winning candidate's percentage of the vote


Results by state[edit]
Source:[50]
This election represents the second time that the winning candidate has received a majority of the electoral votes while the second-place candidate carried a majority of the states. It had previously happened inthe 1960 election.The "margin" column shows the difference between the two leading candidates, and the "swing" column shows the margin swing from the respective party's nominee from 1972 to 1976.
| States/districts won byFord/Dole | |
| States/districts won byCarter/Mondale | |
| † | At-large results (Maine used the Congressional District Method) |
| Jimmy Carter Democratic |
Gerald Ford Republican |
Eugene McCarthy Independent |
Roger MacBride Libertarian |
Margin | Swing | State Total | ||||||||||||
|---|---|---|---|---|---|---|---|---|---|---|---|---|---|---|---|---|---|---|
| State | electoral votes |
# | % | electoral votes |
# | % | electoral votes |
# | % | electoral votes |
# | % | electoral votes |
# | % | # | ||
| Alabama | 9 | 659,170 | 55.73 | 9 | 504,070 | 42.61 | - | - | - | - | 1,481 | 0.13 | - | 155,100 | 13.11 | 60.00 | 1,182,850 | AL |
| Alaska | 3 | 44,058 | 35.65 | - | 71,555 | 57.90 | 3 | - | - | - | 6,785 | 5.49 | - | -27,497 | -22.25 | 1.26 | 123,574 | AK |
| Arizona | 6 | 295,602 | 39.80 | - | 418,642 | 56.37 | 6 | 19,229 | 2.59 | - | 7,647 | 1.03 | - | -123,040 | -16.57 | 14.69 | 742,719 | AZ |
| Arkansas | 6 | 499,614 | 64.94 | 6 | 268,753 | 34.93 | - | 647 | 0.08 | - | - | - | - | 230,861 | 30.01 | 68.12 | 769,396 | AR |
| California | 45 | 3,742,284 | 47.57 | - | 3,882,244 | 49.35 | 45 | 58,412 | 0.74 | - | 56,388 | 0.72 | - | -139,960 | -1.78 | 11.68 | 7,867,117 | CA |
| Colorado | 7 | 460,353 | 42.58 | - | 584,367 | 54.05 | 7 | 26,107 | 2.41 | - | 5,330 | 0.49 | - | -124,014 | -11.47 | 16.54 | 1,081,135 | CO |
| Connecticut | 8 | 647,895 | 46.90 | - | 719,261 | 52.06 | 8 | - | - | - | - | - | - | -71,366 | -5.17 | 13.27 | 1,381,526 | CT |
| Delaware | 3 | 122,596 | 51.98 | 3 | 109,831 | 46.57 | - | 2,437 | 1.03 | - | - | - | - | 12,765 | 5.41 | 25.82 | 235,834 | DE |
| D.C. | 3 | 137,818 | 81.63 | 3 | 27,873 | 16.51 | - | - | - | - | 274 | 0.16 | - | 109,945 | 65.12 | 8.58 | 168,830 | DC |
| Florida | 17 | 1,636,000 | 51.93 | 17 | 1,469,531 | 46.64 | - | 23,643 | 0.75 | - | 103 | 0.00 | - | 166,469 | 5.28 | 49.40 | 3,150,631 | FL |
| Georgia | 12 | 979,409 | 66.74 | 12 | 483,743 | 32.96 | - | 991 | 0.07 | - | 175 | 0.01 | - | 495,666 | 33.78 | 84.17 | 1,467,458 | GA |
| Hawaii | 4 | 147,375 | 50.59 | 4 | 140,003 | 48.06 | - | - | - | - | 3,923 | 1.35 | - | 7,372 | 2.53 | 27.49 | 291,301 | HI |
| Idaho | 4 | 126,549 | 37.12 | - | 204,151 | 59.88 | 4 | - | - | - | 3,558 | 1.04 | - | -77,602 | -22.76 | 15.44 | 340,932 | ID |
| Illinois | 26 | 2,271,295 | 48.13 | - | 2,364,269 | 50.10 | 26 | 55,939 | 1.19 | - | 8,057 | 0.17 | - | -92,974 | -1.97 | 16.55 | 4,718,833 | IL |
| Indiana | 13 | 1,014,714 | 45.70 | - | 1,183,958 | 53.32 | 13 | - | - | - | - | - | - | -169,244 | -7.62 | 25.15 | 2,220,362 | IN |
| Iowa | 8 | 619,931 | 48.46 | - | 632,863 | 49.47 | 8 | 20,051 | 1.57 | - | 1,452 | 0.11 | - | -12,932 | -1.01 | 16.12 | 1,279,306 | IA |
| Kansas | 7 | 430,421 | 44.94 | - | 502,752 | 52.49 | 7 | 13,185 | 1.38 | - | 3,242 | 0.34 | - | -72,331 | -7.55 | 30.60 | 957,845 | KS |
| Kentucky | 9 | 615,717 | 52.75 | 9 | 531,852 | 45.57 | - | 6,837 | 0.59 | - | 814 | 0.07 | - | 83,865 | 7.19 | 35.79 | 1,167,142 | KY |
| Louisiana | 10 | 661,365 | 51.73 | 10 | 587,446 | 45.95 | - | 6,588 | 0.52 | - | 3,325 | 0.26 | - | 73,919 | 5.78 | 42.75 | 1,278,439 | LA |
| Maine † | 2 | 232,279 | 48.07 | - | 236,320 | 48.91 | 2 | 10,874 | 2.25 | - | 10 | 0.00 | - | -4,041 | -0.84 | 22.14 | 483,208 | ME |
| Maine-1 | 1 | 123,598 | 47.90 | – | 127,019 | 49.22 | 1 | 6,025 | 2.33 | – | – | – | – | -3,421 | -1.32 | - | 250,617 | ME1 |
| Maine-2 | 1 | 108,681 | 48.27 | – | 109,301 | 48.54 | 1 | 4,849 | 2.15 | – | – | – | – | -620 | -0.27 | – | 217,982 | ME2 |
| Maryland | 10 | 759,612 | 53.04 | 10 | 672,661 | 46.96 | - | - | - | - | - | - | - | 86,951 | 6.07 | 29.97 | 1,432,273 | MD |
| Massachusetts | 14 | 1,429,475 | 56.11 | 14 | 1,030,276 | 40.44 | - | 65,637 | 2.58 | - | 135 | 0.01 | - | 399,199 | 15.67 | 6.70 | 2,547,557 | MA |
| Michigan | 21 | 1,696,714 | 46.44 | - | 1,893,742 | 51.83 | 21 | 47,905 | 1.31 | - | 5,406 | 0.15 | - | -197,028 | -5.39 | 9.00 | 3,653,749 | MI |
| Minnesota | 10 | 1,070,440 | 54.90 | 10 | 819,395 | 42.02 | - | 35,490 | 1.82 | - | 3,529 | 0.18 | - | 251,045 | 12.87 | 18.38 | 1,949,931 | MN |
| Mississippi | 7 | 381,309 | 49.56 | 7 | 366,846 | 47.68 | - | 4,074 | 0.53 | - | 2,787 | 0.36 | - | 14,463 | 1.88 | 60.45 | 769,360 | MS |
| Missouri | 12 | 998,387 | 51.10 | 12 | 927,443 | 47.47 | - | 24,029 | 1.23 | - | - | - | - | 70,944 | 3.63 | 28.22 | 1,953,600 | MO |
| Montana | 4 | 149,259 | 45.40 | - | 173,703 | 52.84 | 4 | - | - | - | - | - | - | -24,444 | -7.44 | 12.64 | 328,734 | MT |
| Nebraska | 5 | 233,692 | 38.46 | - | 359,705 | 59.19 | 5 | 9,409 | 1.55 | - | 1,482 | 0.24 | - | -126,013 | -20.74 | 20.26 | 607,668 | NE |
| Nevada | 3 | 92,479 | 45.81 | - | 101,273 | 50.17 | 3 | - | - | - | 1,519 | 0.75 | - | -8,794 | -4.36 | 23.00 | 201,876 | NV |
| New Hampshire | 4 | 147,635 | 43.47 | - | 185,935 | 54.75 | 4 | 4,095 | 1.21 | - | 936 | 0.28 | - | -38,300 | -11.28 | 17.84 | 339,618 | NH |
| New Jersey | 17 | 1,444,653 | 47.92 | - | 1,509,688 | 50.08 | 17 | 32,717 | 1.09 | - | 9,449 | 0.31 | - | -65,035 | -2.16 | 22.64 | 3,014,472 | NJ |
| New Mexico | 4 | 201,148 | 48.28 | - | 211,419 | 50.75 | 4 | - | - | - | 1,110 | 0.27 | - | -10,271 | -2.47 | 22.02 | 416,590 | NM |
| New York | 41 | 3,389,558 | 51.95 | 41 | 3,100,791 | 47.52 | - | 4,303 | 0.07 | - | 12,197 | 0.19 | - | 288,767 | 4.43 | 21.77 | 6,525,225 | NY |
| North Carolina | 13 | 927,365 | 55.27 | 13 | 741,960 | 44.22 | - | - | - | - | 2,219 | 0.13 | - | 185,405 | 11.05 | 51.63 | 1,677,906 | NC |
| North Dakota | 3 | 136,078 | 45.80 | - | 153,470 | 51.66 | 3 | 2,952 | 0.99 | - | 256 | 0.09 | - | -17,392 | -5.85 | 20.43 | 297,094 | ND |
| Ohio | 25 | 2,011,621 | 48.92 | 25 | 2,000,505 | 48.65 | - | 58,258 | 1.42 | - | 8,961 | 0.22 | - | 11,116 | 0.27 | 21.87 | 4,111,873 | OH |
| Oklahoma | 8 | 532,442 | 48.75 | - | 545,708 | 49.96 | 8 | 14,101 | 1.29 | - | - | - | - | -13,266 | -1.21 | 48.49 | 1,092,251 | OK |
| Oregon | 6 | 490,407 | 47.62 | - | 492,120 | 47.78 | 6 | 40,207 | 3.90 | - | - | - | - | -1,713 | -0.17 | 9.95 | 1,029,876 | OR |
| Pennsylvania | 27 | 2,328,677 | 50.40 | 27 | 2,205,604 | 47.73 | - | 50,584 | 1.09 | - | - | - | - | 123,073 | 2.66 | 22.64 | 4,620,787 | PA |
| Rhode Island | 4 | 227,636 | 55.36 | 4 | 181,249 | 44.08 | - | 479 | 0.12 | - | 715 | 0.17 | - | 46,387 | 11.28 | 17.47 | 411,170 | RI |
| South Carolina | 8 | 450,825 | 56.17 | 8 | 346,140 | 43.13 | - | - | - | - | - | - | - | 104,685 | 13.04 | 55.70 | 802,594 | SC |
| South Dakota | 4 | 147,068 | 48.91 | - | 151,505 | 50.39 | 4 | - | - | - | 1,619 | 0.54 | - | -4,437 | -1.48 | 7.15 | 300,678 | SD |
| Tennessee | 10 | 825,879 | 55.94 | 10 | 633,969 | 42.94 | - | 5,004 | 0.34 | - | 1,375 | 0.09 | - | 191,910 | 13.00 | 50.95 | 1,476,346 | TN |
| Texas | 26 | 2,082,319 | 51.14 | 26 | 1,953,300 | 47.97 | - | 20,118 | 0.49 | - | 263 | 0.01 | - | 129,019 | 3.17 | 36.13 | 4,071,884 | TX |
| Utah | 4 | 182,110 | 33.65 | - | 337,908 | 62.44 | 4 | 3,907 | 0.72 | - | 2,438 | 0.45 | - | -155,798 | -28.79 | 12.46 | 541,198 | UT |
| Vermont | 3 | 81,044 | 43.14 | - | 102,085 | 54.34 | 3 | 4,001 | 2.13 | - | 4 | 0.00 | - | -21,041 | -11.20 | 15.00 | 187,855 | VT |
| Virginia | 12 | 813,896 | 47.96 | - | 836,554 | 49.29 | 12 | - | - | - | 4,648 | 0.27 | - | -22,658 | -1.34 | 36.38 | 1,697,094 | VA |
| Washington | 9 | 717,323 | 46.11 | - | 777,732 | 50.00 | 8 | 36,986 | 2.38 | - | 5,042 | 0.32 | - | -60,409 | -3.88 | 14.40 | 1,555,534 | WA |
| West Virginia | 6 | 435,914 | 58.07 | 6 | 314,760 | 41.93 | - | - | - | - | - | - | - | 121,154 | 16.14 | 43.36 | 750,674 | WV |
| Wisconsin | 11 | 1,040,232 | 49.50 | 11 | 1,004,987 | 47.83 | - | 34,943 | 1.66 | - | 3,814 | 0.18 | - | 35,245 | 1.68 | 11.35 | 2,101,336 | WI |
| Wyoming | 3 | 62,239 | 39.81 | - | 92,717 | 59.30 | 3 | 624 | 0.40 | - | 89 | 0.06 | - | -30,478 | -19.49 | 19.05 | 156,343 | WY |
| TOTALS: | 538 | 40,831,881 | 50.08 | 297 | 39,148,634 | 48.02 | 240 | 740,460 | 0.91 | - | 172,557 | 0.21 | - | 1,683,247 | 2.06 | 25.21 | 81,531,584 | US |
Maine allowed its electoral votes to be split between candidates. Two electoral votes were awarded to the winner of the statewide race and one electoral vote to the winner of each congressional district. Ford won all four votes.[51]
States that flipped from Republican to Democratic[edit]
- Alabama
- Arkansas
- Delaware
- Florida
- Georgia
- Hawaii
- Kentucky
- Louisiana
- Maryland
- Minnesota
- Mississippi
- Missouri
- New York
- North Carolina
- Ohio
- Pennsylvania
- Rhode Island
- South Carolina
- Tennessee
- Texas
- West Virginia
- Wisconsin
Close states[edit]


States where margin of victory was under 1% (35 electoral votes):
- Oregon, 0.16% (1,713 votes)
- Ohio, 0.27% (11,116 votes)
- Maine's 2nd Congressional District, 0.28% (620 votes)
- Maine, 0.84% (4,041 votes)
States where margin of victory was under 5% (264 electoral votes):
- Iowa, 1.01% (12,932 votes)
- Oklahoma, 1.21% (13,266 votes)
- Virginia, 1.34% (22,658 votes)
- Maine's 1st Congressional District, 1.36% (3,421 votes)
- South Dakota, 1.48% (4,437 votes)
- Wisconsin, 1.68% (35,245 votes)(tipping point state)
- California, 1.78% (139,960 votes)
- Mississippi, 1.88% (14,463 votes)
- Illinois, 1.97% (92,974 votes)
- New Jersey, 2.16% (65,035 votes)
- New Mexico, 2.47% (10,271 votes)
- Hawaii, 2.53% (7,372 votes)
- Pennsylvania, 2.66% (123,073 votes)
- Texas, 3.17% (129,019 votes)
- Missouri, 3.63% (70,944 votes)
- Washington, 3.88% (60,409 votes)
- Nevada, 4.36% (8,794 votes)
- New York, 4.43% (288,767 votes)
States where margin of victory was more than 5%, but less than 10% (105 electoral votes):
- Connecticut, 5.16% (71,366 votes)
- Florida, 5.29% (166,469 votes)
- Michigan, 5.39% (197,028 votes)
- Delaware, 5.41% (12,765 votes)
- Louisiana, 5.78% (73,919 votes)
- North Dakota, 5.86% (17,392 votes)
- Maryland, 6.08% (86,951 votes)
- Kentucky, 7.18% (83,865 votes)
- Montana, 7.44% (24,444 votes)
- Kansas, 7.55% (72,331 votes)
- Indiana, 7.62% (169,244 votes)
Statistics[edit]
Counties with Highest Percent of Vote (Democratic)
- Banks County, Georgia87.85%
- Starr County, Texas87.25%
- Brantley County, Georgia86.50%
- Duval County, Texas86.36%
- Wilcox County, Georgia86.15%
Counties with Highest Percent of Vote (Republican)
- Jackson County, Kentucky79.80%
- Owsley County, Kentucky77.03%
- Hooker County, Nebraska76.35%
- Ottawa County, Michigan74.12%
- Arthur County, Nebraska73.66%
Voter demographics[edit]
| Social groups and the presidential vote, 1976 | ||||||
|---|---|---|---|---|---|---|
| Size[A 1] | Carter | Ford | ||||
| Party | ||||||
| Democratic | 43 | 77 | 22 | |||
| Independent | 23 | 43 | 54 | |||
| Republican | 28 | 9 | 90 | |||
| Ideology | ||||||
| Liberal | 18 | 70 | 26 | |||
| Moderate | 51 | 51 | 48 | |||
| Conservative | 31 | 29 | 69 | |||
| Ethnicity | ||||||
| Black | 10 | 82 | 16 | |||
| Hispanic | 2 | 74 | 24 | |||
| White | 88 | 47 | 51 | |||
| Gender | ||||||
| Female | 48 | 50 | 48 | |||
| Male | 52 | 50 | 48 | |||
| Religion | ||||||
| Protestant | 46 | 44 | 55 | |||
| White Protestant | 41 | 42 | 57 | |||
| Catholic | 25 | 54 | 44 | |||
| Jewish | 5 | 64 | 34 | |||
| Family income | ||||||
| Less than US$10,000 | 13 | 58 | 40 | |||
| $10,000–$14,999 | 15 | 55 | 43 | |||
| $15,000–$24,999 | 29 | 48 | 50 | |||
| $25,000–$50,000 | 24 | 36 | 62 | |||
| Over $50,000 | 5 | — | — | |||
| Occupation | ||||||
| Professionalormanager | 39 | 41 | 57 | |||
| Clerical,sales,white-collar | 11 | 46 | 53 | |||
| Blue-collar | 17 | 57 | 41 | |||
| Farmer | 3 | — | — | |||
| Unemployed | 3 | 65 | 34 | |||
| Education | ||||||
| Less thanhigh school | 11 | 58 | 39 | |||
| High school graduate | 28 | 54 | 44 | |||
| Somecollege | 28 | 50 | 49 | |||
| College graduate | 27 | 43 | 55 | |||
| Unionmembership | ||||||
| Labor union household | 28 | 59 | 39 | |||
| No member of household in union | 62 | 43 | 55 | |||
| Age | ||||||
| 18–21 years old | 6 | 48 | 49 | |||
| 22–29 years old | 17 | 51 | 46 | |||
| 30–44 years old | 31 | 49 | 49 | |||
| 45–59 years old | 23 | 48 | 51 | |||
| 60 years or older | 18 | 47 | 52 | |||
| Region | ||||||
| East | 25 | 51 | 47 | |||
| South | 27 | 54 | 45 | |||
| White South | 22 | 46 | 52 | |||
| Midwest | 27 | 48 | 50 | |||
| West | 19 | 46 | 51 | |||
| Community size | ||||||
| City over 250,000 | 18 | 58 | 40 | |||
| Suburb/small city | 53 | 51 | 47 | |||
| Rural/town | 29 | 47 | 51 | |||
Source:CBS News/New York Timesinterviews with 12,782 voters as they left the polls, as reported inThe New York Times,November 9, 1980, p. 28, and in further analysis. The 1976 data are from CBS News interviews.
- ^"Size" = share of 1980 national total.
See also[edit]
- Presidency of Jimmy Carter
- History of the United States (1964–1980)
- 1976 United States House of Representatives elections
- 1976 United States Senate elections
- 1976 United States gubernatorial elections
- Inauguration of Jimmy Carter
Notes[edit]
- ^A faithless Republican elector, Mike Padden in Washington, voted for Ronald Reagan to be president. Padden voted for Bob Dole to be vice president as pledged. As a result, Ford had 240 electoral votes instead of 241.
- ^abMike Padden,a Republicanfaithless electorfromWashington,gaveRonald Reaganone electoral vote.
- ^abThe running mate of McCarthy varied from state to state.
- ^Research has not yet determined whether Anderson's home state wasTennesseeorTexasat the time of the 1976 election.
References[edit]
- ^"National General Election VEP Turnout Rates, 1789-Present".United States Election Project.CQ Press.
- ^"1976 Ford Presidential Campaign - General Election".www.fordlibrarymuseum.gov.RetrievedJanuary 27,2024.
- ^Jackson, Harold (November 20, 2023)."Rosalynn Carter obituary".The Guardian.ISSN0261-3077.RetrievedJanuary 27,2024.
- ^https://guides.lib.jjay.cuny.edu/c.php?g=992251&p=7179351
- ^"The President and the Vice President have a complete understanding between them regarding the Vice President's decision. The letter speaks for itself. The initiative was the Vice President's"(PDF).Fordlibrarymuseum.gov.Archived(PDF)from the original on October 9, 2022.RetrievedMarch 4,2016.
- ^"1976 Presidential General Election Results".uselectionatlas.org.RetrievedJuly 24,2018.
- ^"Democrats Edge Ford, Reagan".Chicago Tribune.
- ^"Key Groups Giving Slip To Reagan".Chicago Tribune.
- ^ab"Two Democrats Ahead Of Ford".The Atlanta Constitution.
- ^Gallup, George(1972).The Gallup Poll: Public Opinion, 1972-1977.Vol. II. p. 668.
- ^Gallup, George(1972).The Gallup Poll: Public Opinion, 1972-1977.Vol. II. p. 674.
- ^Gallup, George(1972).The Gallup Poll: Public Opinion, 1972-1977.Vol. II. p. 678.
- ^Gallup, George(1972).The Gallup Poll: Public Opinion, 1972-1977.Vol. II. p. 745.
- ^Gallup, George(1972).The Gallup Poll: Public Opinion, 1972-1977.Vol. II. p. 758.
- ^"Carter's Well Ahead Of Both GOP Foes".Muncie Evening Press.
- ^Gallup, George(1972).The Gallup Poll: Public Opinion, 1972-1977.Vol. II. p. 774.
- ^Gallup, George(1972).The Gallup Poll: Public Opinion, 1972-1977.Vol. II. p. 795.
- ^"Carter Lead Over Ford Isn't Really That Huge".Asbury Park Press.
- ^Gallup, George(1972).The Gallup Poll: Public Opinion, 1972-1977.Vol. II. p. 802.
- ^ab"Ford, But Not Reagan, Moving Up On Carter".Chicago Tribune.
- ^Gallup, George(1972).The Gallup Poll: Public Opinion, 1972-1977.Vol. II. p. 815.
- ^"McCarthy Cuts Into Carter's Lead".Asbury Park Press.
- ^Gallup, George(1972).The Gallup Poll: Public Opinion, 1972-1977.Vol. II. p. 851.
- ^Gallup, George(1972).The Gallup Poll: Public Opinion, 1972-1977.Vol. II. p. 852.
- ^"Carter Ahead, But Ford Gaining".Lexington Herald-Leader.
- ^Gallup, George(1972).The Gallup Poll: Public Opinion, 1972-1977.Vol. II. p. 864.
- ^Gallup, George(1972).The Gallup Poll: Public Opinion, 1972-1977.Vol. II. p. 877.
- ^Gallup, George(1972).The Gallup Poll: Public Opinion, 1972-1977.Vol. II. p. 878.
- ^Gallup, George(1972).The Gallup Poll: Public Opinion, 1972-1977.Vol. II. p. 886.
- ^"Carter's Leading Ford, But..."The Ithaca Journal.
- ^Gallup, George(1972).The Gallup Poll: Public Opinion, 1972-1977.Vol. II. p. 894.
- ^"Harris Survey: Carter's Lead Shrinks To 45-44%".Pittsburgh Post-Gazette.
- ^Gallup, George(1972).The Gallup Poll: Public Opinion, 1972-1977.Vol. II. p. 900.
- ^"Survey: Carter Clings To One-Point Lead".Iowa City Press-Citizen.
- ^"Election of 1976: A Political Outsider Prevails".Archived from the original on August 2, 2003.RetrievedAugust 2,2003.
{{cite web}}:CS1 maint: unfit URL (link)C-SPAN. Retrieved on June 20, 2012. - ^"Commercials - 1976 - Essence".The Living Room Candidate.August 9, 1974. Archived fromthe originalon August 25, 2012.RetrievedMarch 4,2016.
- ^Frum, David(2000).How We Got Here: The '70s.New York, New York: Basic Books. pp.321–322.ISBN0-465-04195-7.
- ^Frum, David(2000).How We Got Here: The '70s.New York, New York: Basic Books. pp.321–322.ISBN0-465-04195-7.
- ^"Gerald Ford Retrospective".Gallup.December 29, 2006.RetrievedOctober 6,2019.
- ^Chapter three The Bicentennial election.ArchivedMay 2, 2017, at theWayback Machine
- ^"Debating Our Destiny: The Second 1976 Presidential Debate – October 6, 1976".Pbs.org. October 6, 1976.RetrievedJanuary 30,2016.
- ^"The First VP Debate: Dole-Mondale, 10-15-76".Janda.org.October 15, 1976.RetrievedMarch 4,2016.
- ^Bob Dole interview,November 10, 1999.PBS.org.
- ^abcde"CPD: 1976 Debates".www.debates.org.RetrievedJanuary 8,2019.
- ^"1976 Debates Overview".AllPolitics.CNN.1996.RetrievedApril 24,2019.
- ^"The Daily Diary of President Gerald R. Ford - October 22, 1976"(PDF).Gerald R. Ford Presidential Museum.Archived(PDF)from the original on October 9, 2022.RetrievedApril 24,2019.
- ^Jules Witcover.Marathon: The Pursuit of the Presidency, 1972–1976(New York: Viking), p. 11.
- ^Camden, Jim (December 17, 2016)."Electoral College wasn't done deal in 1976. Will it be in 2016?".The Spokesman-Review.RetrievedNovember 14,2021.
- ^Sullivan, Robert David;"How the Red and Blue Map Evolved Over the Past Century";America MagazineinThe National Catholic Review;June 29, 2016
- ^ab"1976 Presidential General Election Data - National".RetrievedMarch 18,2013.
- ^Barone, Michael; Matthews, Douglas; Ujifusa, Grant (1977).The Almanac of American Politics, 1978.E. P. Dutton.
Further reading[edit]
- Chester, Edward WA guide to political platforms(1977)online
- Johnstone, Andrew, and Andrew Priest, eds.US Presidential Elections and Foreign Policy: Candidates, Campaigns, and Global Politics from FDR to Bill Clinton(2017) pp 229–249.online
- MacDougall, Malcolm D.(1977).We Almost Made It.New York: Crown.ISBN0-517-52933-5.
- Roessner, Amber (2020).Jimmy Carter and the Birth of the Marathon Media Campaign.Baton Rouge, LA: Louisiana State University Press.ISBN978-0807170793.
- Shirley, Craig(2005).Reagan's Revolution: The Untold Story of the Campaign That Started It All.Nashville, Tennessee: Thomas Nelson.ISBN0-7852-6049-8.
- Williams, Daniel K.The Election of the Evangelical: Jimmy Carter, Gerald Ford, and the Presidential Contest of 1976(University Press of Kansas, 2020)online review
External links[edit]
- The Election Wall's 1976 Election Video Page
- 1976 popular vote by counties
- 1976 popular vote by states (with bar graphs)
- Campaign commercials from the 1976 election
- Election of 1976 in Counting the VotesArchivedMarch 4, 2016, at theWayback Machine

| |||||
| Life |  | ||||
| Elections |
| ||||
| Cultural depictions |
| ||||
| Legacy | |||||
| Family |
| ||||
| |||||||
| Life and politics |
| ||||||
| Presidency (timeline) |
| ||||||
| Speeches |
| ||||||
| Books | |||||||
| Elections |
| ||||||
| Cultural depictions |
| ||||||
| Legacy | |||||||
| Family | |||||||
| National | |
|---|---|
| Other | |