Westwood Power Station
| Westwood Power Station | |
|---|---|
 | |
| Country | England |
| Location | Greater Manchester,North West England |
| Coordinates | 53°32′18″N2°37′40″W/ 53.538197°N 2.627654°W |
| Status | Decommissioned and demolished |
| Construction began | 1948 |
| Commission date | 1950 |
| Decommission date | 1980s |
| Operator(s) | British Electricity Authority (1948–1955) Central Electricity Authority (1955–1957) Central Electricity Generating Board (1958–1989) |
| Thermal power station | |
| Primary fuel | Coal |
| Turbine technology | Steam turbine |
| Chimneys | 2 |
| Cooling towers | 2 |
| Cooling source | River water |
| Power generation | |
| Units decommissioned | All |
grid referenceSD585048 | |
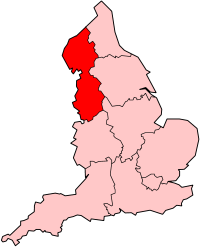
Westwood Power Stationwas acoal-fired power stationsituated adjacent to theLeeds and Liverpool CanalinInce-in-MakerfieldinGreater Manchester,North West England.
History[edit]
The station was constructed in 1948–50 by the British Electricity Authority. It used two 314 feet (96 m) tallcooling towersto cool its water.
The boiler plant comprised fiveBabcock & Wilcoxpulverised fuel fired boilers capable of delivering 1,425,000 lb/h (180.0 kg/s) of steam at 660psi(45.5bar) and 393 °C.[1]
Following the construction of the national grid in 1928-33 Westwood power station was connected to an electricity grid ring which included the power stations atSouthport,Lister Drive(Liverpool),WarringtonandRibble(Preston); this was one of three electricity rings in the North West.[2]
The generating capacity of the station was 128 MW comprising four upratedBritish Thomson-Houston32 MWturbo-alternators.The first generating set was commissioned in September 1951 followed by the other sets in December 1951, September 1952, and December 1953.[3]
Steam condensing and cooling was by two Mitchell reinforced concrete hyperbolic cooling towers, each tower had a capacity of 3 million gallons per hour (3.79 m3/s).
The generating capacity and output from Westwood power station is given in the following graph and table.[1][3][4][5]
Westwood power station electricity output, GWh
Graphs are unavailable due to technical issues. There is more info onPhabricatorand onMediaWiki.org. |
| Year | 1954 | 1955 | 1956 | 1957 | 1958 | 1961 | 1962 | 1963 | 1972 | 1979 | 1982 |
|---|---|---|---|---|---|---|---|---|---|---|---|
| Installed capacity, MW | 112 | 112 | 112 | 112 | 112 | 128 | 128 | 128 | 128 | 128 | 128 |
| Electricity output, GWh | 58.08 | 631.32 | 605.82 | 457.36 | 544.62 | 543.495 | 583.181 | 609.853 | 217.35 | 280.33 | 185.97 |
In the year ending 31 March 1972 the station's load factor (the average load as a per cent of maximum output capacity) was 20.6 per cent.[1]
The station was demolished in 1989, the cooling towers were demolished on 15 January 1989.[6][7]
Today[edit]
The former power station site has been developed intoWestwood business parkwith over 610,000 square feet (57,000 m2) of office space.[8]Another part of the site had been redeveloped into aGirobankoffice from the early 1990s until it was demolished in 2015 to make way for a 400,000 sqftNice-Pakwet-wipe factory.[9][10]
References[edit]
- ^abcCEGB (1972).CEGB Statistical Yearbook 1972.London: CEGB. p. 17.
- ^Hannah, Leslie (1979).Electricity before Nationalisation.London: Macmillan. p. 121.ISBN0333220862.
- ^abGarrett, Frederick C., ed. (1959).Garke's Manual of Electricity Supply vol. 56.London: Electrical Press. pp. A-107, A-138.
- ^CEGB (1979).CEGB Statistical Yearbook 1978-79.London: CEGB. p. 8.ISBN0902543598.
- ^CEGBAnnual report and Accounts,1961, 1962 & 1963
- ^"Westwood Power Station"(PHP).www.wiganworld.co.uk/.Retrieved8 March2009.
- ^"Explosive end for 330 ft cooling towers".The Times.16 January 1989.
- ^Green light for green business parkArchived24 March 2011 at theWayback Machine
- ^"Nice-Pak, Westwood Park, Wigan"(PDF).www.greenremediation.co.uk.
- ^New premises Pak-ing a punchWigan Today

