
Bristol County, Rhode Island
Bristol County | |
|---|---|
 Bristol County Courthouse in Bristol | |
 Location within the U.S. state ofRhode Island | |
 Rhode Island's location within theU.S. | |
| Coordinates:41°42′N71°17′W/ 41.70°N 71.28°W | |
| Country | |
| State | |
| Founded | 1747 |
| Named for | Bristol,England |
| Seat | Bristol |
| Largest town | Bristol |
| Area | |
| • Total | 45 sq mi (120 km2) |
| • Land | 24 sq mi (60 km2) |
| • Water | 21 sq mi (50 km2) 46% |
| Population (2020) | |
| • Total | 50,793 |
| • Density | 1,128.7/sq mi (435.8/km2) |
| Time zone | UTC−5(Eastern) |
| • Summer (DST) | UTC−4(EDT) |
| Congressional district | 1st |
Bristol Countyis acountylocated in theU.S. stateofRhode Island.As of the2020 census,the population was 50,793,[1]making it the least populous county in Rhode Island. In terms of land area, it is thethird-smallest county in the United States,at only 25 square miles (65 km2). The county was created in 1747 when it was separated fromBristol County, Massachusetts.[2]Bristol County is included in theProvidence-Warwick,RI-MAMetropolitan Statistical Area,which in turn constitutes a portion of the greater Boston-Worcester-Providence, MA-RI-NH-CTCombined Statistical Area.
History[edit]
The county was formed by the transfer of part ofBristol County, Massachusetts,to theColony of Rhode Islandin 1746, having been the subject of a long-running border dispute.[3]
The original county was part of thePlymouth Colonyand named after its "shire town" (county seat), what is nowBristol, Rhode Island.The new Rhode Island county was formed in 1746 with the full modern territory of Bristol, Barrington, and Warren.[4]
SeeBristol County, Massachusettsfor later land transfers between Massachusetts and Rhode Island.
Geography[edit]
According to theU.S. Census Bureau,the county has a total area of 45 square miles (120 km2), of which 24 square miles (62 km2) is land and 21 square miles (54 km2) (46%) is water.[5]It is the smallest county in Rhode Island. In land area only (water area omitted), it is the third-smallest county in the United States, followingKalawao County, HawaiiandNew York County, New York(Manhattan). The highest point in the county isMount Hope,inBristol,which stands 217 feet (66 m) above sea level.
Adjacent counties[edit]
- Bristol County, Massachusetts:east
- Providence County, Rhode Island:north
- Kent County, Rhode Island:west
- Newport County, Rhode Island:south
Demographics[edit]
| Census | Pop. | Note | %± |
|---|---|---|---|
| 1790 | 3,211 | — | |
| 1800 | 3,801 | 18.4% | |
| 1810 | 5,072 | 33.4% | |
| 1820 | 5,637 | 11.1% | |
| 1830 | 5,446 | −3.4% | |
| 1840 | 6,476 | 18.9% | |
| 1850 | 8,514 | 31.5% | |
| 1860 | 8,907 | 4.6% | |
| 1870 | 9,421 | 5.8% | |
| 1880 | 11,394 | 20.9% | |
| 1890 | 11,428 | 0.3% | |
| 1900 | 13,144 | 15.0% | |
| 1910 | 17,602 | 33.9% | |
| 1920 | 23,113 | 31.3% | |
| 1930 | 25,089 | 8.5% | |
| 1940 | 25,548 | 1.8% | |
| 1950 | 29,079 | 13.8% | |
| 1960 | 37,146 | 27.7% | |
| 1970 | 45,937 | 23.7% | |
| 1980 | 46,942 | 2.2% | |
| 1990 | 48,859 | 4.1% | |
| 2000 | 50,648 | 3.7% | |
| 2010 | 49,875 | −1.5% | |
| 2020 | 50,793 | 1.8% | |
| U.S. Decennial Census[6] 1790–1960[7]1900–1990[8] 1990–2000[9]2010–2019[10] | |||
2000 census[edit]
As of thecensus[11]of 2000, there were 50,648 people, 19,033 households, and 13,361 families living in the county. The population density was 2,052 inhabitants per square mile (792/km2). There were 19,881 housing units at an average density of 805 per square mile (311/km2). The racial makeup of the county was 96.81%White,0.69%BlackorAfrican American,0.16%Native American,1%Asian,0.03%Pacific Islander,0.3% fromother races,and 1.01% from two or more races. Of the population 1.13% wereHispanicorLatinoof any race. 24.7% were ofPortuguese,18.6%Italian,12.4%Irish,10.5%Englishand 5.9%Frenchancestry. 85.4% spokeEnglish,10.4%Portugueseand 1.3%Spanishas their first language. The United States Census Bureau reported Bristol County as being one of two counties in the United States with a plurality of people ofPortugueseancestry[12](the other being contiguousBristol County,Massachusetts).
There were 19,033 households, out of which 31.80% had children under the age of 18 living with them, 57.30% weremarried couplesliving together, 9.90% had a female householder with no husband present, and 29.80% were non-families. Of all households 25.10% were made up of individuals, and 11.20% had someone living alone who was 65 years of age or older. The average household size was 2.52 and the average family size was 3.04.
In the county, the population was spread out, with 22.90% under the age of 18, 9.50% from 18 to 24, 27.40% from 25 to 44, 23.40% from 45 to 64, and 16.70% who were 65 years of age or older. The median age was 39 years. For every 100 females, there were 93.10 males. For every 100 females age 18 and over, there were 89.50 males.
The median income for a household in the county was $50,737, and the median income for a family was $63,114. Males had a median income of $41,902 versus $28,985 for females. Theper capita incomefor the county was $26,503. About 4.40% of families and 6.30% of the population were below thepoverty line,including 6.20% of those under age 18 and 9.60% of those age 65 or over.
2010 census[edit]
As of the2010 United States Census,there were 49,875 people, 19,150 households, and 12,750 families living in the county.[13]The population density was 2,064.0 inhabitants per square mile (796.9/km2). There were 20,850 housing units at an average density of 862.8 per square mile (333.1/km2).[14]The racial makeup of the county was 95.7% white, 1.4% Asian, 0.8% black or African American, 0.2% American Indian, 0.4% from other races, and 1.5% from two or more races. Those of Hispanic or Latino origin made up 2.0% of the population.[13]The largest ancestry groups were:[15]
 24.8% Portuguese
 22.2% Irish
 21.0% Italian
 14.5% English
 9.8% French
 8.1% German
 4.4% French Canadian
 4.3% Polish
 2.9% Scottish
 2.7% American
 2.4% Swedish
 2.0% Scotch-Irish
 1.5% Greek
 1.4% Russian
Of the 19,150 households, 29.8% had children under the age of 18 living with them, 53.4% were married couples living together, 9.8% had a female householder with no husband present, 33.4% were non-families, and 27.4% of all households were made up of individuals. The average household size was 2.44 and the average family size was 2.99. The median age was 42.9 years.[13]
The median income for a household in the county was $68,333 and the median income for a family was $87,781. Males had a median income of $59,725 versus $44,060 for females. The per capita income for the county was $35,588. About 3.5% of families and 6.5% of the population were below thepoverty line,including 4.2% of those under age 18 and 5.4% of those age 65 or over.[16]
Politics[edit]
| Year | Republican | Democratic | Third party | |||
|---|---|---|---|---|---|---|
| No. | % | No. | % | No. | % | |
| 2020 | 9,745 | 34.30% | 18,050 | 63.52% | 620 | 2.18% |
| 2016 | 8,965 | 35.19% | 14,609 | 57.35% | 1,901 | 7.46% |
| 2012 | 9,231 | 37.41% | 14,974 | 60.68% | 471 | 1.91% |
| 2008 | 9,260 | 35.75% | 16,162 | 62.39% | 483 | 1.86% |
| 2004 | 9,855 | 39.85% | 14,448 | 58.42% | 429 | 1.73% |
| 2000 | 8,375 | 35.99% | 13,424 | 57.68% | 1,473 | 6.33% |
| 1996 | 6,988 | 32.25% | 12,257 | 56.56% | 2,426 | 11.19% |
| 1992 | 8,208 | 32.95% | 11,414 | 45.82% | 5,289 | 21.23% |
| 1988 | 10,626 | 48.56% | 11,168 | 51.04% | 89 | 0.41% |
| 1984 | 11,635 | 55.18% | 9,386 | 44.52% | 63 | 0.30% |
| 1980 | 8,508 | 38.93% | 9,851 | 45.08% | 3,493 | 15.98% |
| 1976 | 10,131 | 47.29% | 11,228 | 52.41% | 66 | 0.31% |
| 1972 | 12,009 | 54.62% | 9,928 | 45.16% | 48 | 0.22% |
| 1968 | 7,403 | 38.01% | 11,561 | 59.36% | 511 | 2.62% |
| 1964 | 4,466 | 23.79% | 14,306 | 76.21% | 0 | 0.00% |
| 1960 | 7,537 | 40.44% | 11,099 | 59.56% | 0 | 0.00% |
| 1956 | 10,070 | 59.88% | 6,748 | 40.12% | 0 | 0.00% |
| 1952 | 8,468 | 50.44% | 8,313 | 49.51% | 8 | 0.05% |
| 1948 | 5,343 | 41.16% | 7,562 | 58.25% | 77 | 0.59% |
| 1944 | 4,919 | 43.83% | 6,287 | 56.02% | 16 | 0.14% |
| 1940 | 5,314 | 47.09% | 5,967 | 52.88% | 3 | 0.03% |
| 1936 | 4,867 | 45.65% | 5,327 | 49.96% | 468 | 4.39% |
| 1932 | 3,833 | 44.04% | 4,775 | 54.87% | 95 | 1.09% |
| 1928 | 3,780 | 48.01% | 4,080 | 51.82% | 13 | 0.17% |
| 1924 | 4,076 | 60.57% | 2,500 | 37.15% | 153 | 2.27% |
| 1920 | 3,692 | 68.80% | 1,569 | 29.24% | 105 | 1.96% |
| 1916 | 1,574 | 53.54% | 1,292 | 43.95% | 74 | 2.52% |
| 1912 | 1,126 | 41.78% | 1,077 | 39.96% | 492 | 18.26% |
| 1908 | 1,606 | 61.79% | 899 | 34.59% | 94 | 3.62% |
| 1904 | 1,457 | 59.08% | 963 | 39.05% | 46 | 1.87% |
| 1900 | 1,273 | 61.20% | 727 | 34.95% | 80 | 3.85% |
| 1896 | 1,321 | 72.11% | 424 | 23.14% | 87 | 4.75% |
| 1892 | 1,107 | 53.09% | 905 | 43.41% | 73 | 3.50% |
| 1888 | 981 | 55.58% | 703 | 39.83% | 81 | 4.59% |
| 1884 | 987 | 57.25% | 654 | 37.94% | 83 | 4.81% |
| 1880 | 1,039 | 69.54% | 443 | 29.65% | 12 | 0.80% |
| 1864 | 780 | 63.47% | 449 | 36.53% | 0 | 0.00% |
| 1844 | 4,237 | 45.52% | 5,071 | 54.47% | 1 | 0.01% |
| 1840 | 3,792 | 46.39% | 4,382 | 53.61% | 0 | 0.00% |
Communities[edit]

The followingtownsare located in Bristol County:
- Barrington
- Bristol(traditional county seat)
- Warren
Education[edit]
There are two school districts in the county:Barrington School DistrictandBristol-Warren Regional School District.[18]
See also[edit]
References[edit]
- ^"Census - Geography Profile: Bristol County, Rhode Island".United States Census Bureau.RetrievedNovember 20,2021.
- ^"Rhode Island: Individual County Chronologies".Pennsylvania Atlas of Historical County Boundaries.The Newberry Library. 2009. Archived fromthe originalon July 25, 2015.RetrievedMarch 14,2015.
- ^"The Border is Where? Part II".The Rhode Islander: A depository of opinion, information, and pictures of the Ocean State.blogspot. 2007.RetrievedApril 3,2007.
- ^History of Bristol County, Massachusetts with Biographical Sketches of many of its Pioneers and Prominent Men, Part 1edited by Duane Hamilton Hurd. J.W. Lewis and Co., 1883. p. 1.
- ^"2010 Census Gazetteer Files".United States Census Bureau. August 22, 2012.RetrievedMarch 14,2015.
- ^"U.S. Decennial Census".United States Census Bureau.RetrievedMarch 14,2015.
- ^"Historical Census Browser".University of Virginia Library.RetrievedMarch 14,2015.
- ^Forstall, Richard L., ed. (March 27, 1995)."Population of Counties by Decennial Census: 1900 to 1990".United States Census Bureau.RetrievedMarch 14,2015.
- ^"Census 2000 PHC-T-4. Ranking Tables for Counties: 1990 and 2000"(PDF).United States Census Bureau. April 2, 2001.Archived(PDF)from the original on October 9, 2022.RetrievedMarch 14,2015.
- ^"State & County QuickFacts".United States Census Bureau. Archived fromthe originalon June 7, 2011.RetrievedNovember 22,2013.
- ^"U.S. Census website".United States Census Bureau.RetrievedMay 14,2011.
- ^"Census 2000 Brief - Ancestry"(PDF).Archived fromthe original(PDF)on September 20, 2004.RetrievedDecember 7,2017.
- ^abc"DP-1 Profile of General Population and Housing Characteristics: 2010 Demographic Profile Data".United States Census Bureau.Archived fromthe originalon February 13, 2020.RetrievedJanuary 12,2016.
- ^"Population, Housing Units, Area, and Density: 2010 - County".United States Census Bureau.Archived fromthe originalon February 13, 2020.RetrievedJanuary 12,2016.
- ^"DP02 SELECTED SOCIAL CHARACTERISTICS IN THE UNITED STATES – 2006-2010 American Community Survey 5-Year Estimates".United States Census Bureau.Archived fromthe originalon February 13, 2020.RetrievedJanuary 12,2016.
- ^"DP03 SELECTED ECONOMIC CHARACTERISTICS – 2006-2010 American Community Survey 5-Year Estimates".United States Census Bureau.Archived fromthe originalon February 13, 2020.RetrievedJanuary 12,2016.
- ^Leip, David."Dave Leip's Atlas of U.S. Presidential Elections".uselectionatlas.org.RetrievedJune 9,2018.
- ^"2020 CENSUS - SCHOOL DISTRICT REFERENCE MAP: Bristol County, RI"(PDF).U.S. Census Bureau.RetrievedJuly 22,2022.-Text list
Places adjacent to Bristol County, Rhode Island | ||||||||||||||||
|---|---|---|---|---|---|---|---|---|---|---|---|---|---|---|---|---|
| ||||||||||||||||
Municipalities and communities ofBristol County, Rhode Island,United States | ||
|---|---|---|
| Towns | 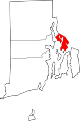 | |
| International | |
|---|---|
| National | |