
CumFreq
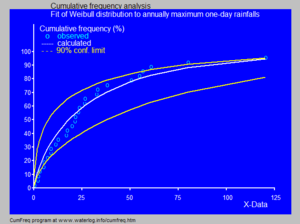 Example of output graph | |
| Developer(s) | Institute for Land Reclamation and Improvement (ILRI) |
|---|---|
| Written in | Delphi |
| Operating system | Microsoft Windows |
| Available in | English |
| Type | Statistical software |
| License | ProprietaryFreeware |
| Website | CumFreq |
Instatisticsanddata analysistheapplication softwareCumFreqis a tool forcumulative frequency analysisof asingle variableand forprobability distribution fitting.[1]
Originally the method was developed for the analysis ofhydrologicalmeasurements of spatially varying magnitudes (e.g.hydraulic conductivityof the soil) and of magnitudes varying in time (e.g. rainfall,river discharge) to find theirreturn periods.However, it can be used for many other types of phenomena, including those that containnegativevalues.
Software features
[edit]
CumFreq uses theplotting positionapproach to estimate thecumulative frequencyof each of the observed magnitudes in a data series of the variable.[2]
The computer program allows determination of the best fittingprobability distribution.Alternatively it provides the user with the option to select the probability distribution to be fitted. The following probability distributions are included:normal,lognormal,logistic,loglogistic,exponential,Cauchy,Fréchet,Gumbel,Pareto,Weibull,Generalized extreme value distribution,Laplace distribution,Burr distribution(Dagum mirrored),Dagum distribution(Burr mirrored),Gompertz distribution,Student distributionand other.
Another characteristic of CumFreq is that it provides the option to use two different probability distributions, one for the lower data range, and one for the higher. The ranges are separated by a break-point. The use of such composite (discontinuous) probability distributions can be useful when the data of the phenomenon studied were obtained under different conditions.[3]

During the input phase, the user can select the number of intervals needed to determine thehistogram.He may also define a threshold to obtain atruncated distribution.
The output section provides a calculator to facilitateinterpolationandextrapolation.
Further it gives the option to see theQ–Q plotin terms of calculated and observed cumulative frequencies.
ILRI[5]provides examples of application to magnitudes likecrop yield,watertable depth,soil salinity,hydraulic conductivity,rainfall, andriver discharge.
Generalizing distributions
[edit]The program can produce generalizations of the normal, logistic, and other distributions by transforming the data using anexponentthat isoptimizedto obtain thebest fit.
This feature is not common in other distribution-fitting software which normally include only a logarithmic transformation of data obtaining distributions like thelognormalandloglogistic.
Generalization of symmetrical distributions (like thenormaland thelogistic) makes them applicable to data obeying a distribution that is skewed to the right (using an exponent <1) as well as to data obeying a distribution that is skewed to the left (using an exponent >1). This enhances the versatility of symmetrical distributions.

Inverting distributions
[edit]Skew distributions can be mirrored bydistribution inversion(seesurvival function,orcomplementary distribution function) to change the skewness from positive to negative and vice versa. This amplifies the number of applicable distributions and increases the chance of finding a better fit. CumFreq makes use of that opportunity.
Shifting distributions
[edit]When negative data are present that are not supported by a probability distribution, the model performs adistribution shiftto the positive side while, after fitting, the distribution is shifted back.

Confidence belts
[edit]The software employs thebinomial distributionto determine theconfidence beltof the correspondingcumulative distribution function.[2]
The prediction of thereturn period,which is of interest intime series,is also accompanied by a confidence belt. The construction of confidence belts is not found in most other software.
The figure to the right shows the variation that may occur when obtaining samples of a variate that follows a certain probability distribution. The data were provided by Benson.[6]

Theconfidence beltaround an experimental cumulative frequency or return period curve gives an impression of the region in which the true distribution may be found.
Also, it clarifies that the experimentally found best fitting probability distribution may deviate from the true distribution.

Goodness of fit
[edit]Cumfreq produces a list of distributions ranked bygoodness of fit.
Histogram and density function
[edit]From thecumulative distribution function(CDF) one can derive ahistogramand theprobability density function(PDF).
Calculator
[edit]
The software offers the option to use a probability distribution calculator. The cumulative frequency and thereturn periodare give as a function of data value as input. In addition, the confidence intervals are shown. Reversely, the value is presented upon giving the cumulative frequency or the return period.
See also
[edit]References
[edit]- ^Independent online review of CumFreq:https:// predictiveanalyticstoday /cumfreq/
- ^abFrequency and Regression Analysis.Chapter 6 in: H.P.Ritzema (ed., 1994),Drainage Principles and Applications,Publ. 16, pp. 175–224, International Institute for Land Reclamation and Improvement (ILRI), Wageningen, The Netherlands.ISBN90-70754-33-9.Free download as PDF from:ILRI websiteor from:[1]
- ^Software for Generalized and Composite Probability Distributions.International Journal of Mathematical and Computational Methods, 4, 1-9. On line:[2]
- ^Intro to composite probability distributions
- ^Drainage research in farmers' fields: analysis of data,2002. Contribution to the project "Liquid Gold" of the International Institute for Land Reclamation and Improvement (ILRI), Wageningen, The Netherlands.[3]
- ^Benson, M.A. 1960. Characteristics of frequency curves based on a theoretical 1000 year record. In: T.Dalrymple (ed.), Flood frequency analysis. U.S. Geological Survey Water Supply paper 1543−A, pp. 51–71
- ^Software for probability distribution fitting