
Köppen climate classification
TheKöppen climate classificationis one of the most widely usedclimate classificationsystems. It was first published by German-RussianclimatologistWladimir Köppen(1846–1940) in 1884,[1][2]with several later modifications by Köppen, notably in 1918 and 1936.[3][4]Later, German climatologistRudolf Geiger(1894–1981) introduced some changes to the classification system in 1954 and 1961, which is thus sometimes called theKöppen–Geiger climate classification.[5][6]
The Köppen climate classification divides climates into five main climate groups, with each group being divided based on patterns of seasonal precipitation and temperature. The five main groups areA(tropical),B(arid),C(temperate),D(continental), andE(polar). Each group and subgroup is represented by a letter. All climates are assigned a main group (the first letter). All climates except for those in theEgroup are assigned a seasonal precipitation subgroup (the second letter). For example,Afindicates atropical rainforest climate.The system assigns a temperature subgroup for all groups other than those in theAgroup, indicated by the third letter for climates inB,C,D,and the second letter for climates inE.For example,Cfbindicates anoceanic climatewith warm summers as indicated by the endingb.Climates are classified based on specific criteria unique to each climate type.[7]
As Köppen designed the system based on his experience as a botanist, his main climate groups are based on the types of vegetation occurring in a given climate classification region. In addition to identifying climates, the system can be used to analyze ecosystem conditions and identify the main types of vegetation within climates. Due to its association with the plant life of a given region, the system is useful in predicting future changes of plant life within that region.[8]
The Köppen climate classification system was modified further within theTrewartha climate classificationsystem in 1966 (revised in 1980). The Trewartha system sought to create a more refinedmiddle latitudeclimate zone, which was one of the criticisms of the Köppen system (the climate group C was too general).[9]: 200–1

Overview[edit]
| 1st | 2nd | 3rd |
|---|---|---|
| A (Tropical) |
|
|
| B (Dry) |
|
|
| C (Temperate) |
|
|
| D (Continental) |
|
|
| E (Polar) |
|
The Köppen climate classification scheme divides climates into five main climate groups:A(tropical),B(arid),C(temperate),D(continental), andE(polar).[11]The second letter indicates the seasonal precipitation type, while the third letter indicates the level of heat.[12]Summers are defined as the six-month period that is warmer either from April to September and/or October to March, while winter is the six-month period that is cooler.[8][10]
Group A: Tropical climates[edit]
Tropical climateshave an average temperature of 18 °C (64.4 °F) or higher every month of the year, with significantprecipitation.[8][10]
- Af=Tropical rainforest climate;average precipitation of at least 60 mm (2.4 in) in every month.
- Am=Tropical monsoon climate;driest month (which nearly always occurs at or soon after the "winter" solstice for that side of the equator) with precipitation less than 60 mm (2.4 in), but at least.[8][10]
- AworAs= Tropical wet and dry orsavannaclimate; with the driest month having precipitation less than 60 mm (2.4 in) and less than.[8][10]

Group B: Desert and semi-arid climates[edit]
Desertandsemi-aridclimates are defined by low precipitation in a region that does not fit the polar (EF or ET) criteria of no month with an average temperature greater than 10 °C (50 °F).
The precipitation threshold in millimeters is determined by multiplying the average annual temperature inCelsiusby 20, then adding:
- 280 if 70% or more of the total precipitation is in the spring and summer months (April–September in the Northern Hemisphere, or October–March in the Southern), or
- 140 if 30%–70% of the total precipitation is received during the spring and summer, or
- 0 if less than 30% of the total precipitation is received during the spring and summer.
If the annual precipitation is less than 50% of this threshold, the classification is BW (arid: desert climate); if it is in the range of 50%–100% of the threshold, the classification is BS (semi-arid:steppe climate).[8][10]
A third letter can be included to indicate temperature. Here, h signifies low-latitude climates (average annual temperature above 18 °C (64.4 °F)) while k signifies middle-latitude climates (average annual temperature less than 18 °C). In addition, n is used to denote a climate characterized by frequent fog and H for high altitudes.[13][14][15]
Group C: Temperate climates[edit]
Temperate climateshave the coldest month averaging between 0 °C (32 °F)[10](or −3 °C (27 °F))[7]and 18 °C (64.4 °F) and at least one month averaging above 10 °C (50 °F).[10][7]For the distribution of precipitation in locations that both satisfy a dry summer (Cs) and a dry winter (Cw), a location is considered to have a wet summer (Cw) when more precipitation falls within the summer months than the winter months while a location is considered to have a dry summer (Cs) when more precipitation falls within the winter months.[10]This additional criterion applies to locations that satisfies both Ds and Dw as well.[10]
- Cfa=Humid subtropical climate;coldest month averaging above 0 °C (32 °F) (or −3 °C (27 °F)), at least one month's average temperature above 22 °C (71.6 °F), and at least four months averaging above 10 °C (50 °F). No significant precipitation difference between seasons (neither the abovementioned set of conditions fulfilled).
- Cfb= Temperateoceanic climateorsubtropical highland climate;coldest month averaging above 0 °C (32 °F) (or −3 °C (27 °F)), all months with average temperatures below 22 °C (71.6 °F), and at least four months averaging above 10 °C (50 °F). No significant precipitation difference between seasons (neither the abovementioned set of conditions fulfilled).
- Cfc=Subpolar oceanic climate;coldest month averaging above 0 °C (32 °F) (or −3 °C (27 °F)) and 1–3 months averaging above 10 °C (50 °F). No significant precipitation difference between seasons (neither the abovementioned set of conditions fulfilled).
- Cwa=Monsoon-influenced humid subtropical climate; coldest month averaging above 0 °C (32 °F) (or −3 °C (27 °F)), at least one month's average temperature above 22 °C (71.6 °F), and at least four months averaging above 10 °C (50 °F). At least ten times as much rain in the wettest month of summer as in the driest month of winter.
- Cwb=Subtropical highland climateor Monsoon-influenced temperate oceanic climate; coldest month averaging above 0 °C (32 °F) (or −3 °C (27 °F)), all months with average temperatures below 22 °C (71.6 °F), and at least four months averaging above 10 °C (50 °F). At least ten times as much rain in the wettest month of summer as in the driest month of winter.
- Cwc= Coldsubtropical highland climateor Monsoon-influenced subpolar oceanic climate; coldest month averaging above 0 °C (32 °F) (or −3 °C (27 °F)) and 1–3 months averaging above 10 °C (50 °F). At least ten times as much rain in the wettest month of summer as in the driest month of winter.
- Csa=Hot-summer Mediterranean climate;coldest month averaging above 0 °C (32 °F) (or −3 °C (27 °F)), at least one month's average temperature above 22 °C (71.6 °F), and at least four months averaging above 10 °C (50 °F). At least three times as much precipitation in the wettest month of winter as in the driest month of summer, and the driest month of summer receives less than 40 mm (1.6 in).[8]
- Csb=Warm-summer Mediterranean climate;coldest month averaging above 0 °C (32 °F) (or −3 °C (27 °F)), all months with average temperatures below 22 °C (71.6 °F), and at least four months averaging above 10 °C (50 °F). At least three times as much precipitation in the wettest month of winter as in the driest month of summer, and the driest month of summer receives less than 40 mm (1.6 in).[8]
- Csc=Cold-summer Mediterranean climate;coldest month averaging above 0 °C (32 °F) (or −3 °C (27 °F)) and 1–3 months averaging above 10 °C (50 °F). At least three times as much precipitation in the wettest month of winter as in the driest month of summer, and the driest month of summer receives less than 40 mm (1.6 in).[8]
Group D: Continental climates[edit]
Continental climateshave at least one month averaging below 0 °C (32 °F) (or −3 °C (27 °F)) and at least one month averaging above 10 °C (50 °F).[10][7]
- Dfa= Hot-summerhumid continental climate;coldest month averaging below 0 °C (32 °F) (or −3 °C (27 °F)), at least one month's average temperature above 22 °C (71.6 °F), and at least four months averaging above 10 °C (50 °F). No significant precipitation difference between seasons (neither the abovementioned set of conditions fulfilled).
- Dfb= Warm-summerhumid continental climate;coldest month averaging below 0 °C (32 °F) (or −3 °C (27 °F)), all months with average temperatures below 22 °C (71.6 °F), and at least four months averaging above 10 °C (50 °F). No significant precipitation difference between seasons (neither the abovementioned set of conditions fulfilled).
- Dfc=Subarctic climate;coldest month averaging below 0 °C (32 °F) (or −3 °C (27 °F)) and 1–3 months averaging above 10 °C (50 °F). No significant precipitation difference between seasons (neither the abovementioned set of conditions fulfilled).
- Dfd= Extremely cold subarctic climate; coldest month averaging below −38 °C (−36.4 °F) and 1–3 months averaging above 10 °C (50 °F). No significant precipitation difference between seasons (neither the abovementioned set of conditions fulfilled).
- Dwa= Monsoon-influenced hot-summer humid continental climate; coldest month averaging below 0 °C (32 °F) (or −3 °C (27 °F)), at least one month's average temperature above 22 °C (71.6 °F), and at least four months averaging above 10 °C (50 °F). At least ten times as much rain in the wettest month of summer as in the driest month of winter.
- Dwb= Monsoon-influenced warm-summer humid continental climate; coldest month averaging below 0 °C (32 °F) (or −3 °C (27 °F)), all months with average temperatures below 22 °C (71.6 °F), and at least four months averaging above 10 °C (50 °F). At least ten times as much rain in the wettest month of summer as in the driest month of winter.
- Dwc= Monsoon-influencedsubarctic climate;coldest month averaging below 0 °C (32 °F) (or −3 °C (27 °F)) and 1–3 months averaging above 10 °C (50 °F). At least ten times as much rain in the wettest month of summer as in the driest month of winter.
- Dwd= Monsoon-influenced extremely coldsubarctic climate;coldest month averaging below −38 °C (−36.4 °F) and 1–3 months averaging above 10 °C (50 °F). At least ten times as much rain in the wettest month of summer as in the driest month of winter.
- Dsa=Mediterranean-influenced hot-summer humid continental climate; coldest month averaging below 0 °C (32 °F) (or −3 °C (27 °F)), average temperature of the warmest month above 22 °C (71.6 °F) and at least four months averaging above 10 °C (50 °F). At least three times as much precipitation in the wettest month of winter as in the driest month of summer, and the driest month of summer receives less than 30 mm (1.2 in).
- Dsb= Mediterranean-influenced warm-summer humid continental climate; coldest month averaging below 0 °C (32 °F) (or −3 °C (27 °F)), average temperature of the warmest month below 22 °C (71.6 °F) and at least four months averaging above 10 °C (50 °F). At least three times as much precipitation in the wettest month of winter as in the driest month of summer, and the driest month of summer receives less than 30 mm (1.2 in).
- Dsc= Mediterranean-influenced subarctic climate; coldest month averaging below 0 °C (32 °F) (or −3 °C (27 °F)) and 1–3 months averaging above 10 °C (50 °F). At least three times as much precipitation in the wettest month of winter as in the driest month of summer, and the driest month of summer receives less than 30 mm (1.2 in).
- Dsd= Mediterranean-influenced extremely cold subarctic climate; coldest month averaging below −38 °C (−36.4 °F) and 1–3 months averaging above 10 °C (50 °F). At least three times as much precipitation in the wettest month of winter as in the driest month of summer, and the driest month of summer receives less than 30 mm (1.2 in).
Group E: Polar and alpine climates[edit]
Polarandalpine climateshas every month of the year with an average temperature below 10 °C (50 °F).[8][10]
- ET=Tundra climate;average temperature of warmest month between 0 °C (32 °F) and 10 °C (50 °F).[8][10]
- EF=Ice cap climate;eternal winter, with all 12 months of the year with average temperatures below 0 °C (32 °F).[8][10]
Group A: Tropical/megathermal climates[edit]

Tropical climatesare characterized by constant high temperatures (at sea level and low elevations); all 12 months of the year have average temperatures of 18 °C (64.4 °F) or higher; and generally high annual precipitation. They are subdivided as follows:
Af:Tropical rainforest climate[edit]
All 12 months have an average precipitation of at least 60 mm (2.4 in). These climates usually occur within 10° latitude of theequator.This climate has no natural seasons in terms of thermal and moisture changes.[9]When it is dominated most of the year by thedoldrumslow-pressure system due to the presence of theIntertropical Convergence Zone(ITCZ) and when there are no cyclones then the climate is qualified as equatorial. When the trade winds dominate most of the year, the climate is a tropical trade-wind rainforest climate.[16]
Examples
- Apia,Samoa (Af)
- Balikpapan,Indonesia (Af)
- Davao,Philippines (Af)
- Easter Island,Chile (Af)
- Fort Lauderdale, Florida,United States (Af,bordering onAm)
- Georgetown, Guyana(Af)
- Hilo, Hawaii,United States (Af)
- Honiara,Solomon Islands (Af)
- Innisfail, Queensland,Australia (Af)
- Iquitos,Peru (Af)
- Ishigaki,Japan (Af)
- Kampala,Uganda (Af)
- Kisumu, Kenya(Af)
- Kuala Lumpur,Malaysia (Af)
- Kuching,Malaysia (Af)
- La Ceiba,Honduras (Af)
- Lae,Papua New Guinea (Af)
- Manaus,Brazil (Af)
- Medan,Indonesia (Af)
- Medellín,Colombia (Af)
- Moroni, Comoros(Af)
- Pago Pago,American Samoa (Af)
- Paramaribo,Suriname (Af)
- Pontianak, Indonesia(Af)
- Port Vila,Vanuatu (Af)
- Quibdó,Colombia (Af)
- Ratnapura,Sri Lanka (Af)
- Salvador da Bahia,Brazil (Af)
- Santos,Brazil (Af)
- Singapore(Af)
- Suva,Fiji (Af)
- Toamasina,Madagascar (Af)
- Victoria, Seychelles(Af)
- Villa Tunari,Bolivia (Af)
Some of the places with this climate are indeed uniformly and monotonously wet throughout the year (e.g., the northwestPacificcoast ofSouthandCentral America,fromEcuadortoCosta Rica;see, for instance,Andagoya,Colombia), but in many cases, the period of higher sun and longer days is distinctly wettest (as atPalembang,Indonesia) or the time of lower sun and shorter days may have more rain (as atSitiawan,Malaysia). Among these places, some have a pure equatorial climate (Balikpapan, Kuala Lumpur, Kuching, Lae, Medan, Paramaribo, Pontianak, and Singapore) with the dominant ITCZ aerological mechanism and no cyclones or a subequatorial climate with occasional hurricanes (Davao, Ratnapura, Victoria).
(Note.The termaseasonalrefers to the lack in the tropical zone of large differences in daylight hours and mean monthly (or daily) temperature throughout the year. Annual cyclic changes occur in the tropics, but not as predictably as those in the temperate zone, albeit unrelated to temperature, but to water availability whether as rain, mist, soil, or groundwater. Plant response (e.g.,phenology), animal (feeding, migration, reproduction, etc.), and human activities (plant sowing, harvesting, hunting, fishing, etc.) are tuned to this 'seasonality'. Indeed, in tropical South America and Central America, the 'rainy season' (and the 'high water season') is calledinvierno(Spanish) orinverno(Portuguese), though it could occur in the Northern Hemisphere summer; likewise, the 'dry season (and 'low water season') is calledveranoorverão,and can occur in the Northern Hemisphere winter).
Am:Tropical monsoon climate[edit]
This type of climate results from themonsoonwinds which change direction according to the seasons. This climate has a driest month (which nearly always occurs at or soon after the "winter" solstice for that side of the equator) with rainfall less than 60 mm (2.4 in), but at leastof average monthly precipitation.[9]: 208
Examples
- Baguio,Philippines (Am,bordering onCwb)
- Cali,Colombia (Am)
- Cairns,Queensland, Australia (Am)[17]
- Chittagong, Bangladesh(Am)
- Coatzacoalcos,Veracruz, Mexico (Am)
- Conakry,Guinea (Am)
- Douala,Cameroon (Am)
- Freetown,Sierra Leone (Am)
- Guanare,Venezuela (Am)
- Huế,Thừa Thiên–Huế, Vietnam (Am)
- Jakarta,Indonesia (Am)
- Kochi,Kerala, India (Am)
- Ko Samui,Thailand (Am,bordering onAf)
- Libreville,Gabon (Am)
- Malabo,Equatorial Guinea (Am)
- Malé,Maldives (Am)
- Mangalore,Karnataka, India (Am)
- Miami,Florida, United States (Am)
- Monrovia,Liberia (Am)
- Phuntsholing,Bhutan (Am,bordering onCwa)[18]
- Port Harcourt,Rivers State, Nigeria (Am)
- Pucallpa,Peru (Am)
- Puerto Ayacucho,Venezuela (Am)
- Puerto Maldonado,Peru (Am)[19]
- Qionghai City,China (Am)[20]
- Recife,Pernambuco, Brazil (Am)
- San Juan, Puerto Rico(Am)
- Santo Domingo,Dominican Republic (Am)
- Taitung,Taiwan (Am)
- Thiruvananthapuram,Kerala, India (Am)
- Wenchang City,China (Am)[21]
- Yangon,Myanmar (Am)
- Zanzibar City,Tanzania (Am)
Aw/As:Tropical savanna climate[edit]
Aw:Tropical savanna climate with dry winters[edit]
Awclimates have a pronounced dry season, with the driest month having precipitation less than 60 mm (2.4 in) and less thanof average monthly precipitation.[9]: 208–211
Examples
- Abidjan,Ivory Coast(Aw)
- Abuja,Nigeria(Aw)
- Bamako,Mali(Aw)
- Bangkok,Thailand (Aw)
- Bangui,Central African Republic(Aw)
- Banjul,The Gambia(Aw)
- Barranquilla,Colombia (Aw)
- Brasília,Brazil(Aw)
- Brazzaville,Republic of the Congo(Aw)
- Bujumbura,Burundi(Aw)
- Cancún,Quintana Roo,Mexico(Aw,bordering onAm)
- Caracas,Venezuela (Aw)
- Cartagena, Colombia(Aw)
- Cotonou,Benin(Aw)
- Cuernavaca,Mexico(Aw,bordering onCwa)[22]
- Dar es Salaam,Tanzania (Aw)
- Darwin, Northern Territory,Australia (Aw)
- Dhaka,Bangladesh(Aw)
- Dili,East Timor(Aw)
- Dongfang,Hainan,China(Aw)
- Guatemala City,Guatemala(Aw,bordering onCwb)
- Guayaquil,Ecuador(Aw)
- Haikou,Hainan,China(Aw,bordering onCwa)[23]
- Havana,Cuba(Aw,bordering onAm)
- Ho Chi Minh City,Vietnam(Aw)
- Juba,South Sudan(Aw)
- Kano,Nigeria(Aw)
- Kaohsiung,Taiwan (Aw)
- Key West, Florida,United States (Aw)
- Kigali,Rwanda(Aw)
- Kingston,Jamaica(Aw)
- Kinshasa,Democratic Republic of Congo(Aw)
- Kolkata,West Bengal,India(Aw)
- Kumasi,Ghana(Aw)
- Kupang,Indonesia (Aw)
- Lagos,Nigeria(Aw)
- Lomé,Togo(Aw)
- Mengla,Yunnan,China(Aw)[23]
- Mumbai,Maharashtra,India(Aw)
- Naples, Florida,United States (Aw)
- Panamá City,Panamá(Aw)
- Phnom Penh,Cambodia(Aw)
- Port-au-Prince,Haiti(Aw)
- Port Moresby,Papua New Guinea (Aw)
- Port of Spain,Trinidad and Tobago(Aw)
- Rio de Janeiro,Brazil(Aw,bordering onAm)
- San Pedro Sula,Honduras (Aw,bordering onAm)
- San Salvador,El Salvador(Aw)
- Santa Cruz de la Sierra,Bolivia (Aw)
- Sanya,Hainan,China(Aw)
- Surabaya,Indonesia (Aw)
- Tegucigalpa,Honduras (Aw)
- Townsville,Queensland, Australia (Aw)
- Veracruz, Veracruz,Mexico(Aw)
- Vientiane,Laos(Aw)
- Yaoundé,Cameroon (Aw)
- Ziguinchor,Senegal(Aw)[24]
Most places that have this climate are found at the outer margins of thetropicalzone from the low teens to the mid-20s latitudes, but occasionally an inner-tropical location (e.g.,San Marcos, Antioquia,Colombia) also qualifies. TheCaribbeancoast, eastward from theGulf of Urabáon theColombia–Panamáborder to theOrinoco Riverdelta, on theAtlantic Ocean(about 4,000 km), have long dry periods (the extreme is theBShclimate (see below), characterized by very low, unreliable precipitation, present, for instance, in extensive areas in theGuajira,andCoro,westernVenezuela,the northernmost peninsulas in South America, which receive <300 mm total annual precipitation, practically all in two or three months).
This condition extends to theLesser AntillesandGreater Antillesforming the circum-Caribbean dry belt. The length and severity of the dry season diminish inland (southward); at the latitude of the Amazon River—which flows eastward, just south of theequatorialline—the climate isAf.East from theAndes,between the dry, arid Caribbean and the ever-wet Amazon are the Orinoco River'sLlanosorsavannas,from where this climate takes its name.
As:Tropical savanna climate with dry-summers[edit]
SometimesAsis used in place ofAwif the dry season occurs during the time of higher sun and longer days (during summer).[7][25]This is the case in parts ofHawaii,northwestern Dominican Republic, East Africa, southeast India and northeast Sri Lanka, and the Brazilian Northeastern Coast. In places that have this climate type, the dry season occurs during the time of lower sun and shorter days generally because ofrain shadoweffects during the 'high-sun' part of the year.
Examples
- Cape Coast,Ghana(As)
- Chennai,Tamil Nadu,India(As)
- Fortaleza,Brazil(As)
- Jaffna,Sri Lanka (As)
- Kapalua, Hawaii,United States (As)
- Lanai City, Hawaii,United States (As)
- Mombasa,Kenya(As)
- Monte Cristi,Dominican Republic (As)
- Natal, Rio Grande do Norte,Brazil(As)
- Nha Trang,Vietnam(As)
- São Tomé,São Tomé and Principe(As)
- Trincomalee,Sri Lanka (As)
Group B: Arid (desert and semi-arid) climates[edit]

These climates are characterized by the amount of annual precipitation less than a threshold value that approximates thepotential evapotranspiration.[9]: 212 The threshold value (in millimeters) is calculated as follows:
Multiply the average annual temperature in °C by 20, then add
- 280 if 70% or more of the total precipitation is in the high-sun half of the year (April through September in the Northern Hemisphere, or October through March in the Southern), or
- 140 if 30%–70% of the total precipitation is received during the applicable period, or
- 0 if less than 30% of the total precipitation is so received.
According to the modified Köppen classification system used by modern climatologists, total precipitation in the warmest six months of the year is taken as a reference instead of the total precipitation in the high-sun half of the year.[26]
If the annual precipitation is less than 50% of this threshold, the classification isBW(arid:desert climate); if it is in the range of 50%–100% of the threshold, the classification isBS(semi-arid:steppe climate).
A third letter can be included to indicate temperature. Here,hsignifies low-latitude climate (average annual temperature above 18 °C) whileksignified middle-latitude climate (average annual temperature below 18 °C).
Desert areas situated along the west coasts of continents at tropical or near-tropical locations characterized byfrequent fogand low clouds, although these places rank among the driest on earth in terms of actual precipitation received, can be labeledBWnwith the n denoting a climate characterized by frequent fog.[13][14][15]An equivalentBSncategory can be found in foggy coastal steppes.[27]
BW:Arid climates[edit]
BWh:Hot deserts[edit]
- ʽAziziya,Jafara,Libya(BWh)
- Ahvaz,Khuzestan,Iran(BWh)
- Alexandria,Egypt(BWh)
- Alice Springs,Australia (BWh)
- Almería,Andalusia, Spain (BWh,bordering onBSh)
- Arica,Chile (BWh)
- Baghdad,Iraq(BWh)
- Biskra,Algeria(BWh)[28]
- Cairo,Egypt(BWh)
- Coober Pedy,Australia (BWh)
- Death Valley,California, United States (BWh), location of the hottest air temperature ever reliably recorded on Earth
- Djibouti City,Djibouti(BWh)
- Doha,Qatar(BWh)
- Dubai,United Arab Emirates(BWh)
- Eilat,Southern District,Israel(BWh)
- Fuerteventura,Canary Islands, Spain (BWh)[29]
- Hermosillo,Sonora,Mexico(BWh)
- Jodhpur,Rajasthan,India(BWh)
- Karachi,Pakistan(BWh)
- Khartoum,Sudan(BWh)
- Kuwait City,Kuwait(BWh)
- Lanzarote,Canary Islands, Spain (BWh)[30]
- Las Vegas,Nevada,United States(BWh)
- Lima,Peru (BWh)
- Mecca,Makkah Region,Saudi Arabia(BWh)
- Muscat,Oman(BWh)
- Nouakchott,Mauritania(BWh)
- Phoenix,Arizona,United States(BWh)
- Punto Fijo,Venezuela (BWh)
- Qom,Iran(BWh)
- Riyadh,Saudi Arabia(BWh)
- Timbuktu,Mali(BWh)
- Upington,Northern Cape,South Africa(BWh)
- Yazd,Iran(BWh)
BWk:Cold deserts[edit]
- Albuquerque,New Mexico,United States(BWk,bordering onBSk)
- Antofagasta,Chile (BWk)
- Aral,Kazakhstan(BWk)
- Ashgabat,Turkmenistan(BWk)
- Baku,Azerbaijan(BWk,bordering onBSk)
- Ciudad Juárez,Chihuahua,Mexico(BWk,bordering onBWh)
- Damascus,Syria(BWk)
- Isfahan,Iran(BWk)
- Kerman,Iran(BWk)
- Leh,India(BWk)
- Lorca, Spain(BWk)[31]
- Neuquén,Argentina(BWk)
- Nukus,Karakalpakstan,Uzbekistan(BWk)
- Ölgii,Mongolia(BWk)[32]
- Saint George,Utah,United States(BWk,bordering onBWh)
- San Juan,Argentina(BWk,bordering onBWh)
- Sanaa,Yemen(BWk,bordering onBSk)
- Tabernas, Spain(BWk,bordering onBWh)[33]
- Turpan,Xin gian g,China(BWk)
- Walvis Bay,Erongo Region,Namibia(BWk)
- Yakima,Washington,United States(BWk,bordering onBSk)
BS:Semi-arid (steppe) climates[edit]
BSh:Hot semi-arid[edit]
- Accra,Ghana(BSh,bordering onAw)
- Alicante, Spain(BSh)
- Barquisimeto,Venezuela (BSh)
- Bushehr,Iran(BSh)
- Coimbatore,Tamil Nadu,India(BSh)
- Dakar,Senegal(BSh)
- Dezful,Iran(BSh)
- Gaborone,Botswana(BSh)
- Honolulu,Hawaii,United States(BSh)
- Kimberley, Northern Cape,South Africa(BSh)
- Kurnool,Andhra Pradesh,India(BSh)
- Lahore,Punjab,Pakistan(BSh,bordering onCwa)
- Lampedusa,Sicily,Italy(BSh)
- Los Angeles, California,United States(BSh)
- Luanda,Angola(BSh)
- Malakal,South Sudan(BSh)
- Mandalay,Myanmar (BSh,bordering onAw)
- Maputo,Mozambique(BSh)
- Maracaibo,Venezuela (BSh)
- Marrakesh,Morocco(BSh)
- Mogadishu,Somalia(BSh)
- Monterrey,Mexico(BSh,bordering onCwa)[34][35]
- Mosul,Nineveh,Iraq(BSh,bordering onCsa)[36]
- Mount Isa,Queensland, Australia (BSh)
- Murcia,Spain (BSh)
- N'Djamena,Chad(BSh)
- Nicosia,Cyprus(BSh)
- Odessa,Texas,United States(BSh)
- Oranjestad,Aruba(BSh)
- Ouagadougou,Burkina Faso(BSh)
- Patos,Paraíba,Brazil(BSh)
- Petrolina,Pernambuco, Brazil (BSh)
- Piraeus,Greece(BSh)
- Port Louis,Mauritius(BSh)
- Querétaro City,Querétaro,Mexico(BSh)
- Santiago del Estero,Argentina(BSh)[37]
- Saveh,Iran(BSh)
- Toliara,Madagascar (BSh)
- Tripoli,Libya(BSh)
- Valencia,Spain (BSh)[38]
- Windhoek,Namibia(BSh)
BSk:Cold semi-arid[edit]
- Albacete,Spain (BSk)[39]
- Aleppo,Syria(BSk)
- Alexandra,New Zealand(BSk,bordering onCfb)
- Asmara,Eritrea(BSk)
- Astrakhan,Russia(BSk)
- Batna,Algeria(BSk)[40]
- Bloemfontein,South Africa(BSk)[41]
- Boise,Idaho,United States(BSk)
- Cochabamba,Bolivia (BSk)[42]
- Comodoro Rivadavia,Argentina(BSk)
- Daraa,Syria(BSk,bordering onBSh)[43]
- Denver,Colorado,United States(BSk)
- Kabul,Afghanistan(BSk)
- Kalgoorlie,Western Australia, Australia (BSk)
- Kamloops,British Columbia,Canada(BSk)
- Karaj,Iran(BSk)
- Konya,Turkey(BSk)
- L'Agulhas,Western Cape,South Africa(BSk)
- La Quiaca,Jujuy,Argentina(BSk)
- Madrid,Spain (BSk)[44]
- Mashhad,Iran(BSk)
- Mildura,Victoria, Australia (BSk,bordering onBSh)
- Polokwane,Limpopo,South Africa(BSk,bordering onBSh)
- Quetta,Pakistan(BSk)
- Reno,Nevada,United States(BSk)
- Santiago,Chile (BSk)
- Saskatoon,Saskatchewan,Canada(BSk,bordering onDfb)
- Shijiazhuang,Hebei,China(BSk)
- Sulina,Romania(BSk)[45]
- Tehran,Iran(BSk)
- Tianjin,China(BSk,bordering onDwa)
- Ulaanbaatar,Mongolia(BSk,bordering onDwbandDwc)
- Ulan-Ude,Russia(BSk)
- Yerevan,Armenia(BSk,bordering onDfa)
- Zacatecas City,Zacatecas,Mexico(BSk)
- Zaragoza, Spain(BSk)
Group C: Temperate/mesothermal climates[edit]

In the Köppen climate system, temperate climates are defined as having an average temperature above 0 °C (32 °F) (or −3 °C (26.6 °F), as noted previously) in their coldest month but below 18 °C (64.4 °F). The average temperature of −3 °C (26.6 °F) roughly coincides with the equatorward limit of frozen ground and snow cover lasting for a month or more.
The second letter indicates the precipitation pattern—windicates dry winters (driest winter month average precipitation less than one-tenth wettest summer month average precipitation).sindicates at least three times as much rain in the wettest month of winter as in the driest month of summer.fmeans significant precipitation in all seasons (neither above-mentioned set of conditions fulfilled).[8]
The third letter indicates the degree of summer heat—aindicates warmest month average temperature above 22 °C (71.6 °F) whilebindicates warmest month averaging below 22 °C but with at least four months averaging above 10 °C (50.0 °F), andcindicates one to three months averaging above 10 °C (50.0 °F).[8][10][7]
Cs:Mediterranean-type climates[edit]
Csa:Hot-summer Mediterranean climates[edit]
These climates usually occur on the western sides of continents between the latitudes of 30° and 45°.[46]These climates are in the polar front region in winter, and thus have moderate temperatures and changeable, rainy weather. Summers are hot and dry, due to the domination of the subtropical high-pressure systems, except in the immediate coastal areas, where summers are milder due to the nearby presence of cold ocean currents that may bringfogbut prevent rain.[9]: 221–223
Examples
- Adelaide,Australia (Csa)
- Algiers,Algeria(Csa)
- Amman,Jordan(Csa,bordering onBSh)
- Antalya,Turkey(Csa)
- Athens,Greece(Csa,bordering onBSh)
- Barcelona,Spain (Csa,bordering onCfa)
- Beirut,Lebanon(Csa)
- Casablanca,Morocco(Csa)
- Dushanbe,Tajikistan(Csa)
- Faro,Portugal(Csa)
- Homs,Syria(Csa)[47]
- Ilam,Iran(Csa)[48]
- Irbid,Jordan(Csa)[49]
- İzmir,Turkey(Csa)
- Jerusalem,Israel(Csa)
- Kardzhali,Bulgaria (Csa,bordering onCfa)[50]
- Kermanshah,Iran(Csa)
- Latakia,Syria(Csa)
- Lisbon,Portugal(Csa)
- Marseille,France(Csa)
- Menorca,Balearic Islands, Spain (Csa)
- Mersin,Turkey(Csa)
- Monaco(Csa)
- Naples,Italy(Csa,bordering onCfa)
- Nice,France(Csa)
- Perth,Australia (Csa)
- Rome,Italy(Csa)
- Sacramento, California,United States(Csa)
- Seville,Spain (Csa)
- Shkodër,Albania(Csa,bordering onCfa)
- Tangier,Morocco(Csa)
- Tashkent,Uzbekistan(Csa,bordering onBSk)
- Tecate,Baja California,Mexico(Csa)
- Tel Aviv,Israel(Csa)
- Tlemcen,Algeria(Csa)[51]
- Tunis,Tunisia(Csa)
- Valletta,Malta(Csa)
- Vatican City(Csa)
Csb:Warm-summer Mediterranean climates[edit]
Dry-summer climates sometimes extend to additional areas where the warmest month average temperatures do not reach 22 °C (71.6 °F). These climates are classified asCsb.[8]
Examples
- Albany, Western Australia,Australia (Csb)
- Aluminé,Neuquén Province,Argentina(Csb)
- Balmaceda, Chile(Csb,bordering onCsc)
- Bayda,Libya(Csb)
- Cape Town,South Africa(Csb,bordering onCsa)
- Concepción, Chile(Csb)
- Guarda,Portugal(Csb)
- Korçë,Albania(Csb,bordering onDsb)[52][53]
- León, Spain(Csb)[54]
- Linares, Chile(Csb)
- Mount Gambier, South Australia,Australia (Csb)
- Nakuru,Kenya(Csb)
- Nanaimo,British Columbia,Canada(Csb)
- Ohrid,North Macedonia(Csb)
- Portland,Oregon,United States(Csb)
- Porto,Portugal(Csb)
- Rieti,Italy(Csb)
- Salamanca,Spain (Csb)
- San Carlos de Bariloche,Argentina(Csb)
- San Cristóbal de la Laguna,Spain (Csb)
- San Francisco,California, United States (Csb)
- Seattle,United States (Csb)
- Sintra,Portugal(Csb)
- Victoria,British Columbia,Canada(Csb)
Csc:Cold-summer Mediterranean climates[edit]
Cold summer Mediterranean climates (Csc) exist in high-elevation areas adjacent to coastalCsbclimate areas, where the strong maritime influence prevents the average winter monthly temperature from dropping below 0 °C. This climate is rare and is predominantly found in climate fringes and isolated areas of the Cascades and Andes Mountains, as the dry-summer climate extends further poleward in the Americas than elsewhere.[9]Rare instances of this climate can be found in some coastal locations in the North Atlantic and at high altitudes in Hawaii.
Examples
- Akureyri,Iceland(Csc), alternatively: dry-summer subarctic climate (Dsc)
- HaleakalāSummit,Hawaii,United States (Csc)
- Harstad,Norway(Csc), alternatively: dry-summer subarctic climate (Dsc)
- Liawenee,Australia (Csc,bordering onCfcandCfb)
- Røst,Norway(Csc,bordering onCfc)
- Spirit Lake,Washington, United States (Csc), alternatively: dry-summer subarctic climate (Dsc)
Cfa:Humid subtropical climates[edit]
These climates usually occur on the eastern coasts and eastern sides of continents, usually in the high 20s and 30s latitudes. Unlike the dry summer Mediterranean climates, humid subtropical climates have a warm and wet flow from the tropics that creates warm and moist conditions in the summer months. As such, summer (not winter as is the case in Mediterranean climates) is often the wettest season.
The flow out of the subtropical highs and the summer monsoon creates a southerly flow from the tropics that brings warm and moist air to the lower east sides of continents. This flow is often what brings the frequent and strong but short-lived summer thundershowers so typical of the more southerly subtropical climates like the southeast United States, southern China, and Japan.[9]: 223–226
Examples
- Asunción,Paraguay(Cfa,bordering onAw)
- Atlanta,Georgia,United States(Cfa)
- Bandar-e Anzali,Gilan,Iran(Cfa)
- Belgrade,Serbia(Cfa)
- Bologna,Italy(Cfa)
- Bratislava,Slovakia(Cfa,bordering onCfb/Dfa/Dfb)
- Brisbane,Australia (Cfa)
- Budapest,Hungary(Cfa,bordering onDfa)
- Buenos Aires,Argentina(Cfa)
- Chongqing,China(Cfa,bordering onCwa)
- Dallas,Texas,United States(Cfa)
- Durban,KwaZulu-Natal,South Africa(Cfa)
- Edirne,Turkey(Cfa,bordering onCsa)[55]
- Florianópolis,Santa Catarina,Brazil(Cfa)
- Girona,Spain (Cfa,bordering onCsa)[56]
- Huesca,Spain (Cfa)
- Ijevan,Tavush,Armenia(Cfa,bordering onDfa)[57]
- Jeju,South Korea(Cfa)
- Juan Fernández Islands,Chile (Cfa,bordering onCfb/Csa/Csb)
- Kozani,Greece(Cfa)[58]
- Krasnodar,Russia(Cfa,bordering onDfa)
- La Plata,Argentina(Cfa)
- Lugano,Ticino,Switzerland(Cfa,bordering onCfb)
- Lyon,France(Cfa,bordering onCfb)
- Matamoros,Tamaulipas,Mexico(Cfa,bordering onAw)
- Milan,Italy(Cfa)
- Montevideo,Uruguay(Cfa)
- New York City, New York,United States(Cfa,bordering onDfa)
- Odesa,Ukraine(Cfa,bordering onDfaandBSk)
- Osaka,Japan (Cfa)
- Porto Alegre,Rio Grande do Sul,Brazil(Cfa)
- Prizren,Kosovo(Cfa,bordering onDfaandCfb)[59]
- Qabala,Azerbaijan(Cfa,bordering onDfaandDfb)
- Rasht,Gilan,Iran(Cfa)
- Rosario,Argentina(Cfa,bordering onCwa)
- Samsun,Turkey(Cfa)
- San Marino(Cfa)
- São Paulo,Brazil(Cfa,bordering onCwa)
- Sari,Mazandaran,Iran(Cfa,bordering onCsa)
- Shanghai,China(Cfa)
- Sochi,Russia(Cfa)
- Split,Croatia(Cfa,bordering onCsa)
- Srinagar,India(Cfa)
- Sydney,Australia (Cfa)
- Taipei,Taiwan (Cfa)
- Tbilisi,Georgia(Cfa)
- Tirana,Albania(Cfa)
- Tokyo,Japan (Cfa)
- Toulouse,France(Cfa)
- Ulsan,South Korea(Cfa)
- Varna, Bulgaria(Cfa)
- Venice,Italy(Cfa)
- Wuhan,China(Cfa)
- Yokohama,Japan (Cfa)
- Zaqatala,Azerbaijan(Cfa)[60]
- Zonguldak,Turkey(Cfa,bordering onCfb)
Cfb:Oceanic climates[edit]
Marine west coast climate[edit]
Cfbclimates usually occur in the higher middle latitudes on the western sides of continents between the latitudes of 40° and 60°; they are typically situated immediately poleward of the Mediterranean climates. However, in southeast Australia, southeast South America, and extreme southern Africa this climate is found immediately poleward of temperate climates, on places near the coast and at a somewhat lower latitude. In western Europe, this climate occurs in coastal areas up to 68°N in Norway.
These climates are dominated all year round by the polar front, leading to changeable, often overcast weather. Summers are mild due to cool ocean currents. Winters are milder than other climates in similar latitudes, but usually very cloudy, and frequently wet.Cfbclimates are also encountered at high elevations in certain subtropical and tropical areas, where the climate would be that of a subtropical/tropical rainforest if not for the altitude. These climates are called "highlands".[9]: 226–229
Examples
- Amsterdam,North Holland,Netherlands(Cfb)
- Artvin,Turkey(Cfb,bordering onCfa/Csa/Csb)[61]
- Auckland,New Zealand(Cfb)
- Belfast,Northern Ireland,United Kingdom(Cfb)
- Bergen,Vestland,Norway(Cfb)
- Berlin,Germany(Cfb)
- Bern,Switzerland(Cfb,bordering onDfb)
- Bilbao,Spain (Cfb)
- Block Island,Rhode Island,United States(Cfb,bordering onDfb)
- Bordeaux,France(Cfb,bordering onCfa)
- Brussels,Belgium(Cfb)
- Caransebeş,Romania(Cfb,bordering onDfb)
- Cetinje,Montenegro(Cfb,bordering onDfb)
- Christchurch,New Zealand(Cfb)
- Copenhagen,Denmark(Cfb)
- Corvo Island,Azores,Portugal(Cfb,bordering onCfa)
- Dublin,Ireland(Cfb)
- Forks, Washington,United States(Cfb)
- Frankfurt,Hesse,Germany(Cfb)
- George,Western Cape,South Africa(Cfb)
- Gdynia,Poland(Cfb)
- Glasgow,Scotland,United Kingdom(Cfb)
- Hobart,Tasmania, Australia (Cfb)
- Ketchikan,Alaska,United States(Cfb)
- Ljubljana,Slovenia(Cfb)
- London,England,United Kingdom(Cfb)
- Luxembourg City,Luxembourg(Cfb)
- Malmö,Sweden(Cfb)
- Mar del Plata,Argentina(Cfb)
- Melbourne,Victoria, Australia (Cfb,bordering onCfa)
- Munich,Bavaria,Germany(Cfb,bordering onDfb)
- Ørland,Trøndelag,Norway(Cfb)
- Osorno,Los Lagos Region, Chile (Cfb)
- Paris,France(Cfb)
- Port Elizabeth,South Africa(Cfb)
- Prague,Czech Republic(Cfb,bordering onDfb)
- Prince Rupert,British Columbia,Canada(Cfb)
- Puerto Montt,Los Lagos Region, Chile (Cfb)
- Punta del Este,Uruguay(Cfb,bordering onCfa)
- Santander, Spain(Cfb)
- Santiago de Compostela,Spain (Cfb)
- Sarajevo,Bosnia and Herzegovina(Cfb,bordering onDfb)
- Skagen,Denmark(Cfb)
- Szombathely,Hungary(Cfb,bordering onDfb)[62]
- Vaduz,Liechtenstein(Cfb)
- Valdivia,Los Ríos Region, Chile (Cfb)
- Vancouver,British Columbia,Canada(Cfb,bordering onCsb)
- Vienna,Austria(Cfb)
- Villa La Angostura,Neuquén Province,Argentina(Cfb)
- Wellington,New Zealand(Cfb)
- Wollongong,New South Wales, Australia (Cfb,bordering onCfa)
- Zagreb,Croatia(Cfb,bordering onDfb)
- Zürich,Switzerland(Cfb,bordering onDfb)
Subtropical highland climate with uniform rainfall[edit]
Subtropical highland climates with uniform rainfall (Cfb) are a type of oceanic climate mainly found in the highlands ofAustralia,such as in or around theGreat Dividing Rangein the north of the state ofNew South Wales,and also sparsely in other continents, such as inSouth America,among others. Unlike a typicalCwbclimate, they tend to have rainfall spread evenly throughout the year. They have characteristics of both theCfbandCfaclimates, but unlike these climates, they have a highdiurnal temperature variationand low humidity, owing to their inland location and relatively highelevation.
Examples
- Aetomilitsa,Greece(Cfb,bordering onDfb)
- Bogotá,Colombia (Cfb)
- Boone,North Carolina,United States(Cfb,bordering onDfb)
- Cameron Highlands,Malaysia (Cfb)
- Chachapoyas, Peru(Cfb)
- Cobán,Guatemala(Cfb)
- Constanza, Dominican Republic(Cfb)
- Cuenca,Ecuador(Cfb)
- Curitiba,Paraná,Brazil(Cfb)
- Eldoret,Kenya(Cfb)
- Goris,Syunik,Armenia(Cfb,bordering onDfb)
- Hengshan,China(Cfb,bordering onCfa/Dfa/Dfb)
- Kabale,Uganda (Cfb)
- Kodaikanal,India(Cfb)
- Le Tampon,Réunion,France(Cfb)
- Lithgow, New South Wales,Australia (Cfb)
- Manizales,Colombia (Cfb)
- Maseru,Lesotho(Cfb,bordering onCwb)
- Mérida,Venezuela (Cfb,bordering onCwbandAm)
- Mthatha,South Africa(Cfb)
- Nuwara Eliya,Sri Lanka (Cfb)
- Quito,Pichincha,Ecuador(Cfb)
- Sa Pa,Vietnam(Cfb)
- Soria,Spain (Cfb)
- Teresópolis,Rio de Janeiro,Brazil(Cfb)
- Trevico,Italy(Cfb)[63]
- Xalapa,Veracruz, Mexico (Cfb,bordering onCfa)
Cfc:Subpolar oceanic climate[edit]
Subpolar oceanic climates (Cfc) occur poleward of or at higher elevations than the maritime temperate climates and are mostly confined either to narrow coastal strips on the western poleward margins of the continents, or, especially in the Northern Hemisphere, to islands off such coasts. They occur in both hemispheres, most often at latitudes from 60° north and south to 70° north and south.[9]
Examples
- Auckland Islands,New Zealand(Cfc)
- Karlsøy,Norway(Cfc)
- Miena, Tasmania,Australia (Cfc)
- Perisher Valley,New South Wales,Australia (Cfc,bordering onDfcandCfb)
- Punta Arenas,Chile (Cfc,bordering onET)
- Reykjavík,Iceland(Cfc)
- Río Grande,Tierra del Fuego,Argentina(Cfc)
- Tórshavn,Faroe Islands(Cfc)
- Unalaska,Alaska,United States(Cfc)
- Ushuaia,Tierra del Fuego,Argentina(Cfc,bordering onET)
Cw:Dry-winter subtropical climates[edit]
Cwa:Dry-winter humid subtropical climate[edit]
Main entry:Subtropical monsoon climate
Cwais a monsoonal influenced version of thehumid subtropical climate,having the classic dry winter–wet summer pattern associated with tropical monsoonal climates. They are found at similar latitudes as theCfaclimates, except in regions where monsoons are more prevalent. These regions are in theSouthern Coneof South America, theGangetic Plainof South Asia, southeastern Africa, and parts of East Asia and Mexico.
Examples
- Antananarivo,Madagascar (Cwa,bordering onCwb)
- Busan,South Korea(Cwa)
- Chengdu,Sichuan,China(Cwa)
- Córdoba,Argentina(Cwa)
- Delhi,India(Cwa,bordering onBSh)
- Guadalajara,Jalisco,Mexico(Cwa)
- Guangzhou,Guangdong,China(Cwa)[64]
- Guwahati,India(Cwa)
- Hanoi,Vietnam(Cwa)
- Hong Kong(Cwa)
- Islamabad,Pakistan(Cwa)
- Kathmandu,Nepal(Cwa)
- Lilongwe,Malawi(Cwa)
- Lubumbashi,Democratic Republic of Congo(Cwa)
- Lucknow,Uttar Pradesh,India(Cwa)
- Lusaka,Zambia(Cwa)
- Macau(Cwa)
- Mackay, Queensland,Australia (Cwa)
- Pretoria,Gauteng,South Africa(Cwa)
- Rangpur,Bangladesh(Cwa)
- Sialkot,Pakistan(Cwa)
- Siguatepeque,Honduras (Cwa)
- Taunggyi,Myanmar (Cwa)
- Tucumán,Argentina(Cwa)
- Yeosu,South Korea(Cwa)
- Zapopan,Mexico(Cwa)
- Zhengzhou,Henan,China(Cwa)
Cwb:Dry-winter subtropical highland climate[edit]
Dry-winter subtropical highland climate (Cwb) is a type of climate mainly found in highlands inside the tropics ofCentral America,South America,Africa,andSouthandSoutheast Asiaor areas in the subtropics. Winters are noticeable and dry, and summers can be very rainy. In the tropics, the monsoon is provoked by the tropical air masses and the dry winters by subtropical high pressure.
Examples
- Addis Ababa,Ethiopia(Cwb)
- Arusha,Tanzania (Cwb)
- Atok,Philippines (Cwb)
- Cajamarca,Peru (Cwb)
- Cherrapunji,India(Cwb)
- Cusco,Peru (Cwb)
- Da Lat,Vietnam(Cwb)
- Dali City,China(Cwb)
- Diamantina,Brazil(Cwb)
- Gangtok,India(Cwb)
- Hakha,Myanmar (Cwb)
- Harare,Zimbabwe(Cwb)
- Huaraz,Peru (Cwb)
- Johannesburg,South Africa(Cwb)
- Kunming,China(Cwb)
- Lhasa,Tibet Autonomous Region,China(Cwb,bordering onDwbandBSk)
- Lukla,Nepal(Cwb)
- Mbabane,Eswatini(Cwb)
- Mexico City,Mexico(Cwb)
- Mokhotlong,Lesotho(Cwb)
- Nairobi,Kenya(Cwb)
- Ooty,India(Cwb)
- Phongsali,Laos(Cwb)
- Quetzaltenango,Guatemala(Cwb)
- Salta,Argentina(Cwb)
- Shimla,India(Cwb)
- Thimphu,Bhutan (Cwb,bordering onCwa)
Cwc:Dry-winter cold subtropical highland climate[edit]
Dry-winter cold subtropical highland climates (Cwc) exist in high-elevation areas adjacent toCwbclimates. This climate is rare and is found mainly in isolated locations mostly in the Andes in Bolivia and Peru, as well as in sparse mountain locations in Southeast Asia.
- El Alto,Bolivia (Cwc,bordering onET)
- Juliaca,Peru (Cwc,bordering onET)
- La Paz,Bolivia (Cwc,bordering onET)
- Mount Pulag,Philippines (Cwc,bordering onETandCwb)
- Potosí,Bolivia (Cwc,bordering onET)
Group D: Continental/microthermal climates[edit]


These climates have an average temperature above 10 °C (50 °F) in their warmest months, and the coldest month average below 0 °C (or −3 °C (27 °F), as noted previously). These usually occur in the interiors of continents and on their upper east coasts, normally north of 40°N. In the Southern Hemisphere, group D climates are extremely rare due to the smaller land masses in the middle latitudes and the almost complete absence of land at 40–60°S, existing only in some highland locations.
Dfa/Dwa/Dsa:Hot summer humid continental climates[edit]
Dfaclimates usually occur in the high 30s and low 40s latitudes, with a qualifying average temperature in the warmest month of greater than 22 °C (72 °F). In Europe, these climates tend to be much drier than in North America.Dsaexists at higher elevations adjacent to areas with hot summer Mediterranean (Csa) climates.[9]: 231–32
These climates exist only in the northern hemisphere because the southern hemisphere has no large landmasses isolated from the moderating effects of the sea within the middle latitudes.
Examples
- Almaty,Kazakhstan(Dfa)
- Boston,Massachusetts,United States(Dfa,bordering onCfa)
- Bucharest,Romania(Dfa,bordering onCfa)
- Cheonan,South Korea(Dfa,bordering onDwa)
- Chicago,Illinois,United States(Dfa)
- Chișinău,Moldova(Dfa)
- Dnipro,Ukraine(Dfa,bordering onDfb)
- Hamilton, Ontario,Canada(Dfa,bordering onDfb)
- Minneapolis,Minnesota,United States(Dfa)
- Rostov-on-Don,Russia(Dfa)
- Sapporo,Japan (Dfa,bordering onDfb)
- Saratov,Russia(Dfa)[65]
- Toronto,Ontario,Canada(Dfa,bordering onDfb)
- Urmia,Iran(Dfa,bordering onBSk)
- Ürümqi,Xin gian g,China(Dfa,bordering onBSk)
- Volgograd,Russia(Dfa)[66]
- Windsor,Ontario,Canada(Dfa)
In eastern Asia,Dwaclimates extend further south into the mid-30s latitudes due to the influence of the Siberian high-pressure system, which also causes winters there to be dry, and summers can be very wet because ofmonsooncirculation.
Examples
- Beijing,China(Dwa,bordering onBSk)
- Blagoveshchensk,Amur Oblast,Russia(Dwa,bordering onDwb)[67]
- Chuncheon,Gangwon Province,South Korea(Dwa)
- Harbin,China(Dwa)
- Incheon,South Korea(Dwa)
- North Platte,Nebraska,United States(Dwa,bordering onDfaandBSk)
- Pyongyang,North Korea(Dwa)
- Seoul,South Korea(Dwa)
- Shenyang,China(Dwa)
Dsaexists only at higher elevations adjacent to areas with hot summer Mediterranean (Csa) climates.
Examples
- Arak,Iran(Dsa)
- Bishkek,Kyrgyzstan(Dsa)
- Cambridge,Idaho,United States(Dsa)
- Fayzabad,Badakhshan,Afghanistan(Dsa,bordering onCsa)[68]
- Hakkâri,Turkey(Dsa)
- Hamedan,Iran(Dsa)
- Muş,Turkey(Dsa)
- Salt Lake City,Utah,United States(Dsa,bordering onCsa)
- Saqqez,Iran(Dsa)
- Shymkent,Kazakhstan(Dsa,bordering onCsa)
Dfb/Dwb/Dsb:Warm summer humid continental/hemiboreal climates[edit]
Dfbclimates are immediately poleward of hot summer continental climates, generally in the high 40s and low 50s latitudes in North America and Asia, and also extending to higher latitudes in central and eastern Europe and Russia, between the maritime temperate and continental subarctic climates, where it extends up to 65 degrees latitude in places.[9]
Examples
- Akhaltsikhe,Georgia(Dfb)
- Ardebil,Iran(Dfb,bordering onBSk)
- Ardahan,Turkey(Dfb)
- Briceni,Moldova(Dfb)[69]
- Chamonix,France(Dfb)
- Cluj-Napoca,Romania(Dfb)
- Cortina d'Ampezzo,Italy(Dfb)
- Debrecen,Hungary(Dfb,bordering onDfa,CfaandCfb)
- Edmonton,Alberta,Canada(Dfb)
- Erzurum,Turkey(Dfb)
- Fairbanks,Alaska,United States(Dfb,bordering onDfc)
- Falls Creek, Victoria,Australia (Dfb,bordering onDfcandCfb)
- Gyumri,Shirak,Armenia(Dfb)
- Helsinki,Finland(Dfb)
- Imilchil,Morocco(Dfb,bordering onCfb)
- Karaganda,Kazakhstan(Dfb)
- Klagenfurt,Austria(Dfb)
- Košice,Slovakia(Dfb)
- Kushiro, Hokkaido,Japan (Dfb)
- Kyiv,Ukraine(Dfb)
- Lillehammer,Norway(Dfb)
- Marquette,Michigan,United States(Dfb)
- Miercurea Ciuc,Romania(Dfb)
- Minsk,Belarus(Dfb)
- Montreal, Quebec,Canada(Dfb)
- Moscow,Russia(Dfb)
- Mouthe,France(Dfb)
- Mutsu, Aomori,Japan(Dfb,bordering onCfb)
- Novosibirsk,Russia(Dfb)
- Oslo,Norway(Dfb)
- Ottawa,Ontario,Canada(Dfb)
- Portland,Maine,United States(Dfb)
- Pristina,Kosovo(Dfb,bordering onCfbandCfa)
- Riga,Latvia(Dfb)
- Saint Petersburg,Russia(Dfb)
- Stockholm,Sweden(Dfb)
- Sofia,Bulgaria(Dfb,bordering onCfb)
- Tallinn,Estonia(Dfb)
- Tampere,Finland(Dfb,bordering onDfc)
- Toblach,Italy(Dfb)[70]
- Vilnius,Lithuania(Dfb)
- Warsaw,Poland(Dfb,bordering onCfb)
Like with all Group D climates,Dwbclimates mostly only occur in the northern hemisphere.
Examples
- Baruunturuun,Mongolia(Dwb)
- Calgary,Alberta,Canada(Dwb,bordering onDfbandBSk)
- Heihe,Heilong gian g,China(Dwb)
- Irkutsk,Russia(Dwb,bordering onDwc)
- Pembina,North Dakota,United States(Dwb,bordering onDfb)
- Pyeongchang,South Korea(Dwb)
- Vladivostok,Primorsky krai,Russia(Dwb)
- Yanji,Jilin,China(Dwb)
Dsbarises from the same scenario asDsa,but at even higher altitudes or latitudes, and chiefly in North America, since the Mediterranean climates extend further poleward than in Eurasia.
Examples
- Abali,Iran(Dsb)[71]
- Castlegar,British Columbia,Canada(Dsb,bordering onDfb)
- Chaghcharan,Ghor,Afghanistan(Dsb)
- Dras,India(Dsb)
- Flagstaff,Arizona,United States(Dsb,bordering onCsb)
- Jermuk,Vyots Dzor,Armenia(Dsb,bordering onDfb)[72]
- Puente del Inca,Argentina(Dsb,bordering onCsb)
- Puerto de Navacerrada,Spain (Dsb)[73]
- Roghun,Tajikistan(Dsb)
- Sewell,O'Higgins Region, Chile (Dsb,bordering onDsc)
- Sivas,Turkey(Dsb)
- South Lake Tahoe, California,United States(Dsb,bordering onCsb)
- Spokane, Washington,United States(Dsb,bordering onDsaandCsb)
Dfc/Dwc/Dsc:Subarctic/boreal climates[edit]
Dfc,DscandDwcclimates occur poleward of the other group D climates, or at higher altitudes, generally in the 50s and 60s latitudes.[9]: 232–235
Examples:
- Alta,Norway(Dfc)
- Anadyr,Chukotka,Russia(Dfc)
- Anchorage,Alaska,United States(Dfc,bordering onDfb)
- Arkhangelsk,Russia(Dfc)
- Bodie, California,United States(Dsc,bordering onDsb)
- Charlotte Pass, New South Wales,Australia (Dfc)
- Delta Junction,Alaska,United States(Dwc,bordering onBSk)
- Feldberg,Baden-Württemberg,Germany(Dfc)
- Fraser,Colorado,United States(Dfc)
- Inukjuak,Quebec,Canada(Dsc,bordering onET)
- Kangerlussuaq,Greenland,Denmark(Dfc,bordering onETandBSk)
- Livigno,Italy(Dfc)
- Luleå,Sweden(Dfc)
- Lysá hora,Czech Republic(Dfc)[74]
- Mohe,Heilong gian g,China(Dwc)
- Nagqu,Tibet,China(Dwc,bordering onET)
- Narsarsuaq,Greenland,Denmark(Dfc,bordering onET)
- Norilsk,Russia(Dfc)
- Nyurba,Russia(Dsc,bordering onDfc)
- Oulu,Finland(Dfc,bordering onDfb)
- Paganella,Italy(Dfc,bordering onDwc and ET)
- Røros,Norway(Dfc)
- Saint Pierre and Miquelon,France(Dfc,bordering onDfb)
- Soldotna, Alaska,United States(Dsc)
- St. Moritz,Grisons,Switzerland(Dfc)
- Štrbské Pleso,Slovakia(Dfc)[75]
- Thompson,Manitoba,Canada(Dfc)
- Tromsø,Norway(Dfc)
- Tsetserleg,Arkhangai Province,Mongolia(Dwc)[76]
- Whitehorse,Yukon,Canada(Dfc)
- Yellowknife,Northwest Territories,Canada(Dfc)
- Yushu City,Qinghai,China(Dwc)
Dfd/Dwd/Dsd:Subarctic/boreal climates with severe winters[edit]
Places with this climate have severe winters, with the temperature in their coldest month lower than −38 °C. These climates occur only in easternSiberia.The names of some of the places with this climate have become veritable synonyms for the extreme, severe winter cold.[77]
Examples
- Allakh-Yun,Sakha Republic,Russia(Dwd)
- Delyankir,Sakha Republic,Russia(Dwd)
- Khonuu,Sakha Republic,Russia(Dfd)
- Okhotsky-Perevoz,Sakha Republic,Russia(Dfd)
- Oymyakon,Sakha Republic,Russia(Dfd)
- Verkhoyansk,Sakha Republic,Russia(Dsd)
Group E: Polar climates[edit]

In the Köppen climate system, polar climates are defined as the warmest temperature of any month being below 10 °C (50 °F). Polar climates are further divided into two types, tundra climates and icecap climates:
ET:Tundra climate[edit]
Tundra climate(ET): warmest month has an average temperature between 0 and 10 °C. These climates occur on the northern edges of the North American and Eurasian land masses (generally north of 70 °N although they may be found farther south depending on local conditions), and on nearby islands.ETclimates are also found on some islands near the Antarctic Convergence, and at high elevations outside the polar regions, above the tree line.
Examples
- Alert,Nunavut,Canada(ET,bordering onEF)
- Ben Nevis,Scotland,United Kingdom(ET)
- Cairn Gorm,Scotland,United Kingdom(ET)
- Campbell Island,New Zealand(ET)
- Cerro de Pasco,Peru (ET)[78]
- Crozet Islands(ET)
- Dikson Island,Russia(ET)
- Esperanza Base,Antarctica(ET)
- Finse,Norway(ET)
- Ilulissat,Greenland,Denmark(ET)
- Iqaluit,Nunavut,Canada(ET)
- Ísafjörður,Iceland(ET,bordering onCsc)
- Ittoqqortoormiit,Greenland,Denmark(ET)
- Jade Dragon Snow Mountain,China(ET,bordering onEF)
- Jungfraujoch,Switzerland(ET)
- Kasprowy Wierch,Poland(ET)
- Kerguelen Islands(ET)
- Lomnický štít,Prešov Region,Slovakia(ET)[79]
- Macquarie Island,Australia (ET)
- Mauna Loa(slopes),Hawaii,United States(ET,bordering onCscandCfc)
- Mount Apo,Philippines (ET,bordering onCfc)
- Mount Fuji,Japan (ET)
- Mount Rainier(slopes),Washington,United States(ET)
- Mount Washington,New Hampshire,United States(ET,bordering onDfc)
- Mount Wellington, Tasmania,Australia (ET)
- Murghab,Tajikistan(ET)
- Musala,Bulgaria (ET)[80]
- Mykines,Faroe Islands(ET,bordering onCfc)
- Mys Shmidta,Russia(ET)
- North Salang,Afghanistan(ET,bordering onDsc)
- Novaya Zemlya,Arkhangelsk Oblast,Russia(ET)
- Nuuk,Greenland,Denmark(ET)
- Phari,China(ET)
- Prince Edwards Islands(ET)
- Puerto Williams,Chile (ET,bordering onCfc)
- Sněžka,Czech Republic(ET,bordering onDfc)
- Sonnblick,Austria(ET)[81]
- Stanley,Falkland Islands(ET,bordering onCfc)
- Svalbard,Norway(ET)
- Trepalle,Italy(ET)
- Yu Shan,Taiwan (ET)
- Zugspitze,Bavaria,Germany(ET)
EF:Ice cap climate[edit]
Ice cap climate(EF): this climate is dominant in Antarctica, inner Greenland, and summits of many high mountains, even at lower latitudes. Monthly average temperatures never exceed 0 °C (32 °F).
Examples
- Aconcagua,Chile/Argentina (EF)
- Amundsen–Scott Station,Antarctica(EF)
- Byrd Station,Antarctica(EF)
- Chimborazo,Ecuador(EF)
- Concordia Station,Antarctica(EF)
- Denali,Alaska,United States(EF)
- Dome Fuji,Antarctica(EF)
- Huascarán,Peru (EF)
- Ismoil Somoni Peak,Tajikistan(EF)
- Jengish Chokusu,China/Kyrgyzstan(EF)
- K2,China/Pakistan(EF)
- Kangchenjunga,India/Nepal(EF)
- Kilimanjaro,Tanzania (EF)
- Lhotse,Nepal(EF)
- Makalu,Nepal/China(EF)
- McMurdo Station,Antarctica(EF)
- Mount Ararat,Turkey(EF)
- Mount Everest,China/Nepal(EF)
- Mount Logan,Canada(EF)
- Mount Rainier(summit),Washington,United States(EF)
- Ojos del Salado,Chile (EF)
- Pico de Orizaba,Mexico(EF)
- Plateau Station,Antarctica(EF)
- Puncak Jaya,Indonesia (EF,bordering onET)
- Sajama,Bolivia (EF)
- Scott Base,Antarctica(EF)
- Showa Station,Antarctica(EF)
- Summit Camp,Greenland,Denmark(EF)
- Ushakov Island,Russia(EF)
- Vostok Station,Antarctica(EF)
Ecological significance[edit]
Biomass[edit]
The Köppen climate classification is based on the empirical relationship between climate and vegetation. This classification provides an efficient way to describe climatic conditions defined by temperature and precipitation and their seasonality with a single metric. Because climatic conditions identified by the Köppen classification are ecologically relevant, it has been widely used to map the geographic distribution of long-term climate and associated ecosystem conditions.[82]
Climate change[edit]
Over recent years, there has been an increasing interest in using the classification to identify changes in climate and potential changes in vegetation over time.[12]The most important ecological significance of the Köppen climate classification is that it helps to predict the dominant vegetation type based on the climatic data and vice versa.[83]
In 2015, aNanjing Universitypaper published inScientific Reportsanalyzing climate classifications found that between 1950 and 2010, approximately 5.7% of all land area worldwide had moved from wetter and colder classifications to drier and hotter classifications. The authors also found that the change "cannot be explained as natural variations but are driven by anthropogenic factors".[84]
A 2018 study provides detailed maps for present and future Köppen-Geiger climate classification maps at 1-km resolution.[85]
Other Köppen climate maps[edit]
All maps use the ≥0 °C definition for the temperate-continental border.[8]
-
 North America
 -
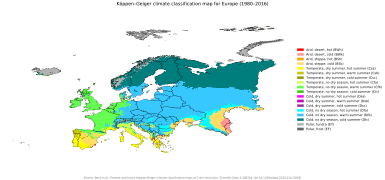 Europe
 -
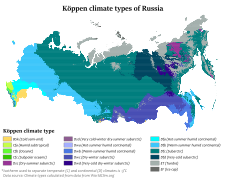 Russia
 -
 Central Asia
 -
 East Asia
 -
 South America
 -
 Africa
 -
 Western Asia
 -
 South Asia
 -
 Southeast Asia
 -
 Melanesia/Oceania
 -
 Australia
 -
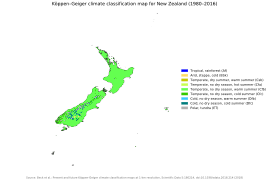 New Zealand
 -
 World (Present)
 -
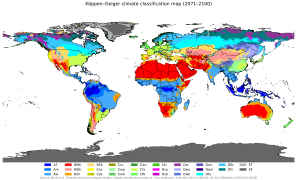 World (Future)


See also[edit]
References[edit]
- ^Köppen, Wladimir (1884)."Die Wärmezonen der Erde, nach der Dauer der heissen, gemässigten und kalten Zeit und nach der Wirkung der Wärme auf die organische Welt betrachtet"[The thermal zones of the earth according to the duration of hot, moderate and cold periods and to the impact of heat on the organic world)].Meteorologische Zeitschrift.20(3). Translated by Volken, E.; Brönnimann, S (published 2011): 351–360.Bibcode:2011MetZe..20..351K.doi:10.1127/0941-2948/2011/105.S2CID209855204.Archivedfrom the original on 8 September 2016.Retrieved2 September2016– via ingentaconnect /content/schweiz/mz/2011/00000020/00000003/art00009.
- ^Rubel, F.; Kottek, M (2011). "Comments on: 'The thermal zones of the Earth' by Wladimir Köppen (1884)".Meteorologische Zeitschrift.20(3): 361–365.Bibcode:2011MetZe..20..361R.doi:10.1127/0941-2948/2011/0285.
- ^Köppen, Wladimir (1918). "Klassification der Klimate nach Temperatur, Niederschlag and Jahreslauf".Petermanns Geographische Mitteilungen.Vol. 64. pp. 193–203, 243–248 – via koeppen-geiger.Vu-Wien.ac.at/Koeppen.htm.
- ^Köppen, Wladimir (1936). "C". In Köppen, Wladimir; Geiger (publisher), Rudolf (eds.).Das geographische System der Klimate[The geographic system of climates](PDF).Vol. 1. Berlin: Borntraeger.Archived(PDF)from the original on 4 March 2016.Retrieved2 September2016.
- ^Geiger, Rudolf (1954). "Klassifikation der Klimate nach W. Köppen" [Classification of climates after W. Köppen].Landolt-Börnstein – Zahlenwerte und Funktionen aus Physik, Chemie, Astronomie, Geophysik und Technik, alte Serie.Vol. 3. Berlin: Springer. pp. 603–607.
- ^Geiger, Rudolf (1961).Überarbeitete Neuausgabe von Geiger, R.: Köppen-Geiger / Klima der Erde.(Wandkarte 1:16 Mill.) – Klett-Perthes, Gotha.
- ^abcdefgKottek, Markus; Grieser, Jürgen; Beck, Christoph; Rudolf, Bruno; Rubel, Franz (2006)."World Map of the Köppen-Geiger climate classification updated"(PDF).Meteorologische Zeitschrift.15(3): 259–263.Bibcode:2006MetZe..15..259K.doi:10.1127/0941-2948/2006/0130.
- ^abcdefghijklmnopqrBeck, Hylke E.; Zimmermann, Niklaus E.; McVicar, Tim R.; Vergopolan, Noemi; Berg, Alexis;Wood, Eric F.(30 October 2018)."Present and future Köppen-Geiger climate classification maps at 1-km resolution".Scientific Data.5:180214.Bibcode:2018NatSD...580214B.doi:10.1038/sdata.2018.214.ISSN2052-4463.PMC6207062.PMID30375988.
- ^abcdefghijklmMcKnight, Tom L; Hess, Darrel (2000)."Climate Zones and Types".Physical Geography: A Landscape Appreciation.Upper Saddle River, NJ: Prentice Hall.ISBN978-0-13-020263-5.
- ^abcdefghijklmnoPeel, M. C.; Finlayson, B. L. & McMahon, T. A. (2007)."Updated world map of the Köppen–Geiger climate classification"(PDF).Hydrology and Earth System Sciences.11(5): 1633–1644.Bibcode:2007HESS...11.1633P.doi:10.5194/Hess-11-1633-2007.ISSN1027-5606.
- ^"Koppen climate classification | climatology".Encyclopædia Britannica.Archivedfrom the original on 4 August 2017.Retrieved4 August2017.
- ^abChen, Hans;Chen, Deliang."Köppen climate classification".hanschen.org.Archivedfrom the original on 14 August 2017.Retrieved4 August2017.
- ^abCereceda, P.; Larrain, H.; osses, P.; Farias, M.; Egaña, I. (2008). "The climate of the coast and fog zone in the Tarapacá Region, Atacama Desert, Chile".Atmospheric Research.87(3–4): 301–311.Bibcode:2008AtmRe..87..301C.doi:10.1016/j.atmosres.2007.11.011.hdl:10533/139314.
- ^ab"Clasificación climática de Köppen"(in Spanish). University of Chile. Archived fromthe originalon 22 January 2018.Retrieved21 January2018.
- ^abInzunza, Juan."Capitulo 15. Climas de Chile"(PDF).Meteorología Descriptiva y Aplicaciones en Chile(in Spanish). p. 427. Archived fromthe original(PDF)on 22 January 2018.Retrieved22 January2018.
- ^Estienne, Pierre; Godard, Alain. "Chapitre XVI".Climatologie(in French). Éditions Armand Colin. pp. 308–323.ISBN2-200-31042-0.
- ^Linacre, Edward; Geerts, Bart (1997).Climates and Weather Explained.London: Routledge. p. 379.ISBN978-0-415-12519-2.
- ^"Climate Data Book of Bhutan, 2018"(PDF).National Center for Hydrology and Meteorology.Retrieved13 July2021.
- ^"Puerto Maldonado Climate Normals 1961-1990".National Oceanic and Atmospheric Administration.Retrieved23 April2015.
- ^"Experience Template"Trung Quốc khí tượng số liệu võng(in Simplified Chinese).China Meteorological Administration.Retrieved17 June2023.
- ^"Experience Template"Trung Quốc khí tượng số liệu võng(in Simplified Chinese).China Meteorological Administration.Retrieved17 June2023.
- ^"Estado de Morelos-Estacion: Cuernavaca".Normales Climatologicas 1951–2010(in Spanish). Servicio Meteorologico Nacional. Archived fromthe originalon 3 March 2016.Retrieved25 April2015.
- ^ab"Pure tabular statistics".ArcGIS Experience Builder.China Meteorological Administration.Retrieved2 August2023.
- ^"World Meteorological Organization Climate Normals for 1991-2020 — Ziguinchor".National Oceanic and Atmospheric Administration.Retrieved10 January2024.
- ^"JetStream Max: Addition Köppen-Geiger Climate Subdivisions".National Weather Service. Archived fromthe originalon 24 December 2018.Retrieved24 December2018.
- ^Critchfield, H.J. (1983)."Criteria for classification of major climatic types in modified Köppen system"(4 ed.). University of Idaho. Archived fromthe originalon 30 September 2009.
- ^"Atlas Agroclimático de Chile–Estado Actual y Tendencias del Clima (Tomo I: Regiones de Arica Y Parinacota, Tarapacá y Antofagasta"(in Spanish). Universidad de Chile. 2017.Archivedfrom the original on 22 December 2018.Retrieved9 December2018.
- ^"World Weather Information Service".worldweather.wmo.int.WMO.Retrieved28 July2023.
- ^"Valores Climatológicos Normales - España 1981-2010".Agencia Estatal de Meteorologia.AEMET.Retrieved4 January2024.
- ^"Valores Climatológicos Normales - España 1981-2010".Agencia Estatal de Meteorologia.AEMET.Retrieved4 January2024.
- ^"Evolución de los climas de Koppen en España: 1951-2020"(PDF).Agencia Estatal de Meteorologia.AEMET.Retrieved16 February2024.
- ^КЛИМАТ УЛАН-БАТОРА(in Russian). Pogoda.ru.net.Retrieved4 January2015.
- ^"Evolución de los climas de Koppen en España: 1951-2020"(PDF).Agencia Estatal de Meteorologia.AEMET.Retrieved16 February2024.
- ^"Estado de Nuevo Leon-Estacion: Monterrey".Normales Climatologicas 1951–2010(in Spanish). Servicio Meteorológico Nacional.Retrieved16 October2021.
- ^"Extreme Temperatures and Precipitation for Monterrey"(in Spanish). Servicio Meteorológico Nacional.Retrieved16 October2021.
- ^"World Weather Information Service".worldweather.wmo.int.WMO.Retrieved27 October2023.
- ^"Clima en la Argentina: Guia Climática por Santiago del Estero Aero".Caracterización: Estadísticas de largo plazo(in Spanish). Servicio Meteorológico Nacional.Retrieved5 April2023.
- ^"Valores Climatológicos Normales - España 1981-2010".Agencia Estatal de Meteorologia.AEMET.Retrieved4 January2024.
- ^"Valores Climatológicos Normales - España 1981-2010".Agencia Estatal de Meteorologia.AEMET.Retrieved4 January2024.
- ^"Climate Normals for Batna".Retrieved11 February2013.
- ^"Climate data for Bloemfontein".South African Weather Service. Archived fromthe originalon 15 March 2012.Retrieved7 March2010.
- ^"Bolivia – Cochabamba".Sistema de Clasificación Bioclimática Mundial.Retrieved28 January2014.
- ^"World Weather Information Service".World Weather.WMO.Retrieved13 November2023.
- ^"Valores Climatológicos Normales - España 1981-2010".Agencia Estatal de Meteorologia.AEMET.Retrieved4 January2024.
- ^"World Meteorological Organization Climate Normals for 1991-2020: Sulina"(CSV).ncei.noaa.gov.NOAA.Retrieved14 February2024.
- ^George, Melvin R."Mediterranean Climate".UCRangelands.University of California. Archived fromthe originalon 4 March 2016.Retrieved26 January2015.
- ^"World Weather Information service".World Weather.WMO.Retrieved13 November2023.
- ^"FORM 1: STATION ILAM".Iranian Meteorological Organization. Archived fromthe originalon 8 May 2012.Retrieved18 November2011.
- ^"Weather Information for Irbid".Jordan Meteorological.Retrieved27 November2016.
- ^"World Meteorological Organization Climate Normals for 1991-2020: Bulgaria-Kardzhali"(CSV).NOAA.Retrieved3 January2024.
- ^"World Weather Information Service–Tlemcen".World Meteorological Organization.Retrieved21 October2016.
- ^"Korçë Climate Normals 1961-1990".National Oceanic and Atmospheric Administration.Retrieved22 January2023.
- ^"Global Surface Summary of the Day - GSOD".National Oceanic and Atmospheric Administration.Retrieved22 January2023.
- ^"Valores Climatológicos Normales - España 1981-2010".Agencia Estatal de Meteorologia.AEMET.Retrieved4 January2024.
- ^"Resmi İstatistikler: İllerimize Ait Mevism Normalleri (1991–2020)"(in Turkish). Turkish State Meteorological Service. Archived fromthe originalon 11 January 2019.Retrieved11 April2021.
- ^"Valores Climatológicos Normales - España 1981-2010".Agencia Estatal de Meteorologia.AEMET.Retrieved4 January2024.
- ^"World Meteorological Organization Climate Normals for 1991-2020: Ijevan"(CSV).NOAA.Retrieved6 March2024.
- ^"Κλιματικά Δεδομένα ανά Πόλη- ΜΕΤΕΩΓΡΑΜΜΑΤΑ, ΕΜΥ, Εθνική Μετεωρολογική Υπηρεσία".emy.gr.Retrieved17 August2023.
- ^"Prizren: Monthly and annual means, maximum and minimum values of meteorological elements for the period 1961 - 1990".Republic Hydrometeorological Service of Serbia.Archivedfrom the original on 20 July 2021.Retrieved3 October2021.
- ^"Zagatala Climate Normals 1961–1990".National Oceanic and Atmospheric Administration.Retrieved22 March2015.
- ^"Resmi İstatistikler: İllerimize Ait Genel İstatistik Verileri"(in Turkish). Turkish State Meteorological Service. Archived fromthe originalon 22 January 2019.Retrieved11 December2021.
- ^"Szombathely Climate Normals 1991-2020".National Oceanic and Atmospheric Administration.Archived fromthe originalon 20 September 2023.Retrieved20 September2023.
- ^"World Meteorological Organization Climate Normals for 1991-2020 — Trevico".National Oceanic and Atmospheric Administration.Retrieved3 February2024.
- ^"Pure tabular statistics".ArcGIS Experience Builder.China Meteorological Data Service Center.Retrieved2 August2023.
- ^"World Meteorological Organization".Retrieved7 December2022.
- ^"Pogoda.ru.net"(in Russian).Retrieved8 November2021.
- ^"Климат Благовещенска"(in Russian). Погода и Климат.Retrieved8 November2021.
- ^"Faiz abad Climate Normals for 1964-1983".NOAA.Retrieved7 May2024.
- ^"Briceni Climate Normals 1991–2020".World Meteorological Organization Climatological Standard Normals (1991–2020).National Oceanic and Atmospheric Administration. Archived fromthe originalon 21 August 2023.Retrieved21 August2023.
- ^"World Meteorological Organization Climate Normals for 1981-2010: Dobbiaco-16033"(XLS).ncei.noaa.gov(Excel).National Oceanic and Atmosoheric Administration.Retrieved28 February2024.
- ^I.R of Iran Shahrekord Meteorological Organization ( in Persian ).
- ^"World Meteorological Organization Climate Normals for 1991-2020 – Jermuk"(CSV).NCEI.Retrieved6 March2024.
- ^"Valores Climatológicos Normales - España 1981-2010".Agencia Estatal de Meteorologia.AEMET.Retrieved4 January2024.
- ^"Lysa hora Climate Normals 1991-2020".National Oceanic and Atmospheric Administration.Archived fromthe originalon 28 August 2023.Retrieved28 August2023.
- ^"Štrbské Pleso Climate Normals 1991–2020".World Meteorological Organization Climatological Standard Normals (1991–2020).National Oceanic and Atmospheric Administration. Archived fromthe originalon 20 August 2023.Retrieved20 August2023.
- ^"Tsetserleg Climate Normals 1961-1990".National Oceanic and Atmospheric Administration.Retrieved13 January2013.
- ^"Climate Types: Types of Climate | Climatology".Geography Notes.9 August 2017.Retrieved17 June2022.
- ^"Anexos"(PDF).National Meteorology and Hydrology Service of Peru.Retrieved2 January2023.
- ^"Lomnický štít Climate Normals 1991–2020".World Meteorological Organization Climatological Standard Normals (1991–2020).National Oceanic and Atmospheric Administration. Archived fromthe originalon 20 August 2023.Retrieved20 August2023.
- ^"Musala Peak Climate Normals 1991-2020".National Oceanic and Atmospheric Administration.Retrieved29 August2023.
- ^"World Meteorological Organization Climate Normals for 1991-2020: Sonnblick".ncei.noaa.gov.NOAA.Retrieved16 February2024.
- ^Chen, D.; Chen, H. W. (2013)."Using the Köppen classification to quantify climate variation and change: An example for 1901–2010"(PDF).Environmental Development.6:69–79.doi:10.1016/j.envdev.2013.03.007.Archived(PDF)from the original on 31 October 2014.Retrieved29 October2014.
- ^Critchfield, Howard J (1983).General Climatology(4th ed.). New Delhi: Prentice Hall. pp. 154–161.ISBN978-81-203-0476-5.
- ^Chan, D.; Wu, Q. (2015)."Significant anthropogenic-induced changes of climate classes since 1950".Scientific Reports.5(13487): 13487.Bibcode:2015NatSR...513487C.doi:10.1038/srep13487.PMC4551970.PMID26316255.
- ^Beck, Hylke E.; Zimmermann, Niklaus E.; McVicar, Tim R.; Vergopolan, Noemi; Berg, Alexis; Wood, Eric F. (30 October 2018)."Present and future Köppen-Geiger climate classification maps at 1-km resolution".Scientific Data.5(1): 180214.Bibcode:2018NatSD...580214B.doi:10.1038/sdata.2018.214.ISSN2052-4463.PMC6207062.PMID30375988.S2CID53111021.
External links[edit]
- World Map of the Köppen–Geiger climate classification for the period 1951–2000(archived 6 September 2010)
- New gridded maps of Koeppen’s climate classificationat theWayback Machine(archived 2021-01-10)
Climate records[edit]
- IPCC Data Distribution Center(archived 18 April 2016)