List of German cities by GDP
Appearance
The following article sorts the 107 urban districts (Kreisfreie Städte– cities that constitute districts in their own right) and the metropolitan districts ofHanover,AachenandSaarbrückenby theirgross domestic product(GDP) in the year 2021. Most figures are from theFederal Statistical Office of Germany;figures from other sources are otherwise referenced. The GDP of German cities are shown inEUR€.[1]
List of cities
[edit]List of metropolitan regions
[edit]
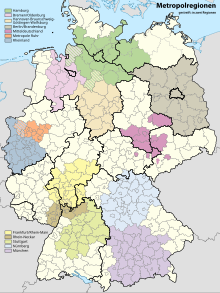
The 11 largestmetropolitan regionsin Germany by their gross domestic product in 2021.[2]
| Rank | Metropolitan Area | GDP (€ Million) (2021) | Population (2022)[3] | GDP per capita (€) |
|---|---|---|---|---|
| 1 | Rhine-Ruhr Metropolitan Region | 536,431 | 13,000,000 | 41,264 |
| 2 | Munich Metropolitan Region | 361,310 | 6,300,000 | 57,349 |
| 3 | Rhine-Main Metropolitan Region | 300,868 | 5,900,000 | 50,144 |
| 4 | Stuttgart Metropolitan Region | 275,060 | 5,300,000 | 51,896 |
| 5 | Hamburg Metropolitan Region | 249,406 | 5,100,000 | 48,902 |
| 6 | Berlin/Brandenburg Metropolitan Region | 246,020 | 6,300,000 | 39,048 |
| 7 | Hannover–Braunschweig–Göttingen–Wolfsburg Metropolitan Region | 169,198 | 3,900,000 | 43,384 |
| 8 | Nuremberg Metropolitan Region | 156,517 | 3,500,000 | 44,719 |
| 9 | Northwest Metropolitan Region | 108,006 | 2,700,000 | 40,002 |
| 10 | Rhine-Neckar Metropolitan Region | 105,201 | 2,400,000 | 43,834 |
| 11 | Central German Metropolitan Region | 102,532 | 2,800,000 | 36,619 |
See also
[edit]References
[edit]- ^"Bruttoinlandsprodukt, Bruttowertschöpfung | Statistikportal.de".Statistische Ämter des Bundes und der Länder | Gemeinsames Statistikportal(in German). 2023-07-27.Retrieved2023-07-31.
- ^"Bruttoinlandsprodukt (BIP) in den Metropolregionen* in Deutschland im Jahr 2021"(in German).
- ^"Einwohner in den Metropolregionen in Deutschland".Statista.Retrieved2024-11-08.
