
Pressure-temperature-time path

ThePressure-Temperature-time path (P-T-t path)is a record of thepressureandtemperature(P-T) conditions that arockexperienced in ametamorphiccycle from burial andheatingtoupliftandexhumationto the surface.[1]Metamorphismis adynamicprocess which involves the changes inmineralsandtexturesof the pre-existing rocks (protoliths) under different P-T conditions insolid state.[2]The changes in pressures and temperatures with time experienced by themetamorphic rocksare often investigated bypetrologicalmethods,radiometric datingtechniques andthermodynamicmodeling.[1][2]
Metamorphic minerals are unstable upon changing P-T conditions.[1][3]The original minerals are commonly destroyed duringsolid statemetamorphism and react to grow into new minerals that are relatively stable.[1][3]Wateris generally involved in thereaction,either from the surroundings or generated by the reaction itself.[3]Usually, a large amount offluids(e.g.water vapor,gasetc.) escape under increasing P-T conditions e.g. burial.[1]When the rock is later uplifted, due to the escape of fluids at an earlier stage, there is not enough fluids to permit all the new minerals to react back into the original minerals.[1]Hence, the minerals are not fully inequilibriumwhen discovered on the surface.[1]Therefore, the mineral assemblages in metamorphic rocks implicitly record the past P-T conditions that the rock has experienced, and investigating these minerals can supply information about the pastmetamorphicandtectonichistory.[1]
The P-T-t paths are generally classified into two types:clockwiseP-T-t paths,which are related tocollisionorigin, and involve high pressures followed by high temperatures;[4]andanticlockwiseP-T-t paths,which are usually ofintrusionorigin, and involve high temperatures before high pressures.[4](The "clockwise" and "anticlockwise" names refer to the apparent direction of the paths in theCartesian space,where thex-axisis temperature, and they-axisis pressure.[3])
Stages in P-T-t paths[edit]
P-T-t paths often reflect various stages of themetamorphiccycle.[3]A metamorphic cycle implies the series of processes that a rock experienced from burial, heating toupliftanderosion.[3]The P-T conditions experienced by a rock throughout these processes can be classified into three main stages according to temperature changes:[3]
- Prograde (pre-peak) metamorphism:the process when the rock is buried and heated in environments such asbasinsorsubductionzones.[3]Devolatilizationreactions (release of gases e.g.CO2,H2O) are common.[3]
- Peak metamorphism:the maximum temperature reached throughout the metamorphic history.[3]
- Retrograde (post-peak) metamorphism:the metamorphism occurred during uplift and cooling of the rock.[3]
However, retrograde metamorphism may not always be observed in metamorphic rocks.[3]This is due to the loss of fluids (e.g. CO2,H2O) from prograde metamorphism, after which there is insufficient fluid to permitreverse reactionof the mineral assemblages.[1][3]Another reason is that the rocks are of inappropriate composition to generate all the minerals that record their complete metamorphic events.[1]On average, only one-in-twenty metamorphic rock samples display all the three stages of metamorphism.[1]
P-T-t path trajectories[edit]
P-T-t paths can generally be classified into two types:clockwiseP-T-t pathsandanticlockwiseP-T-t paths.[4]
Clockwise P-T-t paths[edit]


Metamorphic rocks with clockwise P-T-t paths are commonly associated with a near-isothermaldecompressional P-Ttrajectory.[5][6]
Clockwise P-T-t path normally consists of three parts:[2]
- Initial heating and compressionuntil arriving a peak, a high pressure-low temperature peak is often observed. (Prograde metamorphism until peak)[2]
- Near-isothermaldecompressionafter the peak (Stage 1 retrograde metamorphism)[2]
- Further decompression and coolingat a slow rate (Stage 2 retrograde metamorphism)[2]
One might expect that the rock reaches its peak metamorphism at the peak temperature and pressure at similar time, and near-isothermaldecompression P-T-t path is observed at its stage 1 metamorphism.[2]However, in reality, the rocks commonly experience the peak pressure prior to the peak temperature.[2]This is due to the relative insensitivity of rocks to thermal events, i.e. poorconductivityof rock upon external thermal changes, whereas the rocks instantaneously experience pressure changes.[1]
Examples of metamorphic rocks that consist of clockwise P-T-t paths can be found at:
- Trans-North China orogen,North China Craton[5][7]
- Bohemian Massif,Austria[6]
- SouthernBrittany,France[8]
- NorthernGallatin Range,South-westernMontana,USA[9]
- SouthernPrince Charles Mountains,EastAntarctica[10]
Anticlockwise P-T-t paths[edit]

Metamorphic rocks with anticlockwise P-T-t paths are commonly associated with a near-isobariccooling P-T trajectory.[11]
Anticlockwise P-T-t path normally consists of two parts:[2]
- Initial heating and compressionuntil reaching a peak, a low pressure-high temperature peak is often observed. (Prograde metamorphism until peak)[2]
- Near-isobaric coolingafter the peak (Retrograde metamorphism)[2]
It is commonly observed that the peak temperature is reached prior to the peak pressure in anticlockwise P-T-t paths, as the rocks usually experienced the heat from the heat source before being extensively pressurized.[12]
Examples of metamorphic rocks that consist of anticlockwise P-T-t paths can be found at:
- Arunta Block,Central Australia[13]
- Andes,South America[14]
- Yinshan Block,North China Craton[7]
- Coastal Cordillera,South-CentralChile[15]
Reconstruction of P-T-t paths[edit]
The reconstruction of P-T-t paths includes two types of approaches:[1]
- Backward approach:the method of inversely inferring the metamorphic events from rock samples via traditionalpetrologicalinvestigation methods (e.g.optical microscopy,geothermobarometryetc.).[1]
- Forward approach:using thermalmodelingtechniques to work on the geological evolutionary model of rocks, and is usually used to validate results obtained in the backward approach.[1]
Backward approach (Petrological P-T-t reconstruction)[edit]
Petrological reconstruction is a backward approach which utilizes mineral compositions of rocks samples to deduce the possible P-T conditions.[1]Common techniques includeoptical microscopy,geothermobarometry,pseudosections,andgeochronology.[1]
Optical microscopy[edit]
Inqualitativereconstruction of P-T conditions, geologists examinethin sectionsunderpolarized light microscopeto determine the sequence of formation of the minerals.[16]Due to incomplete replacement of the earlier formed minerals under changing P-T conditions,[16]minerals formed at various P-T environments can be found in the same rock specimen.[16][1]As different minerals have different optical characteristics and textures, determination of the mineral compositions in metamorphic rocks is made possible.[16]
Common textures at different stages of metamorphism:
- Prograde (pre-peak) metamorphism
- Mineral inclusions(poikiloblastictexture):[17]a mineral that is formed at a lower P-T condition is included in another mineral that is formed at a higher P-T condition. For example, in thin section examination,biotitecrystal is included in agarnetgrain, so biotite is considered to be formed at an earlier time.
- Peak metamorphism
- Porphyroblastic-matrixtexture:[18]largeeuhedralcrystals inside a finegroundmass.Both the euhedral crystals and thematrixminerals of the porphyroblasts are formed at peak metamorphism.
- Retrograde (post-peak) metamorphism
- Corona (reaction rim):[19]minerals formed at lower P-T conditions surrounding the highergrademineral
- Symplectite(finger-like texture):[16]intergrowth between retrograde minerals (formed at lower P-T conditions) and minerals formed at the peak stage (higher P-T conditions)
- Mineral cross-cutting:[16]retrograde minerals cross-cut minerals that are formed at the peak stage
| Textures at different stages of metamorphism observed under a microscope | ||
|---|---|---|
| Stages of metamorphism | Typical texture | Example of texture |
| Prograde (Pre-peak) | mineral inclusions |  |
| Peak | porphyroblasts |  |
| Retrograde (Post-peak) | reaction rims |  |
| symplectites |  | |
| cross-cutting |  | |
Not all rock samples exhibit all the P-T conditions they experienced throughout geological evolution.[1]This is attributed to the complexity of the geological processes, which the samples may have undergone complicatedthermodynamichistories, or of inappropriate mineral compositions to produce minerals that record their metamorphic events.[1]
Geothermobarometry[edit]

Geothermobarometryis aquantitativemeasurement of the P-T conditions, which is widely used in analyzing the P-T conditions ofmetamorphicandintrusiveigneous rocks.[20]
The underlying principle of geothermobarometry is by utilizing theequilibrium constantsof mineral assemblages in a rock to infer the metamorphic P-T conditions.[1][20]Anelectron microprobeis usually used in geothermobarometry to measure the distribution of components in the minerals and give precise determination of thechemical equilibriumwithin the specimen.[20]
Geothermobarometry is a combination of:
- Geothermometry:the measurement of temperature changes using equilibrium of minerals that are insensitive to pressure variations,[1]and
- Geobarometry:the determination of the pressure changes using equilibrium of minerals that are of little dependence on temperature change.[1]
Geothermometers are usually represented byexchange reactions,which are sensitive to temperature but with little effect under changing pressure, such as exchange ofFe2+andMg2+betweengarnet-biotitereaction:[1]

Geobarometers are typically occurred asnet-transfer reactions,which are sensitive to pressure but have little change with temperature, such asgarnet-plagioclase-muscovite-biotitereaction that involves a significant volume reduction upon high pressure:[1]

Since mineral assemblages at equilibrium are dependent on pressures and temperatures, by measuring the composition of the coexisting minerals, together with using suitable activity models, the P-T conditions experienced by the rock can be determined.[1]
After oneequilibrium constantis found, a line would be plotted on the P-T diagram.[20]As different equilibrium constants of mineral assemblages would occur as lines with different slopes in the P-T diagram, therefore, by finding the intersection of at least two lines in the P-T diagram, the P-T condition of the specimen can be obtained.[1]
Despite the usefulness of geothermobarometry, special attention should be paid to whether the mineral assemblages represent an equilibrium, any occurrence of retrograde equilibrium in the rock, and appropriateness ofcalibrationof the results.[1]
Garnet growth zoning[edit]


Garnetgrowth zoning is a special type of geothermobarometry that focuses on the composition variations in garnet.[21]
Zoning is a texture insolid-solutionminerals which the minerals formconcentric ringsfrom core to rim upon changing P-T conditions.[21]In a changing environment, minerals would be unstable and alter itself to reduce itsGibbs free energyto achieve stable states.[21]However, sometimes the mineral core has not reached equilibrium upon the environmental change and zoning occurs.[21]Zoning is also found in other minerals such asplagioclaseandfluorite.[1]
In practice, garnet is commonly used in the study of metamorphic rocks due to itsrefractorynature.[22]In past studies, garnet is found to be a mineral that is stable under a wide range of P-T conditions, meanwhile chemically displays responses (e.g.ions exchange) to the P-T variations throughout its metamorphic history without reaching complete equilibrium.[22]The non-equilibriated garnet formed previously are often zoned by younger garnet.[1]Therefore, many past P-T characteristics are preserved in the zoned areas.Electron microprobesare used to measure the composition of the garnet zones.[22]
However, melting within garnet sometimes occurs ordiffusionrate is too rapid at high temperature, some garnet zones are merged and cannot provide sufficient information about the complete metamorphic history of the rocks.[1]
Gibbs method[edit]
The Gibbs method formalism is a method used to analyze pressures and temperatures of zoned minerals and textural changes in metamorphic rocks by applying differentialthermodynamicequations based onDuhem's Theorem.[23]It attempts to simulate the garnet growth zoning numerically by solving a set of differential equations involving variables pressure (P), temperature (T),chemical potential(μ), mineral composition (X).[23]Modal abundance of mineral phases (M) was later added as an extensive variable in the Gibbs method with mass balance added as a constraint.[1][23]The aim of this analysis is to search for the absolute P-T condition during different zonal growth and matches the observed composition of zones in the sample.[24]The computer programGIBBSis commonly used for calculation of the equations.[24]
Pseudosection[edit]

Pseudosection is anequilibriumphase diagramwhich shows all the stable mineral assemblages of a rock at different P-T ranges for a single whole-rock chemical composition (bulk-rock composition).[25]The stable mineral assemblages are marked as different areas in the P-T graph.[25]
Unlikegeothermobarometry,which focuses only on singlechemical equilibriumequations, pseudosections make use of multiple equilibrium equations to search for the past P-T conditions.[1][25]It is widely used in metamorphic rock analysis due to its consideration of multiple reactions which resemble metamorphic processes of multiple minerals in reality.[25]
(Pseudosection is different frompetrogenetic grid.Pseudosection shows different mineral phases for a single rock chemical composition,[25]while petrogenetic grid shows a set of reactions under different P-T conditions that would occur for a phase diagram.[1])
In the construction of pseudosections, the bulk-rock composition is firstly determined usinggeochemicaltechniques, then inserted intocomputer programsfor calculations based onthermodynamics equationsto generate pseudosection diagrams.[25]
There are two geochemical methods in determining the bulk-rock composition:
- X-ray fluorescence(XRF) analysis, which directly determines the whole rock chemical composition.[25]
- Point-counting composition using anelectron microprobe,which involves weighted calculation of minerals in rocks observed fromthin-sections.[25]
Both methods have their advantages and limitations. The XRF method provides a non-biased estimation, but may neglect the proportion of existing minerals in the rock.[25]Meanwhile, the point-counting method takes into account of mineral proportions, but is based on human judgement and may be biased.[25]
Common computer programs for computing pseudosections:
The results from a single pseudosection is not completely reliable, since in reality the rock specimen is not always in equilibrium.[27]However, analysis can be done on fractions of the P-T-t path e.g. at boundaries of mineral inclusions, or on local bulk composition analysis would improve precision and accuracy of the P-T-t path.[27]
Geochronology[edit]
To figure out the age of the metamorphic events,geochronologicaltechniques are used.[28]It utilizes the idea ofradioactive decayof long-lived unstableisotopesin minerals to search for theageof events.[28]
Monazite geochronology[edit]

In the study of metamorphic petrology,uranium–thorium–lead datingofmonazite(monazite geochronology) is an effective method to determine the P-T history.[29][30]Monazite is aphosphate mineralcontaininglight rare-earth-elements (LREE)that occurs in a wide range of rock types.[31]It usually incorporates radioactivethorium(Th) during its crystal formation, making age determination possible.[31]
Monazite has characteristics of high closure temperature (>1000 °C), variable composition, and robustness under a large temperature range, which help in the record of geological history in metamorphic rocks.[32]Anelectron microprobeis usually used for the measurement of monazite composition.[33]
Monazite inclusions[edit]
Monazite usually occurs asinclusionsin theporphyroblastsin metamorphic rocks.[34]
For instance, during the growth ofgarnetzones in metamorphic processes, monazite grains are included into the zones of garnets.[34][35]Since garnets are quite stable upon changing temperature, the included monazite grains are well preserved and prevented from the re-setting of decay system and age.[34]Therefore, the age of the metamorphic events in each zone can be estimated.[34]
Monazite growth zoning[edit]
Apart from occurring as inclusion in garnets, monazite also display zonal growth pattern itself upon changing P-T conditions.[32]
Monazite tends to capture Th when it is formed.[31]When monazite crystal is growing, the earlier formed monazites incorporate many Th, and leaving a Th-depleted surrounding environment.[31]Hence, the older formed monazite has a higher concentration of Th than younger monazite.[31]Therefore, dating zoned matrix monazites (i.e. monazites that do not form asinclusionsin other minerals) of the metamorphic rock can obtain information about the age as well as their formation sequence.[31][32]The dating method is usually done by using an electron microprobe to observe the compositional zones of monazite, then analyzing the U-Th-Pb age of each zone to reconstruct the time of the relevant P-T conditions.[30][32]Data obtained from matrix monazites are often compared with those obtained from monazite inclusions for the metamorphic history interpretation.[31]
Zircon geochronology[edit]
Zirconis another suitable mineral for dating metamorphic rocks.[36]It occurs as anaccessory mineralin rocks and contains trace amount ofuranium(U).[37]
As zircon is resistant towards weathering and high temperature, it is a useful mineral in recording geological processes.[36]Similar as monazite, zircon also displays zoned patterns upon varying P-T conditions, which each zone records information of the changing past environment.[36]U-Pb datingis commonly used in dating zircon ages.[36]Zircon geochronology gives good record of ages in cooling andexhumationprocesses.[36]However it is less reactive than monazite under metamorphic events, and performs better in datingigneous rocks.[38]
Forward approach (Thermal modeling)[edit]

Unlike using traditionalpetrologicalinvestigation methods (e.g.optical microscopy,geothermobarometry) to inversely infer the metamorphic events from rock samples, thermal modeling is a forward method that attempts to work on the geological evolution of rocks.[1]
Thermal modeling appliesnumerical modelingtechniques based onheat transfer equations,differenttectonicsmodels and reactions of metamorphic minerals in the simulation of the possible metamorphic events.[1][39]It works on the temperature variation of theearth crustover time based on rate ofheat transferanddiffusionalong the disturbedgeothermal gradient(normal heat distribution in the ground).[1][2]
Thermal modeling does not give the actual geological time.[1]However, it provides accurate estimation of the duration of the thermal events.[1][2]An advantage of thermal modeling is that it provides a holistic estimation of the duration of different stages of metamorphism, which is somehow difficult to completely extract from geochronological methods.[1]
The model simulation involves solving the continuous time-dependent differential heat transfer equation by its approximate discretefinite differenceform using computer programs such asFORTRAN.[1][26]
After the equations are set, a grid ofnodesis generated for calculation of each point.[1][40]Boundary conditions(normally temperature of the geothermal gradients) are input into the equations to calculate the temperature at boundaries.[1]Results are compared with petrological experimental results for validation.[1]
By combining petrological methods and thermal modeling techniques, the understanding of metamorphic processes due to tectonic events is facilitated.[1][39]Petrological results provide realistic variables to be plugged into a model simulation, while numerical modeling techniques often place constraints on the possible tectonic environments.[1][2]The two methods complement the limitations of each other, and formulate a comprehensive evolutionary history of the metamorphic and tectonic events.[1]
Tectonic implications[edit]
Collision setting[edit]
Areas withcollision-related tectonic eventsor undersubductionzones commonly produce metamorphic rocks withclockwise P-T-t pathswith near-isothermal decompressional P-T trajectories,[5][6]and the reason is as follows:
- During prograde metamorphism until peak, initial heating and compression until arriving a high pressure-low temperature (HPLT) peak is shown, suggesting an early phase of progressing burial due to crustal thickening without receiving much heat.[16]
- At stage 1 retrograde metamorphism, near-isothermal decompression after the peak, which indicates uplift and exhumation of the compressed rock in theorogenic beltorforearc.[16]
- At stage 2 retrograde metamorphism, further decompression and cooling occur at a slow rate, implying furthererosionafter the tectonic event.[16]
In addition, recent studies based on mechanical analysis reveal that peak pressure recorded in clockwise P-T paths does not necessarily represent the maximum depth of burial, but can also represent a change in the tectonic pattern.[41]

Intrusion[edit]
Intrusionssuch ashotspotsorriftsatmid-ocean ridgescommonly produce metamorphic rocks displayinganticlockwise P-T-t pathspatterns with near-isobaric cooling P-T trajectories,[11]and the reason is as follow:
- During prograde metamorphism until peak, initial heating and compression until reaching a low pressure-high temperature (LPHT) peak is shown, implying an event of heating generated from below and the crust is slightly thickened.[12][16]This reflects the action ofmagma intrusionand erupted as sheet intrusive layer such assills,resulting in a slight increase in pressure but a great increase in temperature.[16]
- During retrograde metamorphism, near-isobaric cooling after the peak took place, indicating that the rock stays at the same position while the magma cools.[16]
 Intrusion of magma results in a great increment in temperature and a slight increase in pressure experienced by the underlying rocks, which gives prograde metamorphism. Cooling of erupted magma causes a near-isobaric temperature drop and leads to retrograde metamorphism of the underlying rocks.
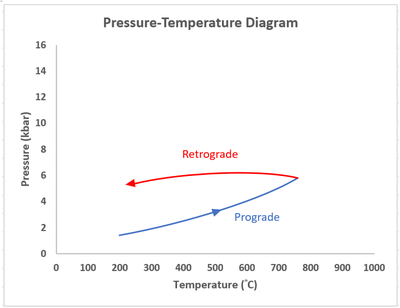 A typical anticlockwise P-T-t path representing an intrusion origin. A great temperature increment during prograde metamorphism due to overlying hot magma, followed by near-isobaric cooling in retrograde metamorphism when the magma cools.

Paired metamorphic belts[edit]

Both clockwise and anticlockwise metamorphic P-T-t pathsare found inpaired metamorphic beltsatconvergent plate boundaries.[42]Paired metamorphic belts display two contrasting mineral assemblages sets:[42][43]
- A high pressure-low temperature (HPLT) belt[42][43]
- A low pressure-high temperature (LPHT) belt[42][43]
The HPLT metamorphic belt is located alongsubductionzones, and commonly associated with a clockwise P-T-t path.[42][44]The HPLT condition is resulted fromcrustal thickeningdue to convergence meanwhile without being heated bymagma.[42]
The LPHT metamorphic belt is observed atvolcanic arcsorback-arc basins,[45]which is attributed to magma intrusion derived frompartial meltingof thesubductingslab,and themeltrises to thecrust.[42]This area is associated with an anticlockwise P-T-t path.[42]
The P-T-t paths provide in-depth investigations and implications of the mechanisms in the lithosphere, and further support theplate tectonictheory[42][46]and the formation ofsupercontinents.[47][46][48]
Plume tectonics[edit]

P-T-t paths play an important role in the development of plume tectonics, supported byanticlockwise P-T paths.[11][49]
Plume tectonics are considered to be the dominant process forming the Archean crust with evidence from the study of theArcheancratonicblocks in theNorth China Craton.[11][49]Anticlockwise P-T paths with near-isobaric cooling after the peak are normally found in the Archean rocks, suggesting an intrusion origin.[11]
The lack of apaired metamorphic beltas well as a paired clockwise P-T path in the Archean rocks eliminates the possibility of the volcanic arc formation.[11][50]Evidenced together by a largedoming structure,widespread ofkomatiitesandbimodal volcanism,it is proposed that plume tectonics is the major crust-forming process in the Archean.[11]This has led to further research on the beginning of plate tectonics and numerical modeling of the early Earth condition.[50][51]
Structural deformation[edit]


P-T-t paths can be used to estimate possible structures in the field as heat would transfer in small scaleadvective heatflow during thrusting and folding of metamorphic rocks.[1][3]
For example, during the formation offault-bend-fold,the rocks in the lower segment (footwall) are heated due to contact with the hotter upper thrust sheet (hanging wall), while the upper thrust sheet is cooling because of losing heat in a downward direction.[52][53]Thus, the lower segment and the upper thrust sheet are undergoing prograde metamorphism and retrograde metamorphism respectively.[53]
Nevertheless, special attention should be taken to the effect of multiple thrusting such as duplexes, where the initial lower plate in an earlier thrust would become the upper plate in a later thrusting event.[52]Depending on the location of the rock, a variety of complex P-T trajectories can be found, which may make interpretation of a terrain challenging.[52]
Historical development of P-T-t paths[edit]

Metamorphic facies[edit]
Metamorphic facies is a classification system first introduced byPentti Eskolain 1920 to classify particular metamorphic mineral assemblages that are stable under a range of P-T conditions.[54][55][1]Before the mid-1970s, geologists utilized the metamorphic facies classification to investigate metamorphic rocks and determined their P-T characteristics.[1]However, little was known about the evolutionary processes of these P-T conditions and how metamorphic rocks reach the surface at that time.[1]
Metamorphic path[edit]
The relation between metamorphism and tectonic setting was not well investigated until 1974, whichOxburghandTurcottesuggested that the origin of the metamorphic belt is a result of the thermal effects brought bycontinental collision.[1]The idea was picked up by England and Richardson and further research was done in 1977, and the P-T-t path concept was fully developed by Richardson and Thompson in 1984.[3]
Findings[edit]
The thermal modeling from Richardson and Thompson (1984) reveals that in every case of thermal relaxation after the tectonic event, there is a large portion of heat equilibrium before being significantly influenced by erosion, i.e. the rate of metamorphism is found to be much slower than duration of the thermal event.[2][3]This infers that the rock is a poorheat conductor,which the maximum temperature experienced by the rock as well as its temperature change are insensitive to erosion rate.[2]Therefore, both the evidence of the maximum pressures and temperatures experienced by the buried layers can be imprinted in the underlying metamorphic rocks.[2]Hence, the buried depth as well as plausible tectonic settings can be deduced.[2]Altogether with dating techniques, geologists can even determine the time scale of the tectonic events in respect to the metamorphic events.[2][3]
Future development[edit]
Metamorphic P-T-t paths have been widely recognized as a useful tool in determining the metamorphic history and tectonic evolution of a region. Potential future research directions for P-T-t paths will be likely developed in the following areas:
- Refiningdatingmethods and techniques e.g. incorporating other elements such asFe3+into thethermodynamiccalculations ofultra-high temperature (UHT) metamorphicminerals[56]
- Refininggeodynamicmodels e.g. investigating the effect ofslab break-offon metamorphic P-T-t paths,[41]further testing on P-T-t paths and their corresponding geodynamic models[39]
- Spatialpermeabilityof rocks upon metamorphism and deformation[57]
- Origin of metamorphicmineral inclusionsin resistant metamorphic host minerals[58][59][60]
- Unified theory oflithosphereevolution and formation using evolution mechanisms of metamorphic rocks and their ages[61]
- P-T-t changes of rocks undershock metamorphismusing the combination ofelectron microscopy,imagingtechniques andmodel simulation[62]
- Thermal evolution ofmeteoritesand their parentasteroidsusing the combination of thermal modeling and diffusion zoning of minerals inchondrites[63]
References[edit]
- ^abcdefghijklmnopqrstuvwxyzaaabacadaeafagahaiajakalamanaoapaqarasatauavawaxayazbaS., Spear, Frank (1989).Metamorphic pressure-temperature-time paths.Peacock, Simon Muir, 1960-, International Geological Congress (28th: 1989: Washington, D.C.). Washington, D.C.: American Geophysical Union.ISBN978-0-87590-704-8.OCLC19815434.
{{cite book}}:CS1 maint: multiple names: authors list (link) - ^abcdefghijklmnopqrsENGLAND, P. C.; THOMPSON, A. B. (1984-11-01). "Pressure--Temperature--Time Paths of Regional Metamorphism I. Heat Transfer during the Evolution of Regions of Thickened Continental Crust".Journal of Petrology.25(4): 894–928.Bibcode:1984JPet...25..894E.doi:10.1093/petrology/25.4.894.hdl:20.500.11850/422845.ISSN0022-3530.S2CID39101545.
- ^abcdefghijklmnopqThompson, A. B.; England, P. C. (1984-11-01). "Pressure—Temperature—Time Paths of Regional Metamorphism II. Their Inference and Interpretation using Mineral Assemblages in Metamorphic Rocks".Journal of Petrology.25(4): 929–955.Bibcode:1984JPet...25..929T.doi:10.1093/petrology/25.4.929.hdl:20.500.11850/422850.ISSN0022-3530.
- ^abcStüwe, Kurt; Sandiford, Mike (1995)."A description of metamorphic PTt paths with implications for low-P high-T metamorphism".Physics of the Earth and Planetary Interiors.3–4(88): 211.Bibcode:1995PEPI...88..211S.doi:10.1016/0031-9201(94)02985-K.ISSN0031-9201.
- ^abcLiu, Pinghua; Liu, Fulai; Liu, Chaohui; Wang, Fang; Liu, Jianhui; Yang, Hong; Cai, Jia; Shi, Jianrong (2013)."Petrogenesis, P–T–t path, and tectonic significance of high-pressure mafic granulites from the Jiaobei terrane, North China Craton".Precambrian Research.233:237–258.Bibcode:2013PreR..233..237L.doi:10.1016/j.precamres.2013.05.003.
- ^abcCARSWELL, D. A.; O'BRIEN, P. J. (1993-06-01). "Thermobarometry and Geotectonic Significance of High-Pressure Granulites: Examples from the Moldanubian Zone of the Bohemian Massif in Lower Austria".Journal of Petrology.34(3): 427–459.Bibcode:1993JPet...34..427C.doi:10.1093/petrology/34.3.427.ISSN0022-3530.
- ^abZhao, Guochun; Cawood, Peter A. (2012). "Precambrian geology of China".Precambrian Research.222–223: 13–54.Bibcode:2012PreR..222...13Z.doi:10.1016/j.precamres.2012.09.017.
- ^Jones, K. A.; Brown, Michael (1990-09-01)."High-temperature 'clockwise'P-T paths and melting in the development of regional migmatites: an example from southern Brittany, France".Journal of Metamorphic Geology.8(5): 551–578.Bibcode:1990JMetG...8..551J.doi:10.1111/j.1525-1314.1990.tb00486.x.ISSN1525-1314.
- ^Mogk, D. W. (1992-05-01)."Ductile shearing and migmatization at mid-crustal levels in an Archaean high-grade gneiss belt, northern Gallatin Range, Montana, USA".Journal of Metamorphic Geology.10(3): 427–438.Bibcode:1992JMetG..10..427M.doi:10.1111/j.1525-1314.1992.tb00094.x.ISSN1525-1314.
- ^Boger, S. (n.d.). L. 2005. Early Cambrian crustal shortening and a clockwise PTt path from the southern Prince Charles Mountains, East Antarctica: Implications for the formation of Gondwana.Journal of Metamorphic Geology.,23,603.
- ^abcdefgZHAO, Guochun (2003). "Major tectonic units of the North China Craton and their Paleoproterozoic assembly".Science in China Series D: Earth Sciences.46(1): 23.doi:10.1360/03yd9003.hdl:10722/73087.
- ^abCondie, Kent C. (2015-12-01).Earth as an Evolving Planetary System.Vol. 86. Academic Press. p. 182.Bibcode:2005EOSTr..86..182M.doi:10.1029/2005EO180006.ISBN9780128037096.
{{cite book}}:|journal=ignored (help) - ^Collins, W. J.; Vernon, R. H. (1991-08-01). "Orogeny associated with anticlockwise P-T-t paths: Evidence from low-P, high-T metamorphic terranes in the Arunta inlier, central Australia".Geology.19(8): 835–838.doi:10.1130/0091-7613(1991)019<0835:OAWAPT>2.3.CO;2.
- ^Aguirre, L.; Levi, B.; Nyström, J. O. (1989). "The link between metamorphism, volcanism and geotectonic setting during the evolution of the Andes".Geological Society, London, Special Publications.43(1): 223–232.Bibcode:1989GSLSP..43..223A.doi:10.1144/gsl.sp.1989.043.01.15.S2CID128890409.
- ^Willner, A (2004). "A counterclockwise PTt path of high-pressure/low-temperature rocks from the Coastal Cordillera accretionary complex of south-central Chile: constraints for the earliest stage of subduction mass flow".Lithos.75(3–4): 283–310.Bibcode:2004Litho..75..283W.doi:10.1016/j.lithos.2004.03.002.
- ^abcdefghijklBarker, A.J. (2013-12-19).Introduction to Metamorphic Textures and Microstructures.Routledge.ISBN978-1-317-85642-9.
- ^Aspects of the tectonic evolution of China.Malpas, J., Geological Society of London. London: Geological Society. 2004.ISBN978-1-86239-156-7.OCLC56877747.
{{cite book}}:CS1 maint: others (link) - ^Zhao, Guochun; Yin, Changqing; Guo, Jinghui; Sun, Min; Li, Sanzhong; Li, Xuping; Wu, Chunming; Liu, Chaohui (2010-12-01)."Metamorphism of the Lüliang amphibolite: Implications for the Tectonic Evolution of the North China Craton".American Journal of Science.310(10): 1480–1502.Bibcode:2010AmJS..310.1480Z.doi:10.2475/10.2010.10.ISSN0002-9599.S2CID140202942.
- ^Wu, Kam Kuen; Zhao, Guochun; Sun, Min; Yin, Changqing; He, Yanhong; Tam, Pui Yuk (2013)."Metamorphism of the northern Liaoning Complex: Implications for the tectonic evolution of Neoarchean basement of the Eastern Block, North China Craton".Geoscience Frontiers.4(3): 305–320.doi:10.1016/j.gsf.2012.11.005.
- ^abcdBucher, K.; Frey, M. (2013-03-09).Petrogenesis of Metamorphic Rocks.Springer Science & Business Media.ISBN978-3-662-04914-3.
- ^abcdTracy, R. J.; Robinson, P.; Thompson, A. B. (1976-08-01)."Garnet composition and zoning in the determination of temperature and pressure of metamorphism, central Massachusetts".American Mineralogist.61(7–8): 762–775.ISSN0003-004X.
- ^abcTirone, Massimiliano; Ganguly, Jibamitra (2010). "Garnet compositions as recorders of P–T–t history of metamorphic rocks".Gondwana Research.18(1): 138–146.Bibcode:2010GondR..18..138T.doi:10.1016/j.gr.2009.12.010.
- ^abcSpear, Frank S. (1988-06-01). "The Gibbs method and Duhem's theorem: The quantitative relationships among P, T, chemical potential, phase composition and reaction progress in igneous and metamorphic systems".Contributions to Mineralogy and Petrology.99(2): 249–256.Bibcode:1988CoMP...99..249S.doi:10.1007/BF00371465.ISSN0010-7999.S2CID129169528.
- ^abHarris, C. R.; Hoisch, T. D.; Wells, M. L. (2007-10-01). "Construction of a composite pressure–temperature path: revealing the synorogenic burial and exhumation history of the Sevier hinterland, USA".Journal of Metamorphic Geology.25(8): 915–934.Bibcode:2007JMetG..25..915H.doi:10.1111/j.1525-1314.2007.00733.x.ISSN1525-1314.S2CID106403034.
- ^abcdefghijPalin, Richard M.; Weller, Owen M.; Waters, David J.; Dyck, Brendan (2016-07-01)."Quantifying geological uncertainty in metamorphic phase equilibria modelling; a Monte Carlo assessment and implications for tectonic interpretations".Geoscience Frontiers.7(4): 591–607.doi:10.1016/j.gsf.2015.08.005.
- ^abcdefJowhar, T. N. "Computer programs for PT history of metamorphic rocks using pseudosection approach."International Journal of Computer Applications41.8 (2012).
- ^abO’BRIEN, P. J. "Unravelling PTt paths: Pseudo-sections versus classical phase petrology."Mineral. Mag75 (2011): 1555.
- ^abDickin, A. P. 1995.Radiogenic Isotope Geology.Cambridge, Cambridge University Press.ISBN0-521-59891-5
- ^Johnson, Tim E.; Clark, Chris; Taylor, Richard J.M.; Santosh, M.; Collins, Alan S. (2015)."Prograde and retrograde growth of monazite in migmatites: An example from the Nagercoil Block, southern India".Geoscience Frontiers.6(3): 373–387.doi:10.1016/j.gsf.2014.12.003.hdl:2440/106627.
- ^abŠtípská, P.; Hacker, B. R.; Racek, M.; Holder, R.; Kylander-Clark, A. R. C.; Schulmann, K.; Hasalová, P. (2015-05-01)."Monazite Dating of Prograde and Retrograde P–T–d paths in the Barrovian terrane of the Thaya window, Bohemian Massif".Journal of Petrology.56(5): 1007–1035.Bibcode:2015JPet...56.1007S.doi:10.1093/petrology/egv026.ISSN0022-3530.
- ^abcdefgMartin, Aaron J.; Gehrels, George E.; DeCelles, Peter G. (2007). "The tectonic significance of (U,Th)/Pb ages of monazite inclusions in garnet from the Himalaya of central Nepal".Chemical Geology.244(1–2): 1–24.Bibcode:2007ChGeo.244....1M.doi:10.1016/j.chemgeo.2007.05.003.
- ^abcdWilliams, Michael L.; Jercinovic, Michael J.; Hetherington, Callum J. (2007-04-30). "Microprobe Monazite Geochronology: Understanding Geologic Processes by Integrating Composition and Chronology".Annual Review of Earth and Planetary Sciences.35(1): 137–175.Bibcode:2007AREPS..35..137W.doi:10.1146/annurev.earth.35.031306.140228.ISSN0084-6597.S2CID36999300.
- ^Bhowmik, Santanu Kumar; Wilde, Simon Alexander; Bhandari, Anubha; Basu Sarbadhikari, Amit (2014-03-01)."Zoned Monazite and Zircon as Monitors for the Thermal History of Granulite Terranes: an Example from the Central Indian Tectonic Zone".Journal of Petrology.55(3): 585–621.Bibcode:2014JPet...55..585B.doi:10.1093/petrology/egt078.ISSN0022-3530.
- ^abcdMontel, J. M., Kornprobst, J., & Vielzeuf, D. (2000). Preservation of old U-Th-Pb ages in shielded monazite: example from the Beni Bousera Hercynian kinzigites (Morocco). Journal of Metamorphic Geology, 18(3), 335-342.
- ^Hoisch, Thomas D.; Wells, Michael L.; Grove, Marty (2008). "Age trends in garnet-hosted monazite inclusions from upper amphibolite facies schist in the northern Grouse Creek Mountains, Utah".Geochimica et Cosmochimica Acta.72(22): 5505–5520.Bibcode:2008GeCoA..72.5505H.doi:10.1016/j.gca.2008.08.012.
- ^abcdeKohn, Matthew J., Stacey L. Corrie, and Christopher Markley. "The fall and rise of metamorphic zircon."American Mineralogist100.4 (2015): 897-908.
- ^Handbook of mineralogy.Anthony, John W. (John Williams), 1920-. Tucson, Ariz.: Mineral Data Pub. 2003.ISBN978-0-9622097-1-0.OCLC20759166.
{{cite book}}:CS1 maint: others (link) - ^Rubatto, Daniela; Chakraborty, Sumit; Dasgupta, Somnath (2013-02-01)."Timescales of crustal melting in the Higher Himalayan Crystallines (Sikkim, Eastern Himalaya) inferred from trace element-constrained monazite and zircon chronology".Contributions to Mineralogy and Petrology.165(2): 349–372.Bibcode:2013CoMP..165..349R.doi:10.1007/s00410-012-0812-y.ISSN0010-7999.S2CID128591724.
- ^abcCasini, Leonardo; Puccini, Antonio; Cuccuru, Stefano; Maino, Matteo; Oggiano, Giacomo (2013). "GEOTHERM: A finite difference code for testing metamorphic P–T–t paths and tectonic models".Computers & Geosciences.59:171–180.Bibcode:2013CG.....59..171C.doi:10.1016/j.cageo.2013.05.017.
- ^Kunick, Matthias, Hans-Joachim Kretzschmar, and Uwe Gampe. "Fast calculation of thermodynamic properties of water and steam in process modelling using spline interpolation."Proceedings of the 15h International Conference on the Properties of Water and Steam.2008.
- ^abYamato, P.; Brun, J. P. (2016). "Metamorphic record of catastrophic pressure drops in subduction zones".Nature Geoscience.10(1): 46–50.Bibcode:2017NatGe..10...46Y.doi:10.1038/ngeo2852.
- ^abcdefghiBohlen, Steven R. (1987-09-01). "Pressure-Temperature-Time Paths and a Tectonic Model for the Evolution of Granulites".The Journal of Geology.95(5): 617–632.Bibcode:1987JG.....95..617B.doi:10.1086/629159.ISSN0022-1376.S2CID140170881.
- ^abcFrisch, Wolfgang (2014). "Paired Metamorphic Belt". In Harff, Jan; Meschede, Martin; Petersen, Sven; Thiede, Jörn (eds.).Encyclopedia of Marine Geosciences.Springer Netherlands. pp. 1–4.doi:10.1007/978-94-007-6644-0_111-1.ISBN9789400766440.
- ^Patrick, B. (1995-01-01). "High-pressure-low-temperature metamorphism of granitic orthogneiss in the Brooks Range, northern Alaska".Journal of Metamorphic Geology.13(1): 111–124.Bibcode:1995JMetG..13..111P.doi:10.1111/j.1525-1314.1995.tb00208.x.ISSN1525-1314.
- ^De Yoreo, J.J.; Lux, D.R.; Guidotti, C.V. (1991). "Thermal modelling in low-pressure/high-temperature metamorphic belts".Tectonophysics.188(3–4): 209–238.Bibcode:1991Tectp.188..209D.doi:10.1016/0040-1951(91)90457-4.
- ^abCondie, Kent C.; Pease, Victoria (2008-01-01).When Did Plate Tectonics Begin on Planet Earth?.Geological Society of America.ISBN978-0-8137-2440-9.
- ^Xuchang, Xiao; Liu, Hefu (September 1997).Global Tectonic Zones Supercontinent Formation and Disposal: Proceedings of the 30th International Geological Congress, Beijing, China, 4-14 August 1996.VSP.ISBN978-9067642620.
- ^Rogers, John J. W.; Santosh, M. (2004-09-16).Continents and Supercontinents.Oxford University Press, USA.ISBN978-0-19-516589-0.
- ^abWan, Yu-Sheng; Liu, Dun-Yi; Dong, Chun-Yan; Xie, Hang-Qian; Kröner, Alfred; Ma, Ming-Zhu; Liu, Shou-Jie; Xie, Shi-Wen; Ren, Peng (2015). "Formation and Evolution of Archean Continental Crust of the North China Craton".Precambrian Geology of China.Springer Geology. Springer, Berlin, Heidelberg. pp. 59–136.doi:10.1007/978-3-662-47885-1_2.ISBN978-3-662-47884-4.
- ^abStern, Robert J. (2008). "Modern-style plate tectonics began in Neoproterozoic time: An alternative interpretation of Earth's tectonic history".Special Paper 440: When Did Plate Tectonics Begin on Planet Earth?.Vol. 440. pp. 265–280.doi:10.1130/2008.2440(13).ISBN978-0-8137-2440-9.
- ^Fischer, R.; Gerya, T. (2016). "Early Earth plume-lid tectonics: A high-resolution 3D numerical modelling approach".Journal of Geodynamics.100:198–214.Bibcode:2016JGeo..100..198F.doi:10.1016/j.jog.2016.03.004.
- ^abcChamberlain, C. Page; Karabinos, Paul (1987-01-01). "Influence of deformation on pressure-temperature paths of metamorphism".Geology.15(1): 42.Bibcode:1987Geo....15...42P.doi:10.1130/0091-7613(1987)15<42:IODOPP>2.0.CO;2.ISSN0091-7613.
- ^abShi, Yaolin; Wang, Chi-Yuen (1987-11-01). "Two-dimensional modeling of the P-T-t paths of regional metamorphism in simple overthrust terrains".Geology.15(11): 1048.Bibcode:1987Geo....15.1048S.doi:10.1130/0091-7613(1987)15<1048:TMOTPP>2.0.CO;2.ISSN0091-7613.
- ^Eskola, Pentti Eelis. "The mineral facies of rocks." (1920).
- ^Geological Survey Professional Paper.U.S. Government Printing Office. 1963.
- ^Kelsey, David E.; Hand, Martin (2015)."On ultrahigh temperature crustal metamorphism: Phase equilibria, trace element thermometry, bulk composition, heat sources, timescales and tectonic settings".Geoscience Frontiers.6(3): 311–356.doi:10.1016/j.gsf.2014.09.006.hdl:2440/91616.
- ^Lyubetskaya, T.; Ague, J. J. (2009-08-01)."Modeling the Magnitudes and Directions of Regional Metamorphic Fluid Flow in Collisional Orogens".Journal of Petrology.50(8): 1505–1531.Bibcode:2009JPet...50.1505L.doi:10.1093/petrology/egp039.ISSN0022-3530.
- ^Ashley, Kyle T.; Darling, Robert S.; Bodnar, Robert J.; Law, Richard D. (2015). "Significance of" stretched "mineral inclusions for reconstructing P–T exhumation history".Contributions to Mineralogy and Petrology.169(6): 55.Bibcode:2015CoMP..169...55A.doi:10.1007/s00410-015-1149-0.S2CID127565257.
- ^Kohn, Matthew J.; Mazzucchelli, Mattia L.; Alvaro, Matteo (2023-05-31)."Elastic Thermobarometry".Annual Review of Earth and Planetary Sciences.51(1): 331–366.doi:10.1146/annurev-earth-031621-112720.ISSN0084-6597.
- ^Alvaro, M.; Mazzucchelli, M.L.; Angel, R.J.; Murri, M.; Campomenosi, N.; Scambelluri, M.; Nestola, F.; Korsakov, A.; Tomilenko, A.A.; Marone, F.; Morana, M. (2020)."Fossil subduction recorded by quartz from the coesite stability field".Geology.48:24–28.doi:10.1130/g46617.1.hdl:2158/1284757.
- ^Nicoli, Gautier; Moyen, Jean-François; Stevens, Gary (2016-05-24)."Diversity of burial rates in convergent settings decreased as Earth aged".Scientific Reports.6(1): 26359.Bibcode:2016NatSR...626359N.doi:10.1038/srep26359.ISSN2045-2322.PMC4877656.PMID27216133.
- ^Bland, P. A.; Collins, G. S.; Davison, T. M.; Abreu, N. M.; Ciesla, F. J.; Muxworthy, A. R.; Moore, J. (2014-12-03)."Pressure–temperature evolution of primordial solar system solids during impact-induced compaction".Nature Communications.5:ncomms6451.Bibcode:2014NatCo...5.5451B.doi:10.1038/ncomms6451.PMC4268713.PMID25465283.
- ^Schwinger, Sabrina; Dohmen, Ralf; Schertl, Hans-Peter (2016). "A combined diffusion and thermal modeling approach to determine peak temperatures of thermal metamorphism experienced by meteorites".Geochimica et Cosmochimica Acta.191:255–276.Bibcode:2016GeCoA.191..255S.doi:10.1016/j.gca.2016.06.015.