
Rochdale Metropolitan Borough Council elections
Rochdale Metropolitan Borough Council electionsare generally held three years out of every four, with a third of the council being elected each time. Rochdale Metropolitan Borough Council, generally known asRochdale Borough Council,is the local authority for themetropolitan boroughofRochdaleinGreater Manchester,England. Since the last boundary changes in 2022, 60councillorshave been elected from 20wards.[1]
Council elections
[edit]- 1973 election
- 1975 election
- 1976 election
- 1978 election
- 1979 election
- 1980 election
- 1982 election
- 1983 election
- 1984 election
- 1986 election
- 1987 election
- 1988 election
- 1990 election
- 1991 election
- 1992 election
- 1994 election
- 1995 election
- 1996 election
- 1998 election
- 1999 election
- 2000 election
- 2002 election
- 2003 election
- 2004 election[a]
- 2006 election
- 2007 election
- 2008 election
- 2010 election
- 2011 election
- 2012 election
- 2014 election
- 2015 election
- 2016 election
- 2018 election
- 2019 election
- 2021 election
- 2022 election[b]
- 2023 election
- 2024 election
Borough result maps
[edit]-
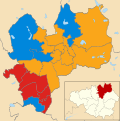
 2004 results map
 -
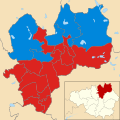
 2006 results map
 -
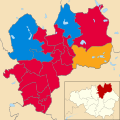
 2007 results map
 -
 2008 results map
 -
 2010 results map
 -
 2011 results map
 -
 2012 results map
 -
 2014 results map
 -
 2015 results map
 -
 2016 results map
 -
 2018 results map
 -
 2019 results map
 -
 2021 results map


By-election results
[edit]1993-1997
[edit]| Party | Candidate | Votes | % | ±% | |
|---|---|---|---|---|---|
| Liberal Democrats | 2,015 | 56.6 | |||
| Labour | 1,109 | 31.7 | |||
| Conservative | 413 | 11.6 | |||
| Independent | 22 | 0.6 | |||
| Majority | 906 | 24.9 | |||
| Turnout | 3,559 | ||||
| Liberal Democratshold | Swing | ||||
1997-2001
[edit]| Party | Candidate | Votes | % | ±% | |
|---|---|---|---|---|---|
| Liberal Democrats | 1,347 | 52.2 | +18.7 | ||
| Labour | 716 | 27.8 | −3.2 | ||
| Conservative | 432 | 16.8 | −5.6 | ||
| Independent | 84 | 3.3 | +3.3 | ||
| Majority | 631 | 24.4 | |||
| Turnout | 2,579 | 29.0 | |||
| Liberal Democratshold | Swing | ||||
2005-2010
[edit]| Party | Candidate | Votes | % | ±% | |
|---|---|---|---|---|---|
| Labour | Jonathan Burns | 603 | 41.6 | −9.8 | |
| Liberal Democrats | Rhoda Morley | 566 | 39.1 | +21.3 | |
| Conservative | David Harris | 280 | 19.3 | −11.5 | |
| Majority | 37 | 2.5 | |||
| Turnout | 1,449 | 18.2 | |||
| Labourhold | Swing | ||||
2010-2015
[edit]| Party | Candidate | Votes | % | ±% | |
|---|---|---|---|---|---|
| Labour | Anthony Joseph William Bennett | 627 | 29.7% | +3.0% | |
| Liberal Democrats | Patricia Ann Colclough | 246 | 11.7% | −4.4% | |
| National Front | Peter Greenwood[5] | 156 | 7.4% | +7.4% | |
| Conservative | Peter Nicholas Winkler | 1,081 | 51.2% | −6.0% | |
| Majority | 460 | 21.8% | −8.7% | ||
| Turnout | 2,110 | 27.1% | −12.9% | ||
References
[edit]- ^ab"The Rochdale (Electoral Changes) Order 2021",legislation.gov.uk,The National Archives,SI 2021/1230,retrieved31 August2022
- ^"Rochdale Metropolitan Borough Council".BBC News Online.Retrieved7 May2010.
- ^"Labour hold on in by-election".Middleton Guardian. 30 November 2007.Retrieved7 May2010.
- ^http:// rochdale.gov.uk/the_council/elections/election_-_norden_ward.aspx[dead link]
- ^"Newdawnparty.uk".
