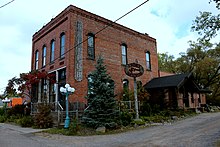
Sawyer County, Wisconsin
Sawyer County | |
|---|---|
 | |
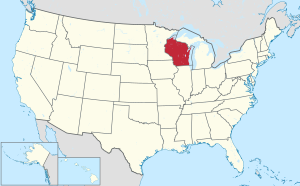
 Location within the U.S. state ofWisconsin | |
 Wisconsin's location within theU.S. | |
| Coordinates:45°54′N91°08′W/ 45.9°N 91.14°W | |
| Country | |
| State | |
| Founded | 1885 |
| Named for | Philetus Sawyer |
| Seat | Hayward |
| Largest city | Hayward |
| Area | |
| • Total | 1,350 sq mi (3,500 km2) |
| • Land | 1,257 sq mi (3,260 km2) |
| • Water | 93 sq mi (240 km2) 6.9% |
| Population | |
| • Total | 18,074 |
| • Estimate (2023) | 18,552 |
| • Density | 14.4/sq mi (5.6/km2) |
| Time zone | UTC−6(Central) |
| • Summer (DST) | UTC−5(CDT) |
| Congressional district | 7th |
| Website | www |
Sawyer Countyis acountyin theU.S. stateofWisconsin.As of the2020 census,its population was 18,074.[1]Itscounty seatisHayward.[2]The county partly overlaps with the reservation of theLac Courte Oreilles Band of Lake Superior Chippewa Indians.
History
[edit]The area that is now Sawyer County was contested between theDakotaandOjibwepeoples in the 18th century. Oral histories tell that the Ojibwes defeated the Dakotas locally in the Battle of the Horse Fly on the Upper Chippewa River in the 1790s.[3][4]By this time,Lac Courte Oreilleshad become the site of an Ojibwe village. Ojibwes allowed traderMichel Cadotteto build afur-tradingoutpost in the area in 1800.[5]The United States acquired the region from the Ojibwe Nation in the1837 Treaty of St. Peters,but the Ojibwes retained the right to hunt and fish on treaty territory. Ojibwe people successfully negotiated to establish the permanentLac Courte Oreilles Indian Reservationin the1854 Treaty of La Pointe.[6]
The county is named forPhiletus Sawyer,aNew Englandman who representedWisconsinin theU.S. House of RepresentativesandU.S. Senatein the 19th century.[7]Logging began in the late 1850s. Loggers came fromCortland County, New York,Carroll County, New Hampshire,Orange County, Vermont,andDown EastMainein what is nowWashington County, MaineandHancock County, Maine.These were "Yankee"migrants, that is to say they were descended from theEnglishPuritanswho had settled New England during the 1600s. They were mostly members of theCongregational Church.[8]Sawyer County was created in 1883 and organized in 1885.[9]In the 1890s immigrants came from a variety of countries such as Germany, Norway, Poland, Ireland and Sweden.
Geography
[edit]According to theU.S. Census Bureau,the county has a total area of 1,350 square miles (3,500 km2), of which 93 square miles (240 km2) (6.9%) are covered by water.[10]It is the fifth-largest county in Wisconsin by land area.
Major highways
[edit]
 U.S. Highway 63
 Highway 27 (Wisconsin)
 Highway 40 (Wisconsin)
 Highway 48 (Wisconsin)
 Highway 70 (Wisconsin)
 Highway 77 (Wisconsin)
- Sawyer County Highway B is the busiest rural roadway on average in all of Sawyer County with a high count of 5900 vehicles daily, according to the Wisconsin Department of Transportation's average daily traffic maps for 2008.[11]
Railroads
[edit]Buses
[edit]Airport
[edit]Sawyer County Airport(KHYR) serves the county and surrounding communities.
Adjacent counties
[edit]- Bayfield County- north
- Ashland County- northeast
- Price County- east
- Rusk County- south
- Barron County- southwest
- Washburn County- west
- Douglas County- northwest
National protected areas
[edit]Demographics
[edit]| Census | Pop. | Note | %± |
|---|---|---|---|
| 1890 | 1,977 | — | |
| 1900 | 3,593 | 81.7% | |
| 1910 | 6,227 | 73.3% | |
| 1920 | 8,243 | 32.4% | |
| 1930 | 8,878 | 7.7% | |
| 1940 | 11,540 | 30.0% | |
| 1950 | 10,323 | −10.5% | |
| 1960 | 9,475 | −8.2% | |
| 1970 | 9,670 | 2.1% | |
| 1980 | 12,843 | 32.8% | |
| 1990 | 14,181 | 10.4% | |
| 2000 | 16,196 | 14.2% | |
| 2010 | 16,557 | 2.2% | |
| 2020 | 18,074 | 9.2% | |
| U.S. Decennial Census[12] 1790–1960[13]1900–1990[14] 1990–2000[15]2010[16]2020[1] | |||
2020 census
[edit]As of thecensus of 2020,[1]the population was 18,074. Thepopulation densitywas 14.4 people per square mile (5.6 people/km2). There were 15,966 housing units at an average density of 12.7 units per square mile (4.9 units/km2). The racial makeup of the county was 77.0% White, 16.3% Native American, 0.6% African American, 0.3% Asian, 0.6% fromother races,and 5.2% from two or more races. Ethnically, the population was 2.0% Hispanic or Latino of any race.
2000 census
[edit]As of thecensus[17]of 2000, 16,196 people, 6,640 households, and 4,581 families resided in the county. Thepopulation densitywas 13 people per square mile (5.0 people/km2). The 13,722 housing units had an average density of 11 units per square mile (4.2 units/km2). The racial makeup of the county was 81.72% White, 0.31% African American, 16.07% Native American, 0.30% Asian, 0.37% from other races, and 1.23% from two or more races. About 0.90% of the population were Hispanics or Latinos of any race. About 29.6% were ofGerman,7.8%Irish,6.7%Norwegian,5.9%Polish,5.2%Swedish,and 5.2%Englishancestry; 95.4% spokeEnglish,2.0%Ojibwaand 1.1%Spanishas their first language.
Of the 6,640 households, 27.5% had children under 18 living with them, 54.2% were married couples living together, 10.0% had a female householder with no husband present, and 31.0% were not families. About 26.2% of all households were made up of individuals, and 11.7% had someone living alone who was 65 or older. The average household size was 2.39, and the average family size was 2.86.
In the county, the age distribution was 24.1% under the age of 18, 6.0% from 18 to 24, 24.6% from 25 to 44, 27.4% from 45 to 64, and 17.9% who were 65 or older. The median age was 42 years. For every 100 females, there were 101.8 males. For every 100 females 18 and over, there were 101.0 males.
In 2017, 167 births occurred, with a general fertility rate of 74.5 births per 1000 women aged 15–44, the eighth-highest rate out of all 72 Wisconsin counties.[18]Additionally, fewer than five induced abortions were reported as performed on women of Sawyer County residence in 2017.[19]
Communities
[edit]City
[edit]- Hayward(county seat)
Villages
[edit]Towns
[edit]Census-designated places
[edit]- Chief Lake
- Little Round Lake
- New Post
- Reserve
- Stone Lake(partial)
Unincorporated communities
[edit]Politics
[edit]| Year | Republican | Democratic | Third party(ies) | |||
|---|---|---|---|---|---|---|
| No. | % | No. | % | No. | % | |
| 2020 | 5,909 | 56.22% | 4,498 | 42.80% | 103 | 0.98% |
| 2016 | 5,185 | 56.75% | 3,503 | 38.34% | 449 | 4.91% |
| 2012 | 4,442 | 49.22% | 4,486 | 49.71% | 97 | 1.07% |
| 2008 | 4,199 | 46.22% | 4,765 | 52.45% | 121 | 1.33% |
| 2004 | 4,951 | 52.37% | 4,411 | 46.66% | 91 | 0.96% |
| 2000 | 3,972 | 51.14% | 3,333 | 42.91% | 462 | 5.95% |
| 1996 | 2,603 | 40.20% | 2,773 | 42.83% | 1,099 | 16.97% |
| 1992 | 2,658 | 36.09% | 2,796 | 37.96% | 1,911 | 25.95% |
| 1988 | 3,260 | 49.88% | 3,231 | 49.43% | 45 | 0.69% |
| 1984 | 3,913 | 56.14% | 2,982 | 42.78% | 75 | 1.08% |
| 1980 | 3,548 | 50.07% | 3,065 | 43.25% | 473 | 6.68% |
| 1976 | 2,720 | 46.06% | 3,055 | 51.74% | 130 | 2.20% |
| 1972 | 3,081 | 62.52% | 1,765 | 35.82% | 82 | 1.66% |
| 1968 | 2,475 | 52.17% | 1,830 | 38.58% | 439 | 9.25% |
| 1964 | 2,012 | 43.62% | 2,591 | 56.17% | 10 | 0.22% |
| 1960 | 2,699 | 53.59% | 2,325 | 46.17% | 12 | 0.24% |
| 1956 | 2,823 | 64.54% | 1,520 | 34.75% | 31 | 0.71% |
| 1952 | 3,146 | 67.02% | 1,527 | 32.53% | 21 | 0.45% |
| 1948 | 2,257 | 49.51% | 2,177 | 47.75% | 125 | 2.74% |
| 1944 | 2,421 | 55.02% | 1,947 | 44.25% | 32 | 0.73% |
| 1940 | 2,745 | 52.46% | 2,439 | 46.61% | 49 | 0.94% |
| 1936 | 1,726 | 36.47% | 2,834 | 59.88% | 173 | 3.66% |
| 1932 | 1,179 | 31.86% | 2,381 | 64.35% | 140 | 3.78% |
| 1928 | 1,882 | 61.44% | 1,129 | 36.86% | 52 | 1.70% |
| 1924 | 990 | 37.53% | 135 | 5.12% | 1,513 | 57.35% |
| 1920 | 1,668 | 79.28% | 302 | 14.35% | 134 | 6.37% |
| 1916 | 550 | 46.57% | 562 | 47.59% | 69 | 5.84% |
| 1912 | 295 | 32.45% | 432 | 47.52% | 182 | 20.02% |
| 1908 | 815 | 70.81% | 299 | 25.98% | 37 | 3.21% |
| 1904 | 782 | 75.92% | 205 | 19.90% | 43 | 4.17% |
| 1900 | 723 | 68.53% | 305 | 28.91% | 27 | 2.56% |
| 1896 | 514 | 56.30% | 369 | 40.42% | 30 | 3.29% |
| 1892 | 412 | 52.62% | 328 | 41.89% | 43 | 5.49% |
Sawyer County had a historical reputation for being a bellwether county in presidential elections, having voted for the overall national winner in every election from 1964 to 2016. Similar to other bellwether counties, this streak was broken in 2020 when the county backedDonald Trumpover eventual winnerJoe Biden.[21]This is because of increasing geographic polarization in American politics, with fewer and fewer counties swinging between parties, and instead voting consistently for one party according to demographics.[22]
See also
[edit]References
[edit]- ^abcd"2020 Decennial Census: Sawyer County, Wisconsin".data.census.gov.U.S. Census Bureau.RetrievedJuly 11,2022.
- ^"Find a County".National Association of Counties.RetrievedJune 7,2011.
- ^"Local Lore"(PDF).Town of Round Lake.Archived(PDF)from the original on October 9, 2022.RetrievedJuly 11,2022.
- ^"Oral History Documentation: The Battle of the Horsefly (circa 1795)".Chippewa Flowage Lake Association. Archived from the original on October 27, 2019.RetrievedJuly 11,2022.
{{cite web}}:CS1 maint: unfit URL (link) - ^Collections of the State Historical Society of Wisconsin.Vol. 19. Reuben Gold Thwaites (ed.). Madison: State Historical Society of Wisconsin. 1910. p. 171.
{{cite book}}:CS1 maint: others (link) - ^"Lac Courte Oreilles Band of Lake Superior Chippewa".Wisconsin Department of Public Instruction. September 1, 2017.RetrievedJuly 11,2022.
- ^"Winnebago Took Its Name from an Indian Tribe".The Post-Crescent.December 28, 1963. p. 14.RetrievedAugust 25,2014– viaNewspapers.

- ^History of Education in Sawyer County, Wisconsin by J. G. Adams (M.E. Granger, 1902)
- ^"Wisconsin: Individual County Chronologies".Wisconsin Atlas of Historical County Boundaries.The Newberry Library.2007. Archived fromthe originalon April 14, 2017.RetrievedAugust 15,2015.
- ^"2010 Census Gazetteer Files".United States Census Bureau. August 22, 2012.RetrievedAugust 9,2015.
- ^"sawyer2008.pdf"(PDF).Archived fromthe original(PDF)on June 2, 2010.RetrievedMarch 16,2024.
- ^"U.S. Decennial Census".United States Census Bureau.RetrievedAugust 9,2015.
- ^"Historical Census Browser".University of Virginia Library.RetrievedAugust 9,2015.
- ^Forstall, Richard L., ed. (March 27, 1995)."Population of Counties by Decennial Census: 1900 to 1990".United States Census Bureau.RetrievedAugust 9,2015.
- ^"Census 2000 PHC-T-4. Ranking Tables for Counties: 1990 and 2000"(PDF).United States Census Bureau. April 2, 2001.Archived(PDF)from the original on October 9, 2022.RetrievedAugust 9,2015.
- ^"State & County QuickFacts".United States Census Bureau. Archived fromthe originalon June 6, 2011.RetrievedJanuary 23,2014.
- ^"U.S. Census website".United States Census Bureau.RetrievedMay 14,2011.
- ^"Annual Wisconsin Birth and Infant Mortality Report, 2017 P-01161-19 (June 2019): Detailed Tables".Archived fromthe originalon June 19, 2019.RetrievedJune 20,2019.
- ^Reported Induced Abortions in Wisconsin,Office of Health Informatics, Division of Public Health, Wisconsin Department of Health Services. Section: Trend Information, 2013-2017, Table 18, pages 17-18
- ^Leip, David."Dave Leip's Atlas of U.S. Presidential Elections".uselectionatlas.org.RetrievedFebruary 8,2021.
- ^Matsumoto, Ryan (February 1, 2021)."Where Did All The Bellwether Counties Go?".FiveThirtyEight.
- ^"Political Polarization's Geographic Roots Run Deep".RetrievedApril 11,2021.
Further reading
[edit]- Clark, W. N. and M. H. Clark.A Short History of Southern Sawyer County.Eau Claire, Wis.: Wisconsin Colonization Co., 1920.
External links
[edit]- Sawyer County government website
- Sawyer County mapfrom the Wisconsin Department of Transportation


