
Tennessee's 1st congressional district
| Tennessee's 1st congressional district | |
|---|---|
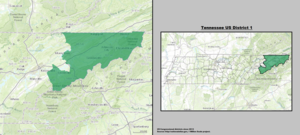
Interactive map of district boundaries since January 3, 2023 | |
| Representative | |
| Distribution |
|
| Population (2022) | 781,128[2] |
| Median household income | $54,716[3] |
| Ethnicity |
|
| Cook PVI | R+30[4] |

Tennessee's 1st congressional districtis the congressional district of northeastTennessee,including all ofCarter,Cocke,Greene,Hamblen,Hancock,Hawkins,Johnson,Sullivan,Unicoi,Washington,andSeviercounties and parts ofJefferson County.It is largely coextensive with the Tennessee portion of theTri-Citiesregion of northeast Tennessee and southwestVirginia.With aCook Partisan Voting Indexrating of R+30, it is the most Republican district in Tennessee.[4]
Cities and towns represented within the district includeBlountville,Bristol,Church Hill,Elizabethton,Erwin,Gatlinburg,Greeneville,Johnson City,Jonesborough,Kingsport,Morristown,Mountain CityNewport,Pigeon Forge,Roan MountainRogersville,Sneedville,SeviervilleandTusculum.The 1st district's seat in theU.S. House of Representativeshas been held byRepublicanssince 1881.
The district was created in 1805 when theat-large seatwas divided among multiple districts.
The district's current representative is RepublicanDiana Harshbarger,who was first elected in 2020 following the retirement of RepublicanPhil Roe.[5]
Election results from statewide races[edit]
These results vary from older lines to current
| Year | Office | Result |
|---|---|---|
| 1998 | Governor | Sundquist77% -Hooker23% |
| 2000 | President | George W. Bush61% –Al Gore38% |
| Senate | Frist75% - Clark 25 | |
| 2002 | Senate | Alexander66% -Clement34% |
| Governor | Hilleary57% -Bredesen43% | |
| 2004 | President | George W. Bush68% –John Kerry31% |
| 2006 | Governor | Bredesen59% -Bryson41% |
| Senate | Corker62% -Ford Jr.38% | |
| 2008 | President | John McCain70% –Barack Obama28.6% |
| Senate | Alexander76% -Tuke24% | |
| 2010 | Governor | Haslam78% -McWherter22% |
| 2012 | President | Mitt Romney72.7% –Barack Obama25.7% |
| Senate | Corker77% -Clayton23% | |
| 2014 | Governor | Bill Haslam78% - Brown 22% |
| Senate | Alexander71% -Ball29% | |
| 2016 | President | Donald Trump76.7% –Hillary Clinton19.7% |
| 2018 | Governor | Lee78% -Dean22% |
| Senate | Blackburn72% -Bredesen28% | |
| 2020 | President | Donald Trump76.2% –Joe Biden22.1% |
| Senate | Hagerty80% -Bradshaw20% | |
| 2022 | Governor | Lee78.6% – Martin 20% |
History[edit]
The 1st has generally been avery secure voting districtfor theRepublican Partysince theAmerican Civil War,and is one of only two ancestrally Republican districts in the state (the other being the neighboring2nd district).

U.S. Representatives Andrew Jackson (1796–1797, at large) and Andrew Johnson (1843–1853, 1st) represented this area and later served as President of the United States
Republicans (or their antecedents) have held the seat continuously since 1881 and for all but four years since 1859, while Democrats (or their antecedents) have held the congressional seat for all but eight years from when Andrew Jackson was first elected to the U.S. House of Representatives in 1796 (as the state's singleat largerepresentative) up to the term of Albert Galiton Watkins ending in 1859.
Andrew Johnson,the seventeenthPresident of the United States,represented the district from 1843 to 1853.
Like the rest of East Tennessee,slaverywas not as common in this area as the rest of the state due to its mountain terrain, which was dominated by small farms instead of plantations.[6]The district was also the home of the first exclusively abolitionist periodicals in the nation,The Manumission IntelligencerandThe Emancipator,founded in Jonesborough byElihu Embreein 1819.[7]
The 1st was one of four districts in Tennessee whose congressmen did not resign when Tennessee seceded from theUnionin 1861.Thomas Amos Rogers Nelsonwas reelected as aUnionist(the name used by a coalition of Republicans, northernDemocratsand anti-Confederate Southern Democrats) to theThirty-seventh Congress,but he was arrested byConfederatetroops while en route toWashington, D.C.and taken to Richmond. Nelson was paroled and returned home to Jonesborough, where he kept a low profile for the length of his term.[8]
Due to these factors, this area — excepting "Little Confederacy" Sullivan County with its deep ties to neighbouring Virginia — supported the Union over the Confederacy in the Civil War, and identified with the Republican Party after Tennessee was readmitted to the Union in 1866, electing candidates representing theUnionist Party— a merger of Republicans and pro-Union Democrats — both before and after the war. This allegiance has continued through good times and bad ever since, with Republicans dominating every level of government. While a few Democratic pockets exist in the district's urban areas, they are not enough to sway the district. Since 1898, Democrats have only crossed the 40 percent barrier twice, in 1962 and 1976.
The district's Republican bent is no less pronounced at the presidential level. It was one of the few areas of Tennessee whereBarry Goldwaterdid well in 1964. Johnson, Carter, Unicoi, Washington, Cocke, Sevier and Hancock Counties are among the few counties in the country to have never supported a Democrat for president since the Civil War.Franklin D. Rooseveltturned in respectable showings in the district during his four runs for president, as didJimmy Carterin 1976. However, Carter is the last Democrat to carry any county in the district, and apart from Sullivan County, which except in the Catholicism-dominated 1928 election was consistently Democratic up to 1948, andHamblen Countyin that 1976 election, no county in the present district has backed a Democrat for President since 1940.
The district typically gives its congressmen very long tenures in Washington; indeed, it elected some of the few truly senior Southern Republican congressmen before the 1950s. Only nine people have represented it since 1921. Two of them,B. Carroll ReeceandJimmy Quillen,are the longest-serving members of the House in Tennessee history. Reece held the seat for all but six years from 1921 and 1961, while Quillen held it from 1963 to 1997.
List of members representing the district[edit]


Recent election results[edit]
2012[edit]
| Party | Candidate | Votes | % | ||
|---|---|---|---|---|---|
| Republican | Phil Roe(Incumbent) | 182,252 | 76 | ||
| Democratic | Alan Woodruff | 47,663 | 19.9 | ||
| Green | Robert N. Smith | 2,872 | 1.2 | ||
| Independent | Karen Brackett | 4,837 | 2 | ||
| Independent | Michael Salyer | 2,048 | 0.9 | ||
| Total votes | 239,672 | 100 | |||
| Republicanhold | |||||
2014[edit]
| Party | Candidate | Votes | % | |
|---|---|---|---|---|
| Republican | Phil Roe(incumbent) | 115,533 | 82.8 | |
| Independent | Robert D. Franklin | 9,906 | 7.1 | |
| Green | Robert N. Smith | 9,869 | 7.1 | |
| Independent | Michael D. Salyer | 4,148 | 3.0 | |
| Independent | Scott Kudialis (write-in) | 14 | 0.0 | |
| Total votes | 139,470 | 100.0 | ||
| Republicanhold | ||||
2016[edit]
| Party | Candidate | Votes | % | |
|---|---|---|---|---|
| Republican | Phil Roe(incumbent) | 198,293 | 78.4 | |
| Democratic | Alan Bohms | 39,024 | 15.4 | |
| Independent | Robert Franklin | 15,702 | 6.2 | |
| Independent | Paul Krane (write-in) | 6 | 0.0 | |
| Total votes | 253,025 | 100.0 | ||
| Republicanhold | ||||
2018[edit]
| Party | Candidate | Votes | % | |
|---|---|---|---|---|
| Republican | Phil Roe(incumbent) | 172,835 | 77.1 | |
| Democratic | Marty Olsen | 47,138 | 21.0 | |
| Independent | Michael Salyer | 4,309 | 1.9 | |
| Total votes | 224,282 | 100.0 | ||
| Republicanhold | ||||
2020[edit]
| Party | Candidate | Votes | % | |
|---|---|---|---|---|
| Republican | Diana Harshbarger | 228,181 | 74.7 | |
| Democratic | Blair Walsingham | 68,617 | 22.5 | |
| Independent | Steve Holder | 8,621 | 2.8 | |
| Write-in | 4 | 0.0 | ||
| Total votes | 305,423 | 100.0 | ||
| Republicanhold | ||||
2022[edit]
| Party | Candidate | Votes | % | |
|---|---|---|---|---|
| Republican | Diana Harshbarger(incumbent) | 147,253 | 78.3 | |
| Democratic | Cameron Parsons | 37,032 | 19.7 | |
| Independent | Richard Baker | 2,466 | 1.3 | |
| Independent | Matt Makrom | 1,245 | 0.7 | |
| Total votes | 187,996 | 100.0 | ||
| Republicanhold | ||||
See also[edit]
Sources[edit]
References[edit]
- ^"Congressional Districts Relationship Files (state-based)".census.gov.US Census Bureau Geography.
- ^"My Congressional District".census.gov.Center for New Media & Promotion (CNMP), US Census Bureau.
- ^"My Congressional District".
- ^ab"2022 Cook PVI: District Map and List".Cook Political Report.July 12, 2022.RetrievedJanuary 10,2023.
- ^Pathé, Simone (January 3, 2020)."Tennessee's Phil Roe won't run for reelection in 2020".Roll Call.Washington, D.C.RetrievedJanuary 3,2020.
- ^"Tennessee Encyclopedia of History and Culture: Slavery".tennesseeencyclopedia.net.Archived fromthe originalon September 27, 2007.
- ^"First Abolition Publications 1A82 - Jonesborough, Tn. - Tennessee Historical Markers on Waymarking".waymarking.
- ^""A Patriot's Voice", Neal O'Steen, Tennessee Alumnus Summer 1997 ".utk.edu.Archived fromthe originalon June 18, 2010.
- ^L.A. Coolidge (1897)."Tennessee".Official Congressional Directory: Fifty-Fifth Congress.1991/1992-: S. Pub. Washington DC: Government Printing Office.
- ^"November 4, 2014 General Election Results"(PDF).Secretary of State of Tennessee. December 3, 2014.RetrievedOctober 23,2022.
- ^"November 2016 US House Results by County"(PDF).Secretary of State of Tennessee. December 13, 2016.RetrievedOctober 23,2022.
- ^Johnson, Cheryl L. (February 28, 2019)."Statistics of the Congressional Election of November 6, 2018".Clerk of the U.S. House of Representatives.RetrievedApril 27,2019.
- ^State of Tennessee General Election Results, November 3, 2020, Results By Office(PDF)(Report). Secretary of State of Tennessee. December 2, 2020.RetrievedDecember 2,2020.
- Martis, Kenneth C. (1989).The Historical Atlas of Political Parties in the United States Congress.New York: Macmillan Publishing Company.
- Martis, Kenneth C. (1982).The Historical Atlas of United States Congressional Districts.New York: Macmillan Publishing Company.
- Congressional Biographical Directory of the United States 1774–present