| Documentation | Build Status | Help |
|---|---|---|
 |
Gadflyis a plotting and data visualization system written in Julia.
It's influenced heavily by Leland Wilkinson's bookThe Grammar of Graphics and Hadley Wickham's refinement of that grammar inggplot2.
If you useGadflyin a publication please consider citing it:
- Renders publication quality graphics to SVG, PNG, Postscript, and PDF
- Intuitive and consistent plotting interface
- Works withIJuliaandPluto.jlout of the box
- Tight integration withDataFrames.jl
- Interactivity like panning, zooming, toggling powered bySnap.svg
- Supports a large number of common plot types
Gadflyis registered inJulia'sGeneralregistryand so can be installed usingPkg.add.
Pkg.add("Gadfly")To create a plot it's as simple as:
usingGadfly
plot(y=[1,2,3])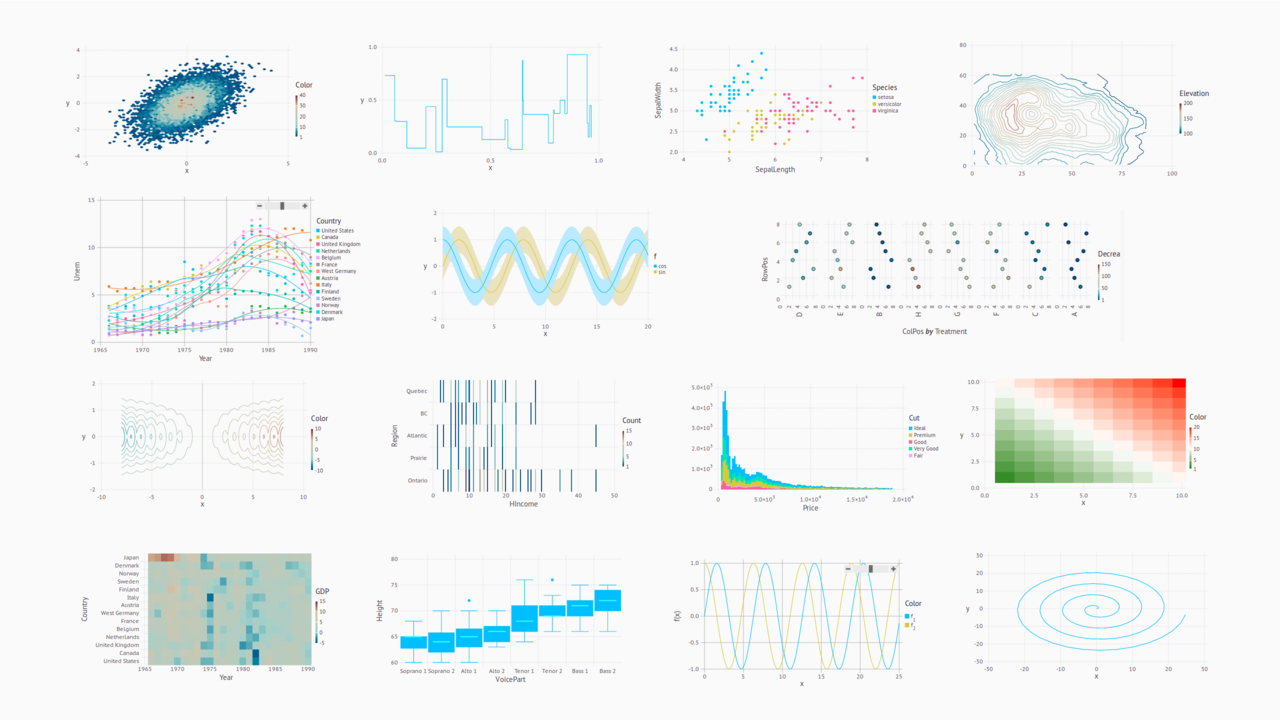
- STABLE—most recently tagged version of the documentation.
- DEVEL—in-development version of the documentation.
This is a new and fairly complex piece of software.Filing an issueto report a bug, counterintuitive behavior, or even requesting a feature is extremely valuable in helping us prioritize what to work on, so don't hesitate.
If you have a question then you can ask for help in the plotting team of the Julia Slack channelor theGitter chat room.