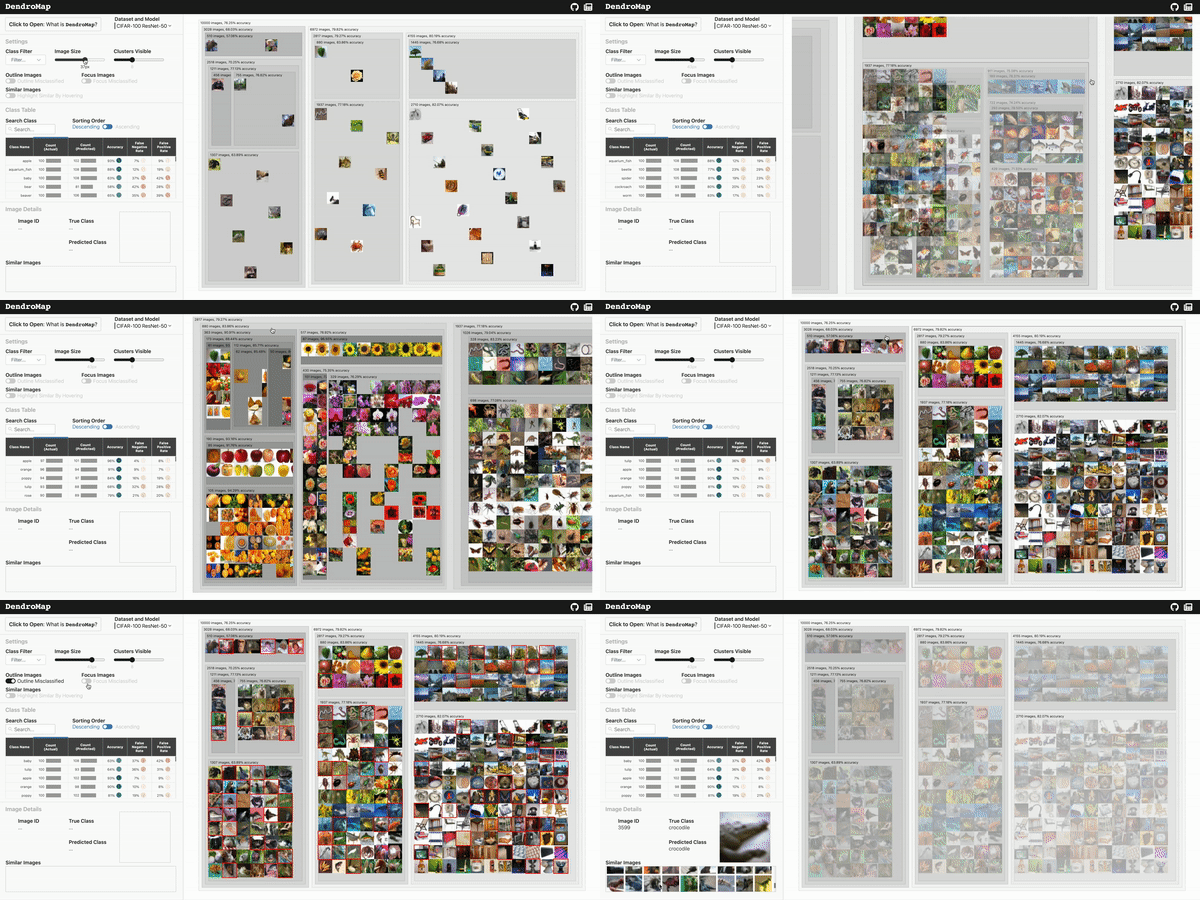
DendroMapis an interactive tool to explore large-scale image datasets used for machine learning.
A deep understanding of your data can be vital to train or debug your model effectively. However, due to the lack of structure and little-to-no metadata, it can be difficult to gain any insight into large-scale image datasets.
DendroMap adds structure to the data by hierarchically clustering together similar images. Then, the clusters are displayed in a modified treemap visualization that supports zooming.

Check out thelive demo of DendroMapand explore for yourself on a few different datasets. If you're interested in
- the DendroMap motivations
- how we created the DendroMap visualization
- DendroMap's effectiveness: user study on DendroMap compared to t-SNE grid for exploration
be sure to also check out our research paper:
DendroMap: Visual Exploration of Large-Scale Image Datasets for Machine Learning with Treemaps.
Donald Bertucci, Md Montaser Hamid, Yashwanthi Anand, Anita Ruangrotsakun, Delyar Tabatabai, Melissa Perez, and Minsuk Kahng.
arXiv preprint arXiv:2205.06935,2022.
In thepublic deployment,we hosted our data in theDendroMap Datarepository. You can use your own data by following the instructions and example in theDendroMap DataREADME.mdand you can use our Python functions found in theclusteringfolder in this repo. There, you will find specific examples and instructions for how to generate the clustering files.
After generating those files, you can add another option in thesrc/dataOptions.jsfile as an object to specify how to read your data with the correct format. This is also detailed in theDendroMap DataREADME.md,and is simple as adding an option like this:
{
dataset:"YOUR DATASET NAME",
model:"YOUR MODEL NAME",
cluster_filepath:"CLUSTER_FILEPATH",
class_cluster_filepath:"CLASS_CLUSTER_FILEPATH**OPTIONAL**",
image_filepath:"IMAGE_FILEPATH",
}
in thesrc/dataOptions.jsoptions array. Paths start from thepublicfolder, so put your data in there. For more information, go to theREADME.mdin theclusteringfolder. Notebooks that computed the data inDendroMap Dataare located there.
The DendroMap treemap visualization itself (not the whole project) only relies on havingd3.jsand the accompanying Javascript files in thesrc/components/dendroMapdirectory. You can reuse thatSveltecomponent by importing
fromsrc/components/dendroMap/DendroMap.svelte.
The Component is used insrc/App.sveltefor an example on what props it takes. Here is the rundown of a simple example: at the bare minimum you can create the DendroMap component with these props (propName:type).
<DendroMap
dendrogramData:dendrogramNode// (root node as nested JSON from dendrogram-data repo)
imageFilepath:string// relative path from public dir
imageWidth:number
imageHeight:number
width:number
height:number
numClustersShowing:number// > 1
/>
A more comprehensive list of props is below, but please look in thesrc/components/dendroMap/DendroMap.sveltefile to see more details: there are many defaults arguments.
<DendroMap
dendrogramData:dendrogramNode// (root node as nested JSON from dendrogram-data repo)
imageFilepath:string// relative path from public dir
imageWidth:number
imageHeight:number
width:number
height:number
numClustersShowing:number// > 1

// the very long list of optional props that you can use to customize the DendroMap
//? is not in the actual name, just indicates optional
highlightedOpacity?:number// between [0.0, 1.0]
hiddenOpacity?:number// between [0.0, 1.0]
transitionSpeed?:number// milliseconds for the animation of zooming
clusterColorInterpolateCallback?:(normalized:number)=>string// by default uses d3.interpolateGreys
labelColorCallback?:(d:d3.HierarchyNode)=>string
labelSizeCallback?:(d:d3.HierarchyNode)=>string
misclassificationColor?:string
outlineStrokeWidth?:string
outerPadding?:number// the outer perimeter space of a rects
innerPadding?:number// the touching inside space between rects
topPadding?:number// additional top padding on the top of rects
labelYSpace?:number// shifts the image grid down to make room for label on top

currentParentCluster?:d3.HierarchyNode// this argument is used to bind: for svelte, not really a prop
// breadth is the default and renders nodes left to right breadth first traversal
// min_merging_distance is the common way to get dendrogram clusters from a dendrogram
// max_node_count traverses and splits the next largest sized node, resulting in an even rendering
renderingMethod?:"breadth"|"min_merging_distance"|"max_node_count"|"custom_sort"
// this is only in effect if the renderingMethod is "custom_sort". Nodes last are popped and rendered first in the sort
customSort?:(a:dendrogramNode,b:dendrogramNode)=>number// see example in code
imagesToFocus?:number[]// instance index of the ones to highlight
outlineMisclassified?:boolean
focusMisclassified?:boolean
clusterLabelCallback?:(d:d3.HierarchyNode)=>string
imageTitleCallback?:(d:d3.HierarchyNode)=>string

// will fire based on user interaction
// detail contains <T> {data: T, element: HTMLElement, event}
on:imageClick?:({detail})=>void
on:imageMouseEnter?:({detail})=>void
on:imageMouseLeave?:({detail})=>void
on:clusterClick?:({detail})=>void
on:clusterMouseEnter?:({detail})=>void
on:clusterMouseLeave?:({detail})=>void
/>This project usesSvelte.You can run the code on your local machine by using one of the following: development or build.
cddendromap#inside the dendromap directory
npm install#install packages if you haven't
npm run dev#live-reloading server on port 8080
then navigate toport 8080for a live-reloading on file change development server.
cddendromap#inside the dendromap directory
npm install#install packages if you haven't
npm run build#build project
npm run start#run on port 8080
then navigate toport 8080for the static build server.
- DendroMap Live Site
- DendroMap Paper
- DendroMap Code(you are here)
- DendroMap Data
@article{bertucci2022dendromap,
title={DendroMap: Visual Exploration of Large-Scale Image Datasets for Machine Learning with Treemaps},
author={Bertucci, Donald and Hamid, Md Montaser and Anand, Yashwanthi and Ruangrotsakun, Anita
and Tabatabai, Delyar and Perez, Melissa and Kahng, Minsuk},
journal={IEEE Transactions on Visualization and Computer Graphics (IEEE VIS 2022 Conference)},
year={2022},
publisher={IEEE},
url={https://div-lab.github.io/dendromap/}
}
to appear inVIS 2022.