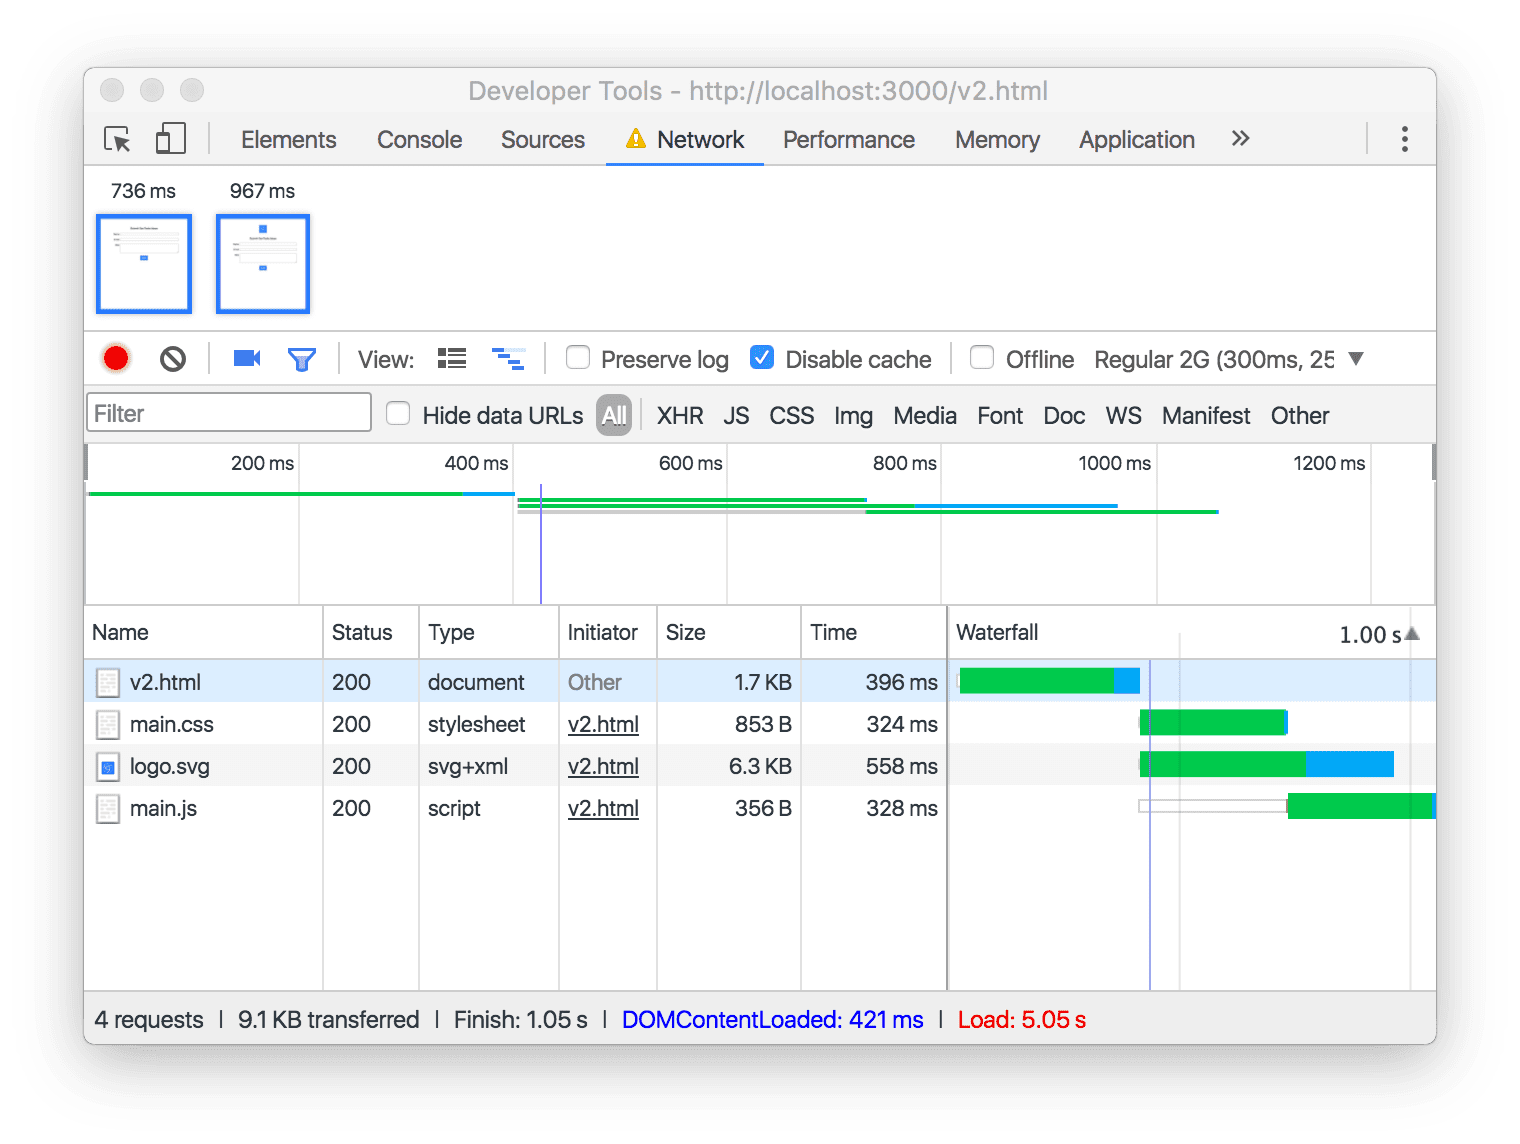
The Network panel in your browser's DevTools helps identify what resources are loaded and when they are loaded. Each row in the Network panel corresponds to a specific URL that your web app has loaded.

Know what you load
Coming up with the right caching strategies for your web application requires getting a handle onwhatexactly you're loading. When building a reliable web application, the network can be subject to all kinds of dark forces. You need to understand the network's vulnerabilities if you hope to cope with them in your app.
You might think that you already have a pretty good idea as to what your web application loads. If you're just using a small scattering of static HTML, JavaScript, CSS, and image files, that might be true. But as soon as you start mi xing in third-party resources hosted on content delivery networks, using dynamic API requests and server-generated responses, the picture quickly becomes murkier.
A caching strategy that makes sense for a few small CSS files probably won't make sense for hundreds of large images, for instance.
Know when you load
Another part of the overall loading picture iswheneverything gets loaded.
Some requests to the network, such as the navigation request for your initial HTML, are made unconditionally as soon as a user visits a given URL. That HTML might contain hardcoded references to critical CSS or JavaScript files that must also load in order to display your interactive page. These requests all sit in your critical loading path. You will need to aggressively cache these to be reliably fast.
Other resources, such as API requests or lazy-loaded assets, might not start to load until well after all of the initial loading is complete. If those requests only happen following a specific sequence of user interactions, then a completely different set of resources might end up being requested across multiple visits to the same page. A less aggressive caching strategy is often appropriate for content that you've identified as being outside the critical loading path.
The Name and Type columns help with the what
The Name and Type columns help provide a meaningful picture ofwhat's being loaded. The answer to "what's loading? "in the example above is a total of four URLs, each representing a unique type of content.

The Name represents the URL that your browser requested—though you'll only see
the last portion of the URL's path listed. For example, if
https://example /main.cssis loaded, you'd only end up seeingmain.css
listed under Name.
The last few characters of the URL's path, following the
period (e.g. "css" ), are known as the URL's extension.
The URL's extension generally tells you what type of resource is being requested,
and maps directly to the information shown in the Type column. For example,
v2.htmlis a document, andmain.cssis a stylesheet.
The Waterfall column helps with the when
Examine the Waterfall column, starting at the top and working your way down. The length of each bar represents the total amount of time that was spent loading each resource. How can you tell the difference between a request that's made as part of the critical loading path and a request that's fired off dynamically, long after the page's initial load is complete?
The first request in the waterfall is always going to be for the HTML document,
for example,v2.html.All of the subsequent requests will flow (like a
waterfall!) from this initial navigation request, based on what images, scripts,
and styles the HTML document references.

The waterfall shows that as soon asv2.htmlhas finished loading, the requests
for the assets it references (also referred to assubresources) start. The
browser can request multiple subresources at the same time, and that's
represented by the overlapping bars in the Waterfall column formain.cssand
logo.svg.Finally, you can see from the screenshot thatmain.jsstarts
loading last, and it finishes loading after the other three URLs have completed
as well.

